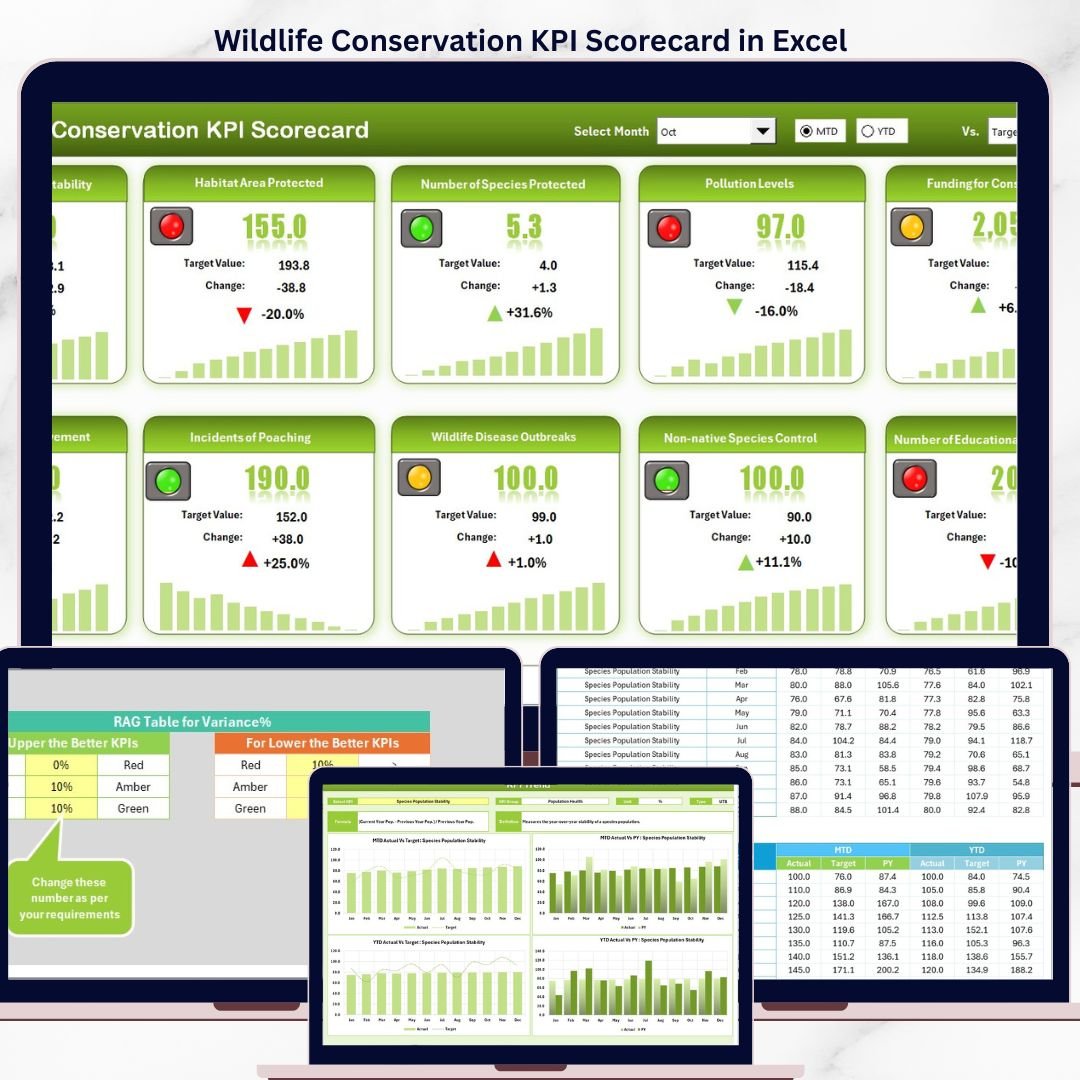
Whether you manage a national park, run a wildlife NGO, or coordinate habitat restoration projects, tracking species populations, funding utilization, patrol coverage, and volunteer engagement manually is inefficient and error-prone. This ready-to-use scorecard template replaces scattered spreadsheets and expensive conservation software with a structured, formula-driven performance monitoring system.
Key Features of Wildlife Conservation KPI Scorecard in Excel
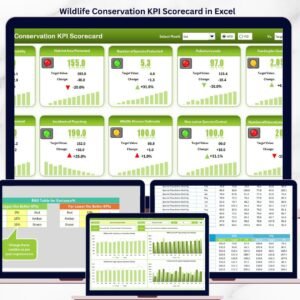
The Wildlife Conservation KPI Scorecard in Excel includes 4 worksheets designed for structured conservation performance monitoring. The Scorecard sheet displays all KPIs with Actual vs Target values and conditional formatting. The KPI Trend sheet provides individual metric analysis with MTD and YTD trend charts. Here are the main features:
- Scorecard Dashboard View — Displays all conservation KPIs with Actual vs Target values, MTD and YTD comparisons, and visual performance indicators using conditional formatting. Select any month from the dropdown to update all metrics instantly.
- KPI Trend Analysis — Select any individual KPI from a dropdown to view its Group, Unit, Type (Lower the Better or Upper the Better), Formula, and Definition alongside MTD and YTD trend charts comparing Actual, Target, and Previous Year numbers.
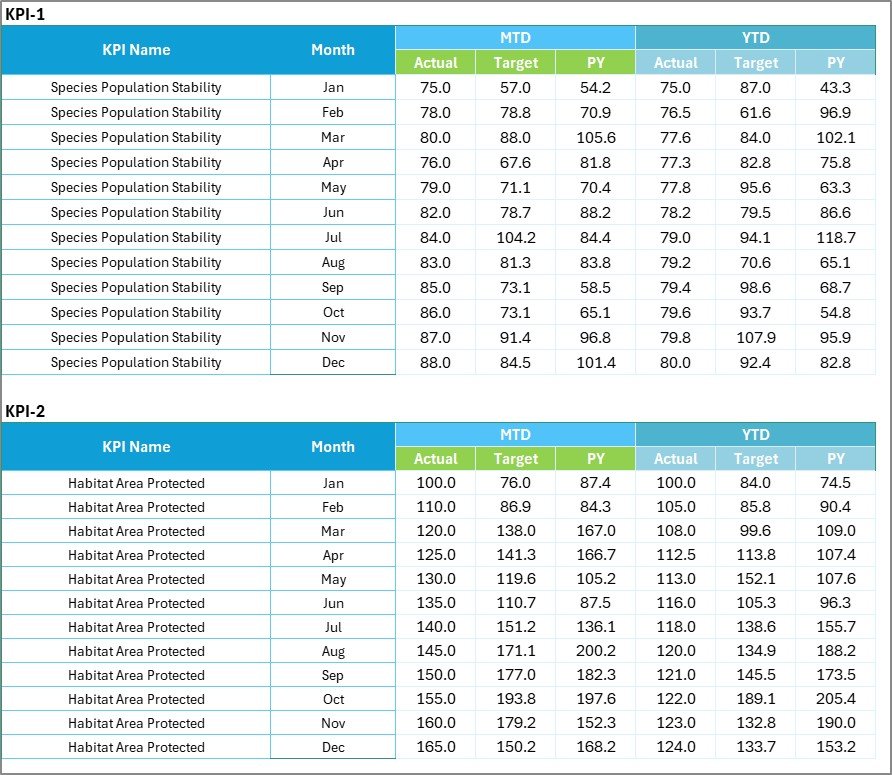
- Structured Data Entry — The Input Data sheet provides a clean layout for recording monthly actual values, targets, and historical data for each KPI.
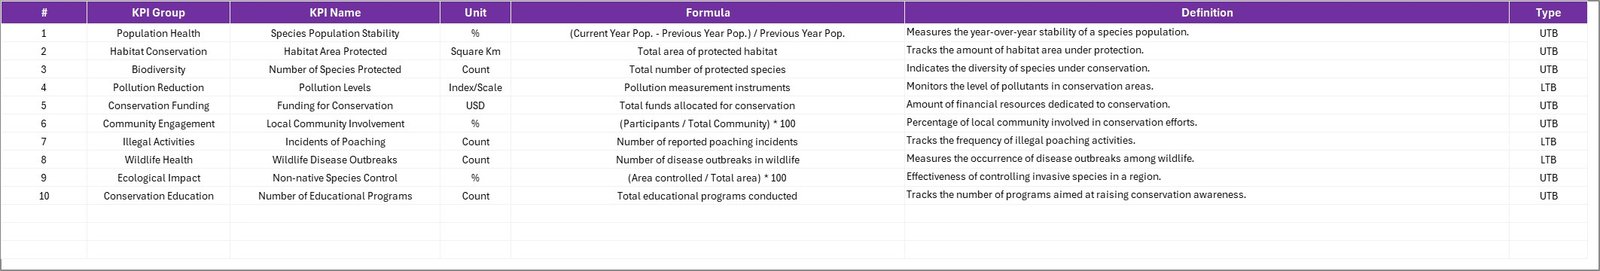
- Built-in KPI Knowledge Base — The KPI Definition sheet stores each KPI’s name, group, unit, formula, and definition so every team member understands what each metric measures.
- Automatic Calculations — All MTD, YTD, variance, and trend calculations are formula-driven with no manual computation needed.
- Conservation-Specific Metrics — Track species population counts, habitat restoration acres, anti-poaching patrol coverage, funding utilization rates, volunteer engagement hours, and endangered species recovery indices.
Scorecard Pages Explanation
1. Scorecard Sheet
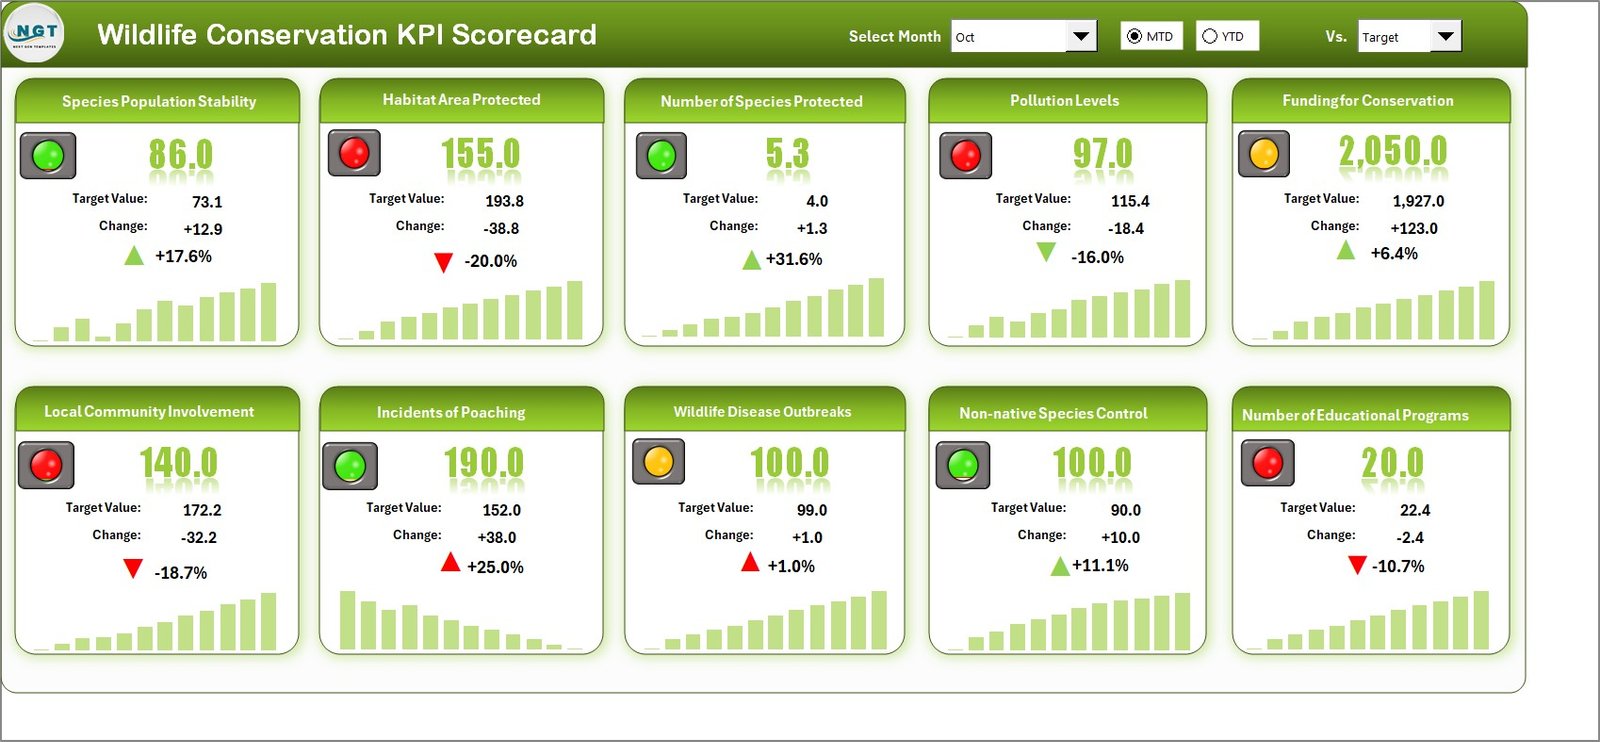
Wildlife Conservation KPI Scorecard in ExcelThe Scorecard sheet is the main interface where you can view KPI performance. Key features include:
- Dropdown Menus: Select the month, MTD (Month-to-Date), or YTD (Year-to-Date) for performance analysis.
- Actual vs Target Values: Compare actual performance against targets for each KPI.
- Visual Indicators: Quickly see performance status using color-coded visuals or conditional formatting.
- Comprehensive KPI Overview: Display all relevant information about KPIs, including MTD and YTD comparisons.
2. KPI Trend Sheet
 KPI Trend Sheet
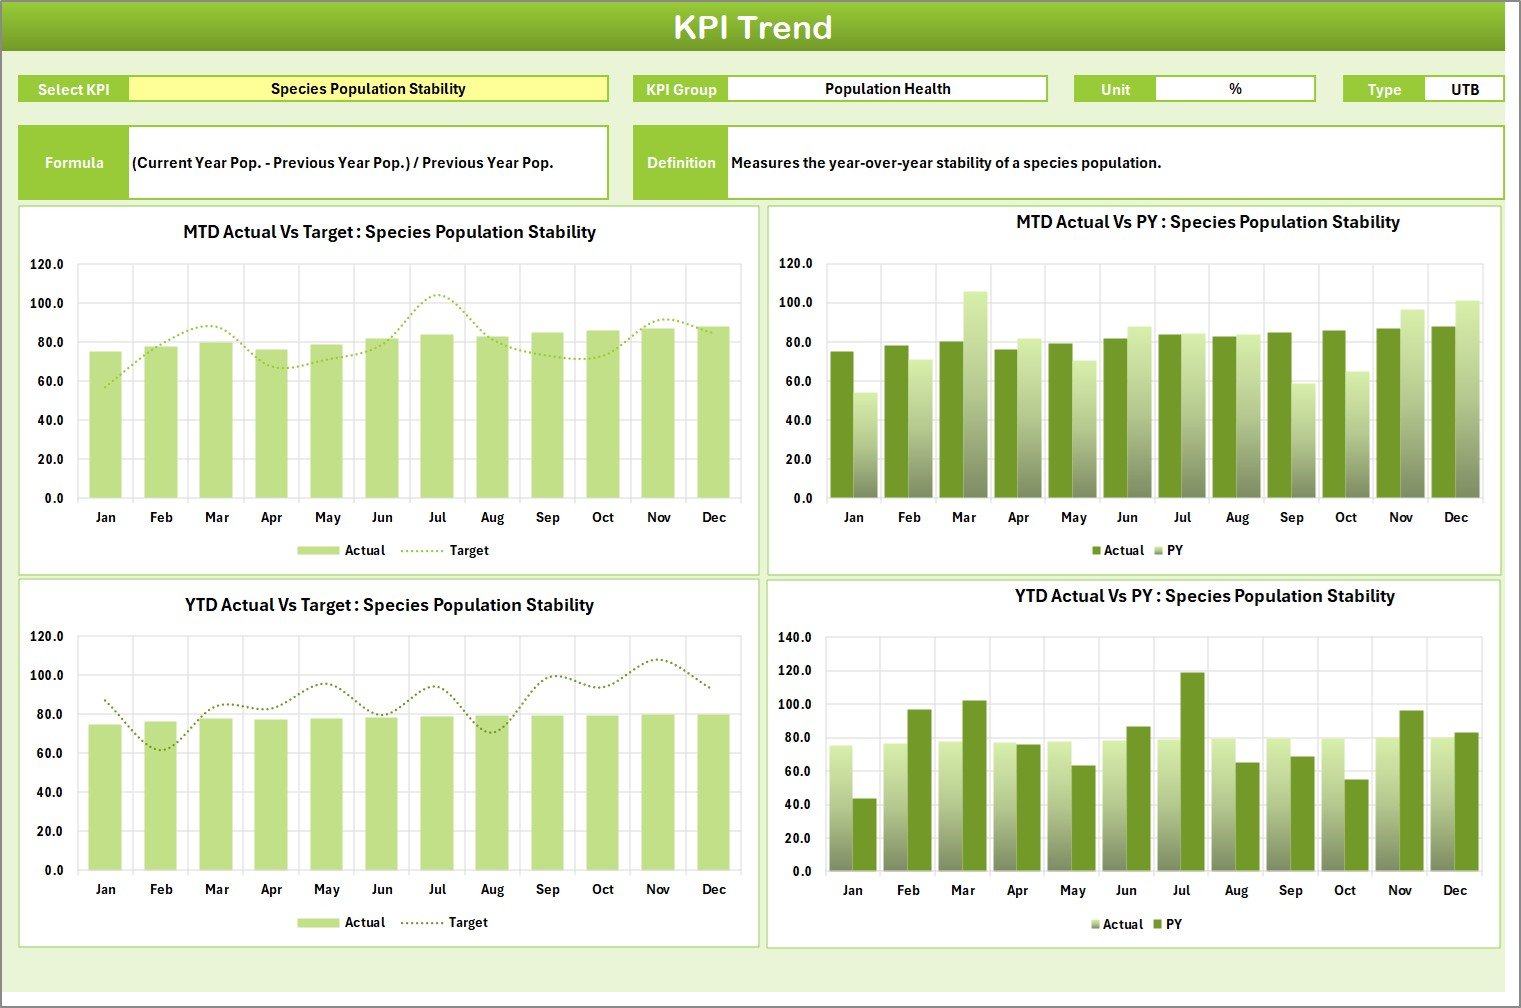
Here you can select the KPI name from the dropdown available on range C3. The sheet displays the KPI Group, Unit of KPI, Type of KPI (Lower the Better or Upper the Better), Formula of the KPI, and Definition of the KPI. MTD and YTD trend charts show Actual, Target, and Previous Year numbers side by side for detailed performance analysis.
3. Input Data Sheet
 Input Data Sheet
The Input Data sheet is where you enter all KPI data. Record actual values, targets, and other metrics for each KPI. The sheet offers flexibility to easily update data as new results become available, ensuring the scorecard remains current with the latest conservation performance numbers.
4. KPI Definition Sheet
 KPI Definition Sheet
In this sheet, you enter the KPI Name, KPI Group, Unit, Formula, and KPI Definition. This serves as a reference guide so all stakeholders — from field officers to donors — understand exactly what each conservation metric tracks and how it is calculated.
Wildlife Conservation KPI Scorecard vs. Google Sheets Scorecard vs. Paid Conservation Software — Feature Comparison
| Feature | Wildlife Conservation KPI Scorecard in Excel | Google Sheets Scorecard | SMART Conservation Software |
|---|---|---|---|
| Cost | $12.99 one-time | Free (limited features) | $50-200/user/month |
| Platform | Microsoft Excel (desktop + web) | Google Sheets (web only) | Cloud-based SaaS |
| Setup Time | Under 10 minutes | 30-60 minutes (build from scratch) | 2-4 weeks onboarding |
| Real-time Collaboration | Via SharePoint/OneDrive | ✅ Native | ✅ Native |
| Offline Access | ✅ Full offline | ❌ Requires internet | ❌ Requires internet |
| Customizable KPIs | ✅ Unlimited | ✅ Manual setup | Limited to plan tier |
| MTD/YTD Trend Charts | ✅ Built-in | Manual chart creation | ✅ Built-in |
| Year-1 Cost (5 users) | $12.99 total | $0 | $3,000-12,000 |
For conservation teams that want structured KPI tracking without paying thousands for enterprise software, the Wildlife Conservation KPI Scorecard in Excel sits in the sweet spot.
Who Should Use This Template
Perfect for:
- Wildlife conservation NGOs and field project managers tracking species recovery and habitat restoration
- Government wildlife departments monitoring anti-poaching operations and funding allocation
- Environmental consultants reporting conservation KPIs to donors and grant providers
- Zoo and sanctuary managers measuring animal welfare and breeding program outcomes
- University researchers tracking biodiversity indices and ecological monitoring KPIs
📖 Click here to read the Detailed Blog Post
🎥 Visit our YouTube channel for step-by-step video tutorials
👉 YouTube.com/@NextGenTemplates


Reviews
There are no reviews yet.