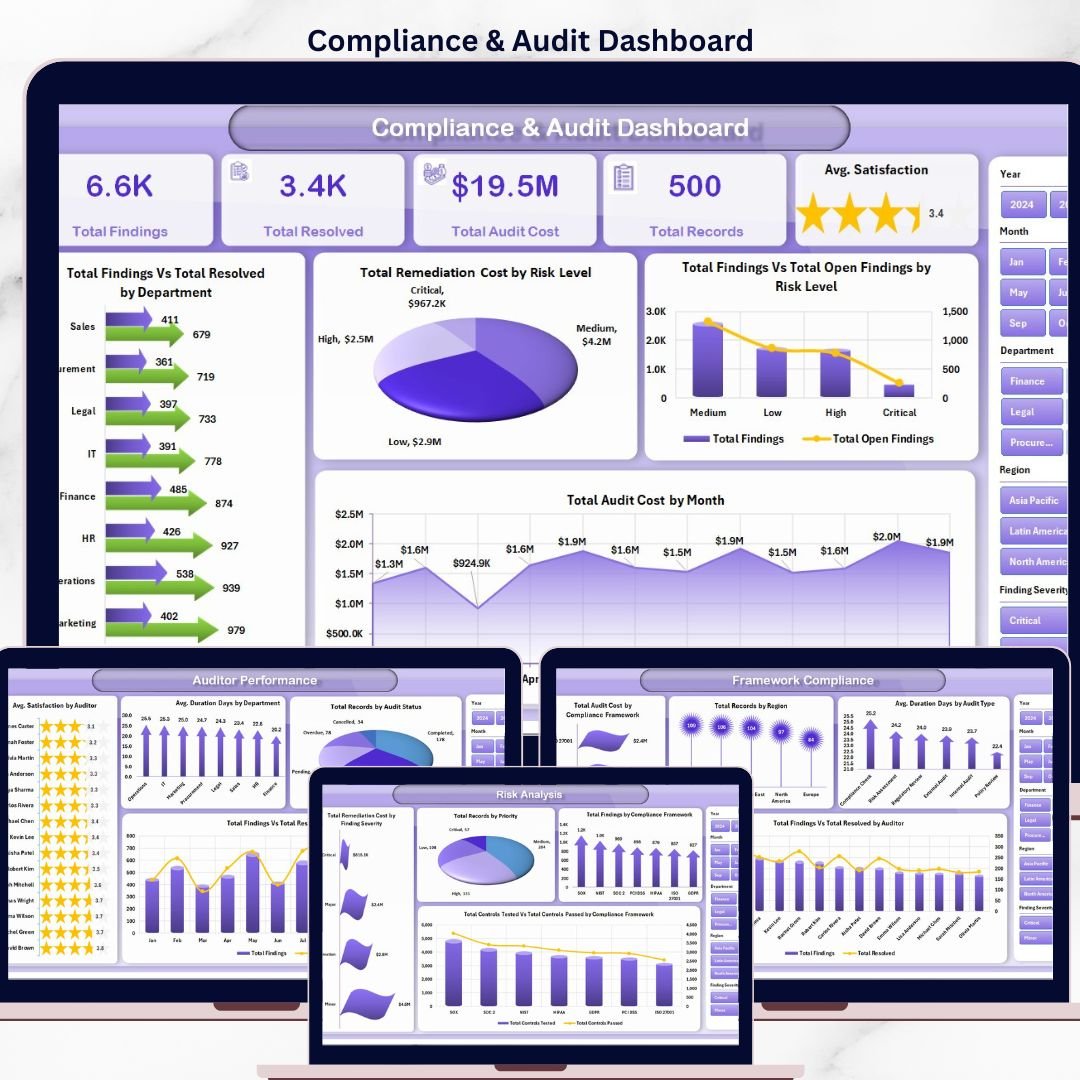
The Compliance and Audit Dashboard in Excel tracks 5 high-level KPIs across 5 interactive pages, with 15+ pre-built charts and multiple slicers wired to a single data sheet. Setup takes under 10 minutes — paste your audit records into the Data tab, click Refresh All, and every chart, card, and pivot updates automatically. ⚡
🌍 Join 8,400+ teams in 40+ countries using NextGenTemplates Excel Dashboards to replace paid GRC SaaS tools with one-time-purchase Excel, Google Sheets, Power BI, and HTML templates.
✅ Instant download · One-time payment · No subscription · No per-user fees · Lifetime access
🔑 Key Features of the Compliance and Audit Dashboard in Excel
This dashboard tracks 5 KPI cards, 15+ interactive charts, and 5 dedicated pages covering overview, risk analysis, framework compliance, auditor performance, and trend analysis. Every visual is powered by pivot tables linked to a single data sheet — update your audit records once and the entire dashboard refreshes in one click. 📊
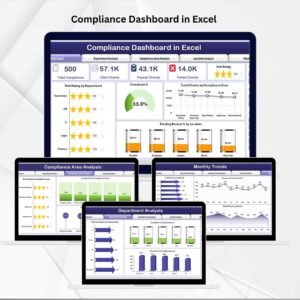
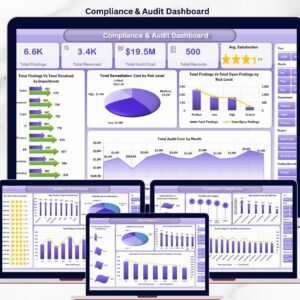
🔹 5 KPI cards at the top of the Overview — Total Findings, Total Resolved, Total Audit Cost, Total Records, and Avg. Satisfaction.
🔹 5 interactive pages — Overview, Risk Analysis, Framework Compliance, Auditor Performance, and Trend Analysis.
🔹 15+ charts covering findings vs. resolved, remediation cost by risk level, audit cost by month, and controls tested vs. passed.
🔹 Global slicers — filter every page by department, risk level, compliance framework, region, or audit type in one click.
🔹 Dedicated Data sheet — paste your own records in the same column structure and everything downstream updates automatically.
🔹 Support sheet with all pivot tables — click Data → Refresh All in the Excel ribbon and every chart rebuilds instantly.
🔹 Auditor performance view — see avg. satisfaction by auditor and findings vs. resolved per auditor at a glance.
🔹 Trend Analysis page with year-over-year audit cost vs. remediation cost and controls tested vs. passed.
🔹 Works offline in Microsoft Excel 2016, 2019, 2021, and Microsoft 365 on Windows and macOS.
📦 What’s Inside the Compliance and Audit Dashboard
The workbook ships with 7 sheets covering the full compliance and internal audit lifecycle. Below is a breakdown of each page and what it shows.
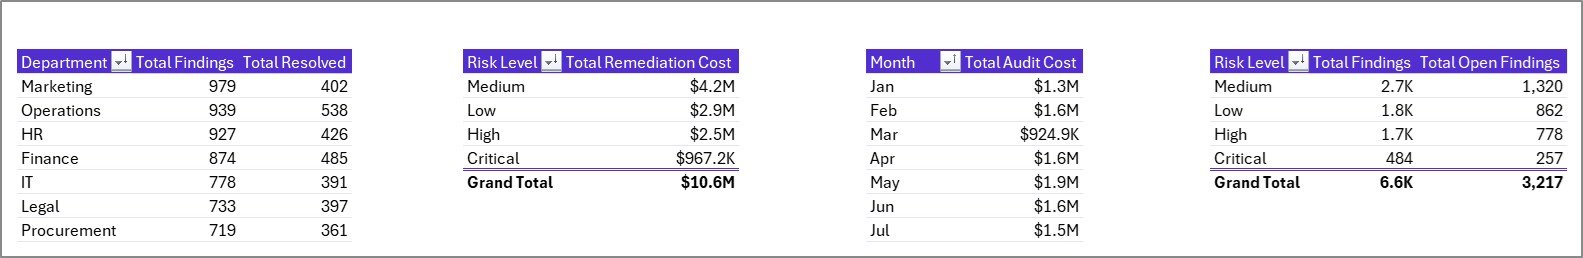
1. Overview Page
The Overview sheet opens with 5 KPI cards — Total Findings, Total Resolved, Total Audit Cost, Total Records, and Avg. Satisfaction — giving leadership an instant snapshot of program health. Below the cards, four charts break the data down further: Total Findings vs. Total Resolved by Department highlights which teams are closing issues fastest; Total Remediation Cost by Risk Level shows where money is being spent on fixes; Total Findings vs. Total Open Findings by Risk Level pinpoints unresolved high-risk exposure; and Total Audit Cost by Month reveals spend patterns across the year. Multiple slicers let you filter the entire page in one click.
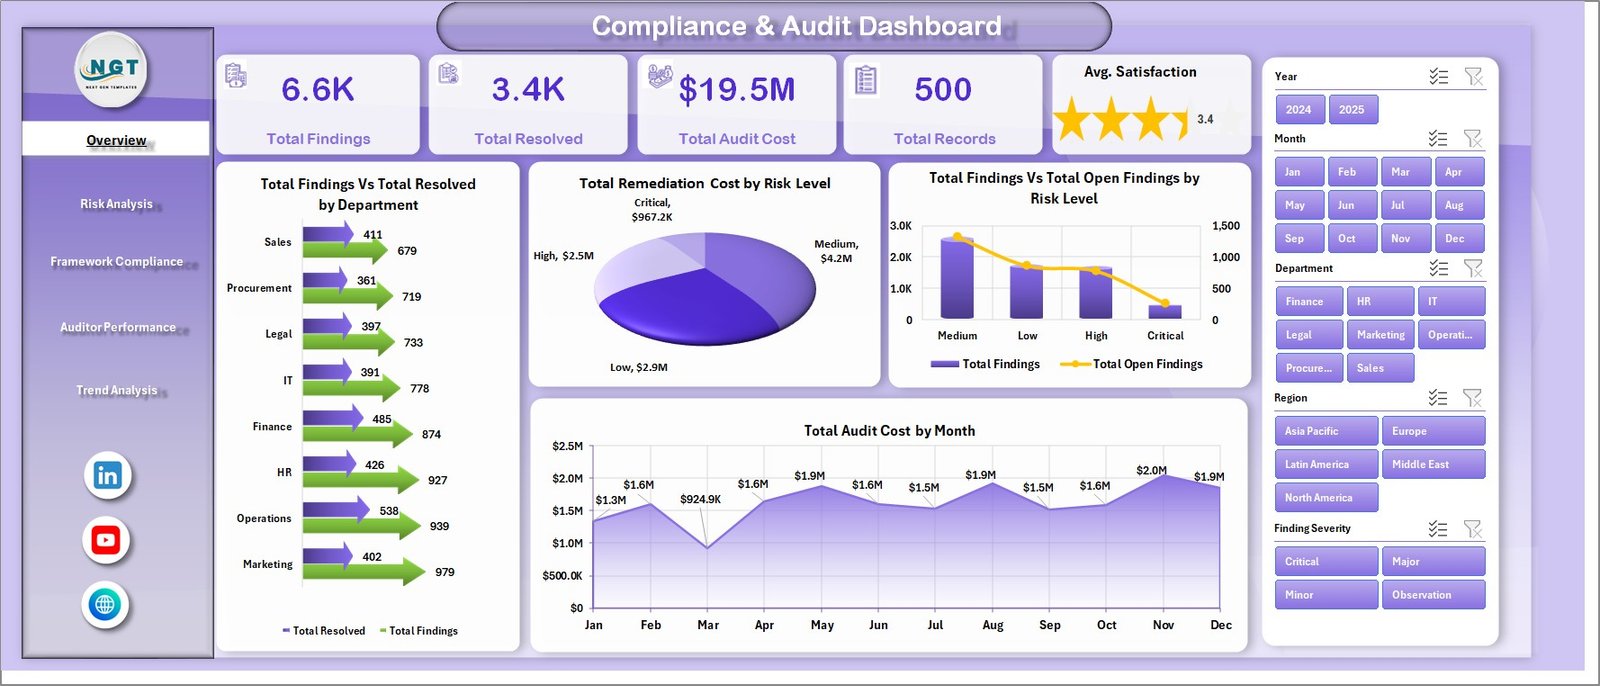
Compliance and Audit Dashboard in Excel
2. Risk Analysis
The Risk Analysis sheet focuses on severity, priority, and framework-level exposure. Total Remediation Cost by Finding Severity shows where the most expensive fixes sit; Total Records by Priority breaks the workload into High, Medium, and Low; Total Findings by Compliance Framework reveals which frameworks (SOX, ISO 27001, GDPR, HIPAA, PCI-DSS) generate the most issues; and Total Controls Tested vs. Total Controls Passed by Compliance Framework turns pass rates into a clear scorecard.
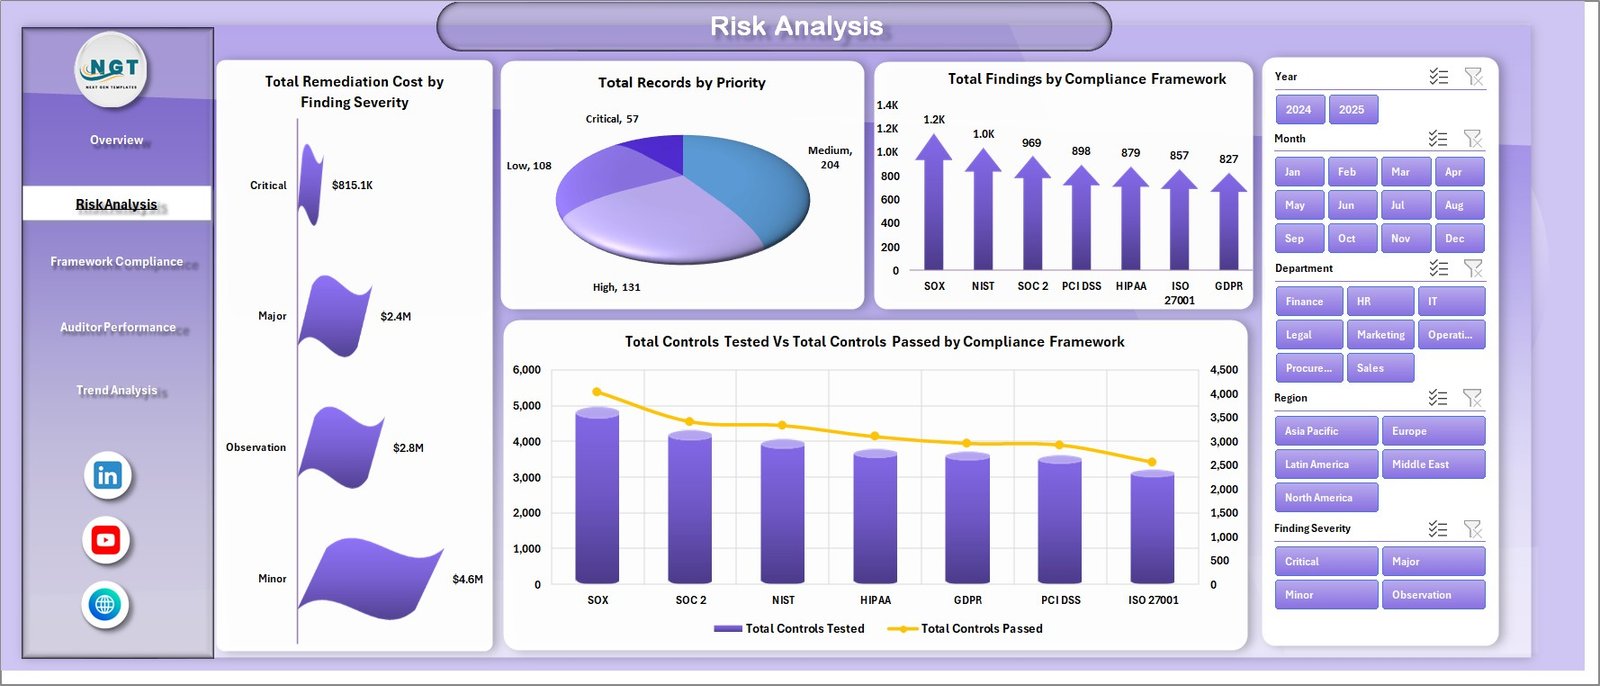
Risk Analysis
3. Framework Compliance
The Framework Compliance sheet zooms into cost, region, and audit-type drivers. Total Audit Cost by Compliance Framework shows which standards consume the biggest budget; Total Records by Region breaks coverage across geographies; Avg. Duration Days by Audit Type helps you benchmark how long internal, external, and third-party audits really take; and Total Findings vs. Total Resolved by Auditor turns workload into a per-auditor scorecard.
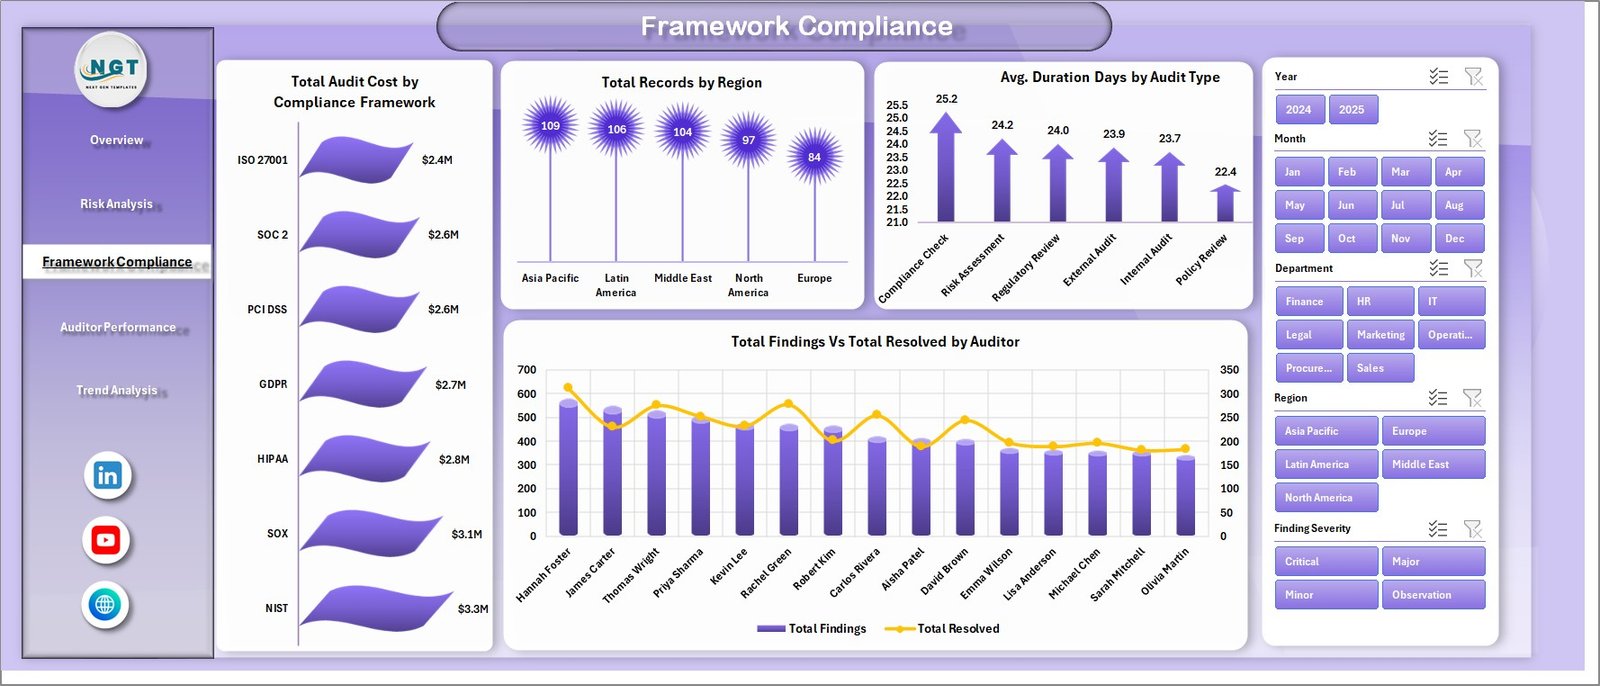
Framework Compliance
4. Auditor Performance
The Auditor Performance sheet makes quality and throughput visible. Avg. Satisfaction by Auditor surfaces stakeholder feedback, Avg. Duration Days by Department highlights bottlenecks, Total Records by Audit Status (Planned, In Progress, Completed, Closed) tracks the pipeline, and Total Findings vs. Total Resolved by Month shows resolution velocity over time.
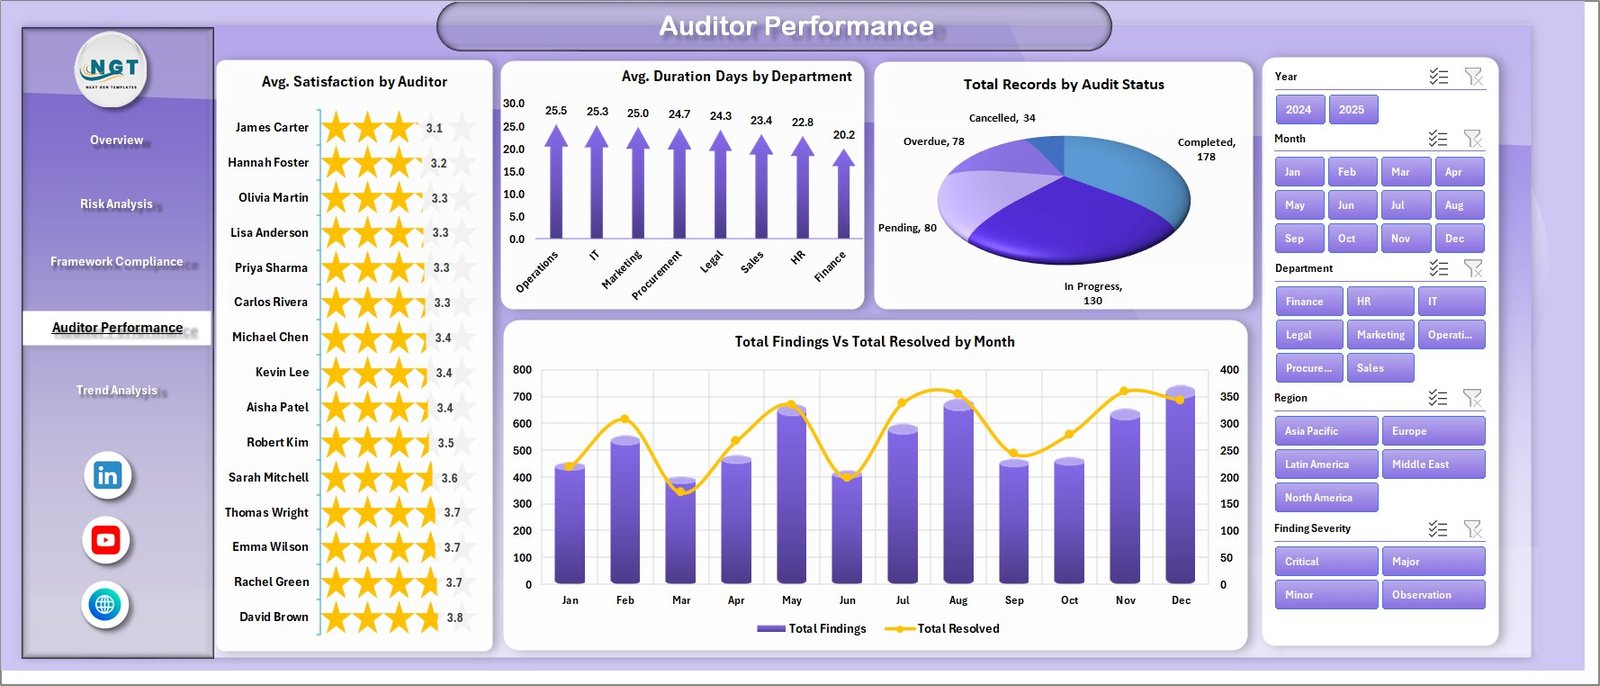
Auditor Performance
5. Trend Analysis
The Trend Analysis sheet answers the longer-term questions. Total Audit Cost vs. Total Remediation Cost by Year shows whether the program is getting cheaper or more expensive over time; Total Records by Month reveals seasonal audit waves; and Total Controls Tested vs. Total Controls Passed by Year shows whether your overall control effectiveness is improving year-over-year.
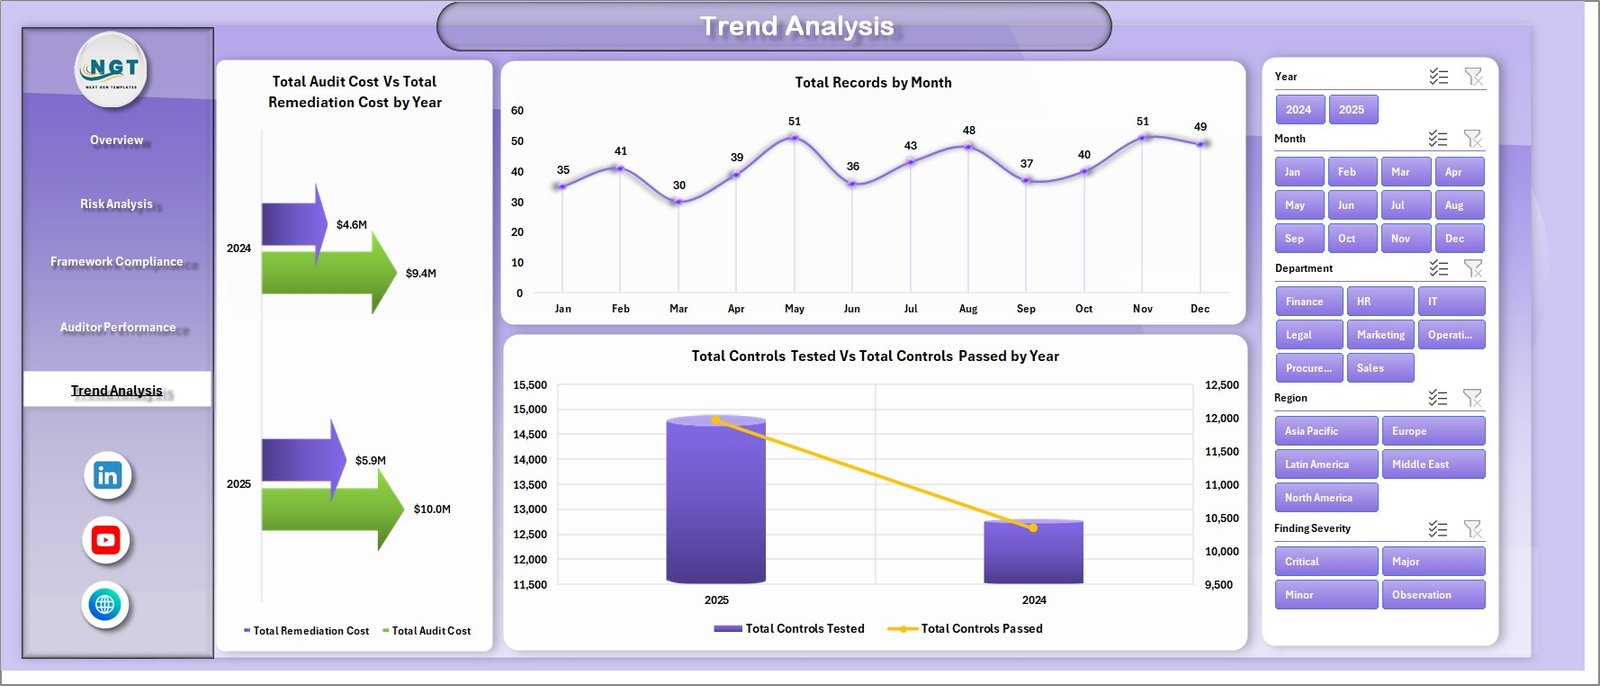
Trend Analysis
6. Data Sheet
The Data sheet is where you enter your own audit records in the same column format used by the sample data. Keep the headers unchanged — columns like Audit ID, Date, Department, Compliance Framework, Risk Level, Findings, Resolved, Audit Cost, Remediation Cost, Auditor, Region, Audit Status, Audit Type, Duration Days, Controls Tested, Controls Passed, and Satisfaction drive every chart on every page.
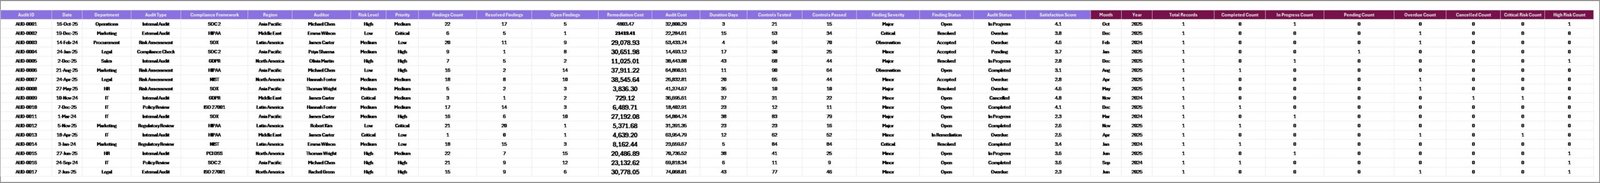
Data Sheet tab
7. Support Sheet
The Support sheet houses every pivot table that feeds the dashboard. After you update the Data tab, go to Data → Refresh All in the Excel ribbon and every pivot rebuilds — which means every chart and KPI on every page refreshes automatically. You can hide this sheet for a cleaner end-user experience.
Support sheet tab
📊 Compliance & Audit Dashboard vs. Power BI Equivalent vs. Paid GRC SaaS — Where This Fits
| Feature | Compliance & Audit Dashboard (Excel) | Power BI GRC Dashboard | AuditBoard / LogicGate / MetricStream |
|---|---|---|---|
| Cost | $17.99 one-time | $10/user/month + build cost | $30K–$150K per year |
| Platform | Microsoft Excel (offline) | Power BI Desktop + Service | Cloud SaaS |
| Setup time | Under 10 minutes | 2–4 weeks (data model + DAX) | 6–12 weeks implementation |
| Customizable fields | ✅ Full column-level control | ✅ With DAX skill | ❌ Vendor-controlled schema |
| 5 ready-made pages + 15+ charts | ✅ | Build from scratch | ✅ (locked layout) |
| Share with link | Email / OneDrive / Teams | Power BI Pro license per viewer | ✅ Web portal |
| Year-1 cost at 5 users | $17.99 one-time | ~$600/year | $30,000+/year |
| Works offline | ✅ | ❌ | ❌ |
| Real-time collaboration | Via OneDrive / SharePoint | ✅ Power BI Service | ✅ Native |
For internal audit and compliance teams that want a working GRC dashboard without six-figure SaaS contracts, the Compliance & Audit Dashboard in Excel sits in the sweet spot.
👥 Who This Template Is For — and Who It’s Not For
✅ This template is built for:
- Internal audit managers at 50–1,000-employee companies who need to show findings, resolution rates, and costs to leadership monthly.
- Compliance officers tracking multiple frameworks (SOX, ISO 27001, GDPR, HIPAA, PCI-DSS) in one place.
- External audit firms wanting a white-label client-ready reporting pack.
- Risk and GRC consultants who bill by engagement and need a reusable deliverable template.
- CFOs and Audit Committee chairs reviewing remediation cost trends quarter-over-quarter.
❌ This template is NOT for:
- Enterprise teams that need SOC 2 Type II evidence collection, control-owner workflow routing, and SSO — that’s AuditBoard / LogicGate territory.
- Teams that need a live, always-on web portal with real-time control owner sign-off.
- Fully regulated Big 4 audit firms with mandated working-paper software.
⚙️ How to Use the Compliance & Audit Dashboard
- Download the ZIP file and extract it to a folder.
- Open the workbook in Microsoft Excel 2016 or later (Windows or macOS).
- Go to the Data sheet and replace the sample records with your own — keep the column headers unchanged.
- Click Data → Refresh All in the Excel ribbon. Every pivot in the Support sheet rebuilds, and every chart updates.
- Open the Overview page and use the slicers to filter by department, risk level, or framework.
- Navigate through Risk Analysis, Framework Compliance, Auditor Performance, and Trend Analysis for deeper views.
- Hide the Support sheet before sharing the file with leadership for a cleaner experience.
💼 Real-World Use Cases
Priya runs internal audit at a 400-person fintech. She uses the Compliance & Audit Dashboard every month to prepare her Audit Committee pack — the Findings vs. Resolved by Department chart anchors the meeting, and the Total Audit Cost by Month chart answers the CFO’s favorite question before he asks it.
Marcus leads compliance at a 120-person SaaS company. He tracks SOX, ISO 27001, and GDPR across the same workbook. The Total Controls Tested vs. Passed by Compliance Framework chart gives him a single-page view for his quarterly board update without paying $45,000 for LogicGate.
Renee runs a boutique audit firm with 8 partners. She white-labels the dashboard for client deliverables — the Auditor Performance page shows each client which senior auditor ran their engagement and the satisfaction score, which has doubled her retainer renewals.
👤 About the Author
Built by PK — Microsoft Certified Professional with 15+ years of Excel, Google Sheets, and Power BI experience. Founder of NextGenTemplates, reaching 300K+ subscribers across YouTube channels (@PK-AnExcelExpert, @NextGenTemplates, @NeoTechNavigators). Every template is hand-built and tested before release.
❓ Frequently Asked Questions
What KPIs does the Compliance & Audit Dashboard track?
The Compliance & Audit Dashboard tracks 5 headline KPIs — Total Findings, Total Resolved, Total Audit Cost, Total Records, and Avg. Satisfaction — plus 15+ chart-level metrics covering remediation cost by risk level, controls tested vs. passed, and audit cost by month and year.
Which Excel versions does this dashboard work with?
The Compliance & Audit Dashboard works on Microsoft Excel 2016, 2019, 2021, and Microsoft 365 on both Windows and macOS. It uses standard pivot tables and charts — no macros, no Power Pivot add-in, and no Power Query required.
How does this compare to AuditBoard or LogicGate?
AuditBoard and LogicGate are full GRC SaaS platforms starting around $30,000 per year. The Compliance & Audit Dashboard in Excel is a one-time $17.99 reporting layer that solves the visualization problem without the six-figure contract, ideal for audit teams under 1,000 employees.
How long does setup take?
Setup takes under 10 minutes. Download the ZIP, open the workbook, paste your audit records into the Data sheet using the existing column structure, then click Data → Refresh All. Every pivot, chart, and KPI updates automatically across all 5 dashboard pages.
Can I add new compliance frameworks or risk levels?
Yes. The Compliance & Audit Dashboard is fully customizable — add any framework (SOX, ISO 27001, GDPR, HIPAA, PCI-DSS, NIST, or your own) as a value in the Data sheet, click Refresh All, and the framework chart and slicer will include it automatically.
Is this dashboard free or paid?
The Compliance & Audit Dashboard in Excel is a paid template priced at $17.99 (sale) / $24.99 (regular). One-time payment, instant download, lifetime access, no subscription, and no per-user fees.
Does it include a free YouTube tutorial?
Yes. Visit YouTube.com/@NextGenTemplates and @PK-AnExcelExpert for step-by-step walkthroughs on how to replace the sample data, add new KPIs, and hide the Support sheet before sharing with leadership.
🔗 Explore Related Templates
🔸 Safety & Compliance Commander — 8 Premium Templates Bundle — save 40%+ on the full compliance and safety suite (Excel + Power BI).
🔸 AI Governance Dashboard in Excel — purpose-built for AI model risk and compliance teams.
🔸 Anti-Corruption Units Dashboard in Excel — track investigations, outcomes, and recovery amounts.
🔸 Financial Compliance Checklist in Excel — companion checklist for finance teams.
🔸 Also available as: Compliance Dashboard in Google Sheets and HR Compliance KPI Dashboard in Google Sheets.
💎 Save big with the Safety & Compliance Commander bundle — 8 premium compliance and safety templates in Excel + Power BI at one discounted price.
📖 Click here to read the Detailed Blog Post
🎥 Visit our YouTube channel for step-by-step video tutorials
👉 YouTube.com/@NextGenTemplates
Watch the step-by-step video tutorial:


Reviews
There are no reviews yet.