
Running a thriving coaching practice means juggling sessions, packages, clients, goal tracking and revenue — all at once. The Coaching Business Dashboard in Power BI pulls every one of those moving parts into a single, visual command center so you can see exactly how your coaching business is performing and where the next growth opportunity is hiding. Whether you’re a life coach, executive coach, business coach or fitness coach, this Power BI dashboard template gives you data-driven clarity in minutes instead of hours.
Built with a clean, modern Power BI layout and fully editable .pbix source, this dashboard tracks 5 KPIs, 14+ interactive charts and 5 dedicated analysis pages — from session revenue by coach to goal progress by program. It’s the Power BI companion to our popular Coaching Business Dashboard in Excel — same insights, Power BI power.
🔑 Key Features of the Coaching Business Dashboard in Power BI
This dashboard includes 5 interactive pages, 5 high-level KPI cards and 14+ visual charts covering every critical angle of a coaching practice. Each page is connected through slicers so you can filter the entire report by coach, coaching type, program, session format or referral source in one click. 📊
🔹 Full Power BI .pbix file — open, edit, re-theme and publish to Power BI Service.
🔹 5 analysis pages covering overview, coach performance, client analysis, program insights and revenue trends.
🔹 Dynamic slicers for coach name, coaching type, program, session format and referral source.
🔹 Package vs session revenue comparison to show which income stream is growing faster.
🔹 Coach-level scorecards with revenue, client satisfaction and cancelled session counts.
🔹 Goal progress metrics to measure client outcomes — a must-have KPI for any serious coach.
📦 What’s Inside the Coaching Business Dashboard in Power BI
The template contains 5 fully designed Power BI report pages. Here’s what each one delivers:
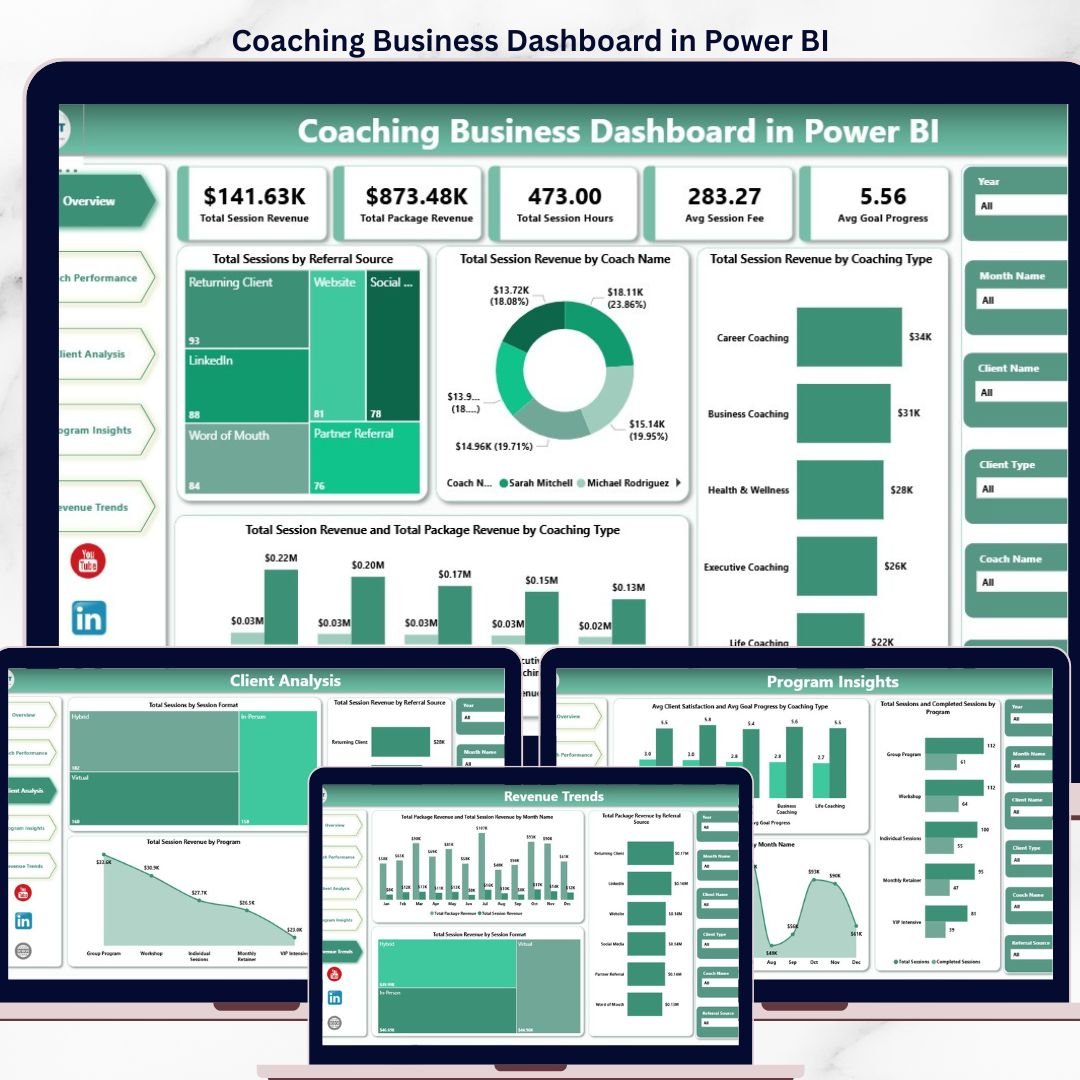
📊 Page 1 — Overview
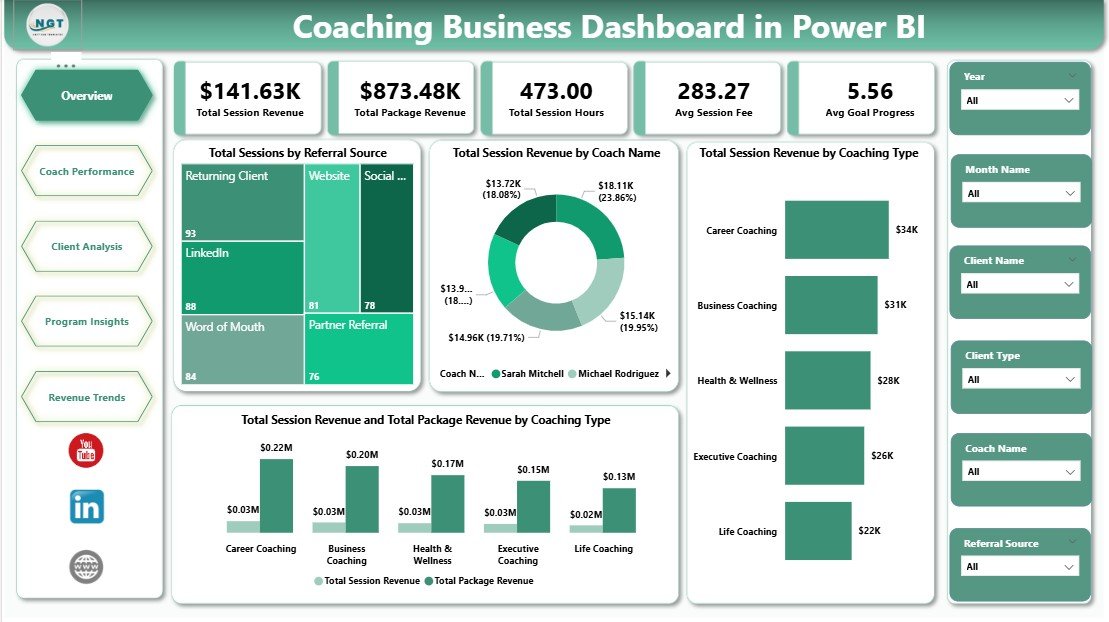
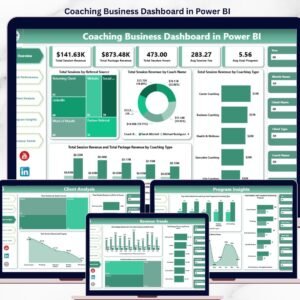
Your high-level daily-view page. It opens with 5 KPI cards: Total Session Revenue, Total Package Revenue, Total Session Hours, Avg Session Fee and Avg Goal Progress. Below the cards, four interactive charts break down the business: Total Sessions by Referral Source (shows which channels bring paying clients), Total Session Revenue by Coach Name (identifies top-performing coaches), Total Session Revenue by Coaching Type (reveals which niche pays best) and Total Session Revenue and Total Package Revenue by Coaching Type (compares one-off vs. recurring income per niche). Multiple slicers let you filter the whole page instantly.
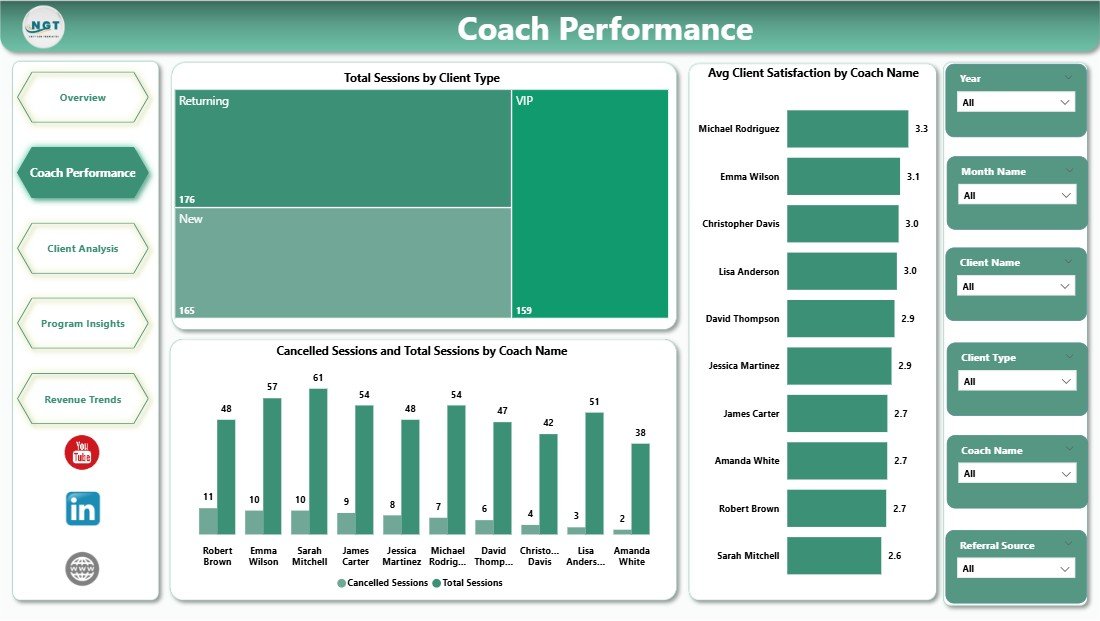
👥 Page 2 — Coach Performance
A full scorecard view for every coach on the roster. Charts include Total Sessions by Client Type (are your coaches serving the right clients?), Avg Client Satisfaction by Coach Name (quality benchmark) and Cancelled Sessions and Total Sessions by Coach Name (highlights retention and reliability issues early).
🧑🎓 Page 3 — Client Analysis
Understand who your clients are and how they pay. This page visualises Total Sessions by Session Format (in-person vs. virtual vs. group), Total Session Revenue by Referral Source (which marketing channel drives the most revenue) and Total Session Revenue by Program (which packages clients are actually buying).
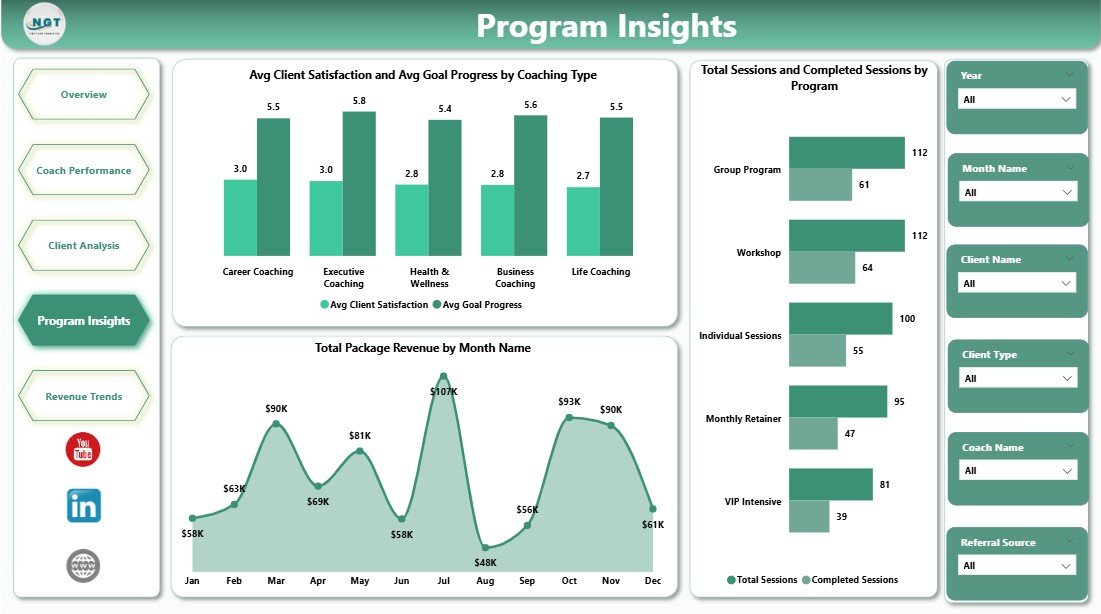
🎯 Page 4 — Program Insights
A deep dive into program and coaching-type ROI. Charts include Avg Client Satisfaction and Avg Goal Progress by Coaching Type, Total Package Revenue by Month Name (seasonality of package sales) and Total Sessions and Completed Sessions by Program (completion rate benchmark).
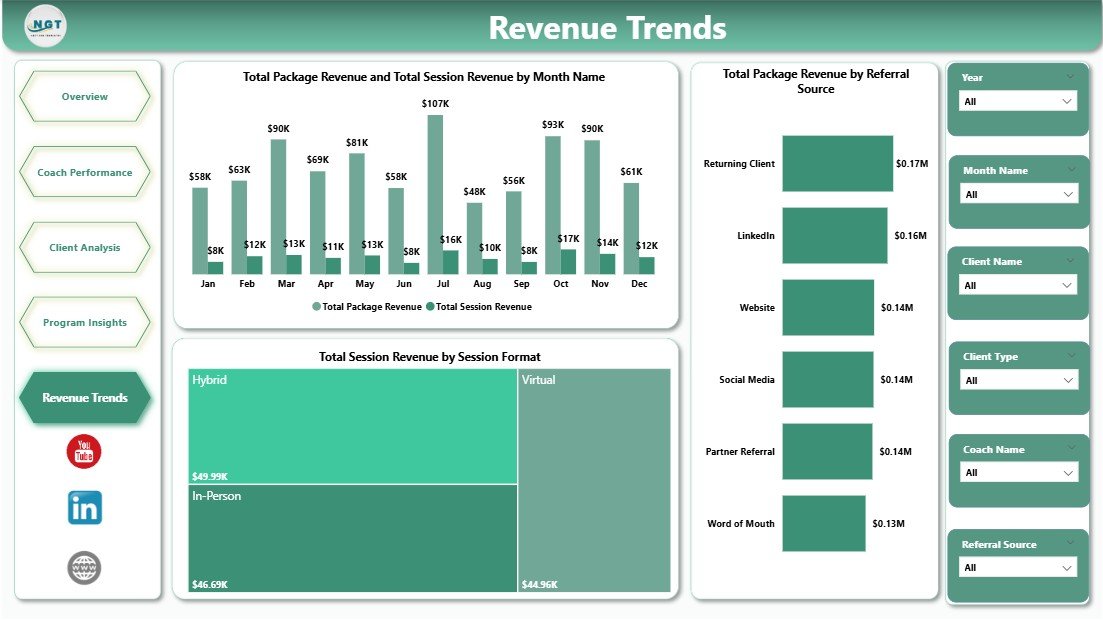
💰 Page 5 — Revenue Trends
Track how your business is trending over time. Charts cover Total Package Revenue and Total Session Revenue by Month Name, Total Package Revenue by Referral Source and Total Session Revenue by Session Format — ideal for monthly business reviews and forecasting next quarter’s targets.
⚙️ How to Use the Coaching Business Dashboard in Power BI
1️⃣ Download the .zip file after purchase and extract the .pbix file.
2️⃣ Open it in Power BI Desktop (free download from Microsoft).
3️⃣ Replace the sample data source with your own coaching data (Excel, CSV, SQL or Google Sheets all work).
4️⃣ Click Refresh — every chart, KPI card and slicer updates automatically.
5️⃣ Publish to Power BI Service to share a live dashboard with your team or VA.
👥 Who Can Benefit from This Coaching Business Dashboard
🎯 Life coaches & business coaches tracking session revenue and client progress.
🎯 Executive coaches managing corporate client accounts and package deals.
🎯 Coaching agencies & schools overseeing multiple coaches and programs.
🎯 Fitness, health & wellness coaches monitoring goal achievement rates.
🎯 Mindset and career coaches reporting client outcomes to stakeholders.
🎯 Consultants and solopreneurs who want a professional, data-backed business review each month.
Looking for more analytics templates? Explore our full range of Power BI Dashboards or browse other Dashboard Templates covering HR, sales, finance and operations.
❓ Frequently Asked Questions
What is the best Power BI dashboard template for coaches?
The Coaching Business Dashboard in Power BI is purpose-built for the coaching industry. It tracks 5 core KPIs (session revenue, package revenue, session hours, average session fee and average goal progress) across 5 interactive pages — making it one of the most complete Power BI dashboards available for life coaches, business coaches and executive coaches.
Do I need Power BI Pro to use this dashboard?
No. The Coaching Business Dashboard in Power BI works perfectly in the free Power BI Desktop application. You only need Power BI Pro (or Premium) if you want to publish the report to Power BI Service and share it with team members online.
Can I replace the sample data with my own coaching business data?
Yes. The .pbix file uses a simple data model that you can point to any source — Excel, CSV, Google Sheets or SQL databases. Just update the source, click Refresh, and every chart, card and slicer updates automatically.
What KPIs does this coaching dashboard track?
The dashboard tracks Total Session Revenue, Total Package Revenue, Total Session Hours, Average Session Fee and Average Goal Progress as headline KPIs. It also analyses revenue, sessions, satisfaction and cancellations by coach, coaching type, program, session format and referral source.
Is this dashboard suitable for a coaching agency with multiple coaches?
Absolutely. The Coach Performance page is designed specifically for multi-coach operations — it compares revenue, client satisfaction and cancelled sessions across every coach so agency owners can identify top performers and coaching gaps at a glance.
Can I customise the colors and branding of the dashboard?
Yes. Because it’s a native .pbix file, you can fully re-theme the dashboard with your own brand colors, logo and fonts using Power BI’s built-in theming options.
🔗 Explore Related Templates
🔹 Coaching Business Dashboard in Excel — the Excel version of this template, perfect if your team isn’t on Power BI yet.
🔹 Real Estate Agent Dashboard in Power BI — similar service-business structure for realtors.
🔹 Medical Practice Dashboard in Power BI — appointment and revenue analytics for clinics.
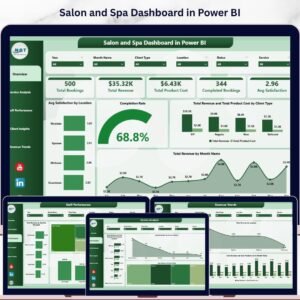
🔹 Salon and Spa Dashboard in Power BI — a great companion for service-based business owners.
📖 Click here to read the Detailed Blog Post
🎥 Visit our YouTube channel to learn step-by-step video tutorials
👉 YouTube.com/@NextGenTemplates


Reviews
There are no reviews yet.