Salon and Spa Dashboard in Excel is a professionally designed, ready-to-use analytics template built for salon owners, spa managers, and beauty business operators who want to track revenue, monitor staff performance, analyze client behavior, and visualize service trends — all in one powerful Excel workbook. This dashboard includes 5 interactive analysis pages, a structured data sheet, and a hidden support sheet with pivot tables that make the entire dashboard fully dynamic.
🔑 Key Features of Salon and Spa Dashboard in Excel
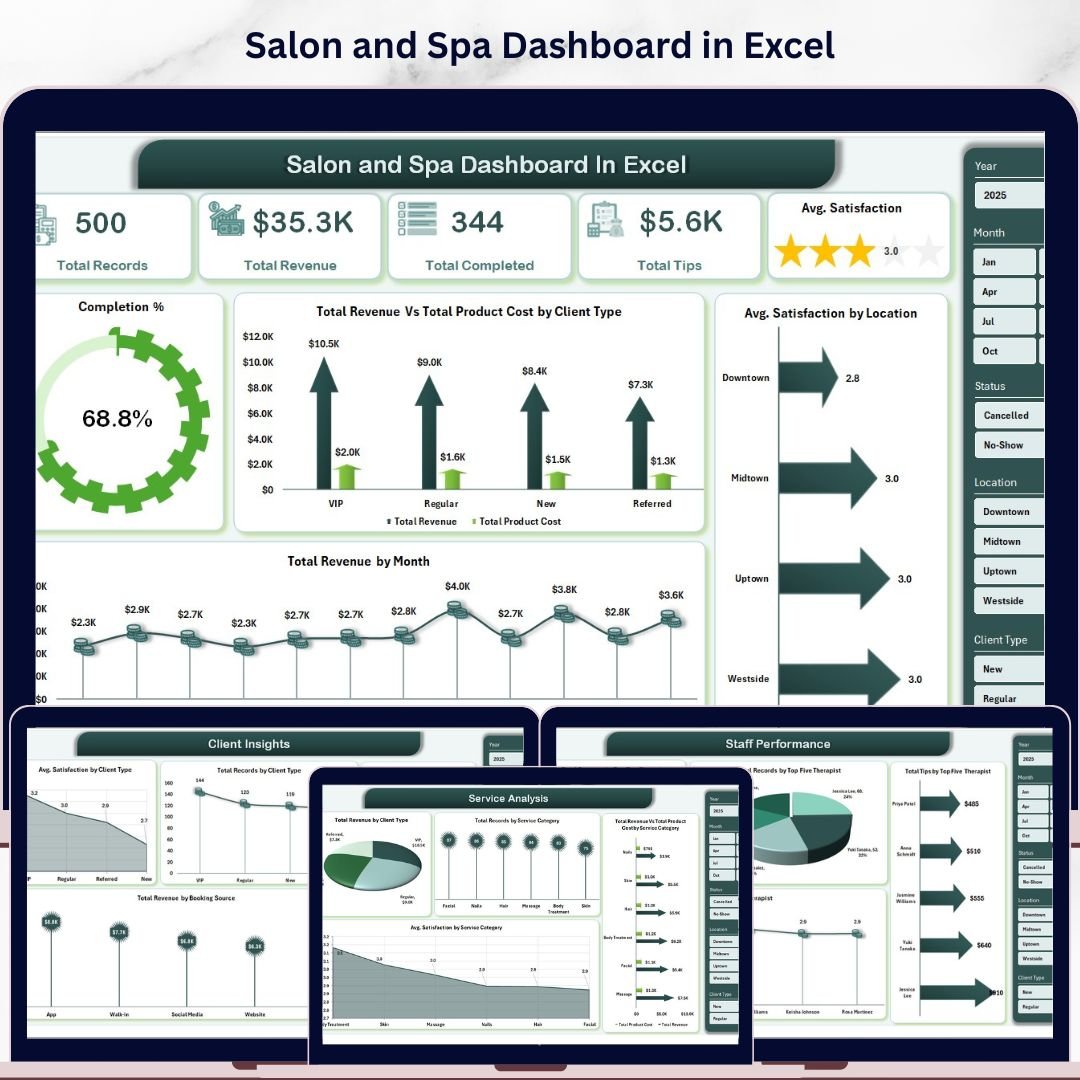
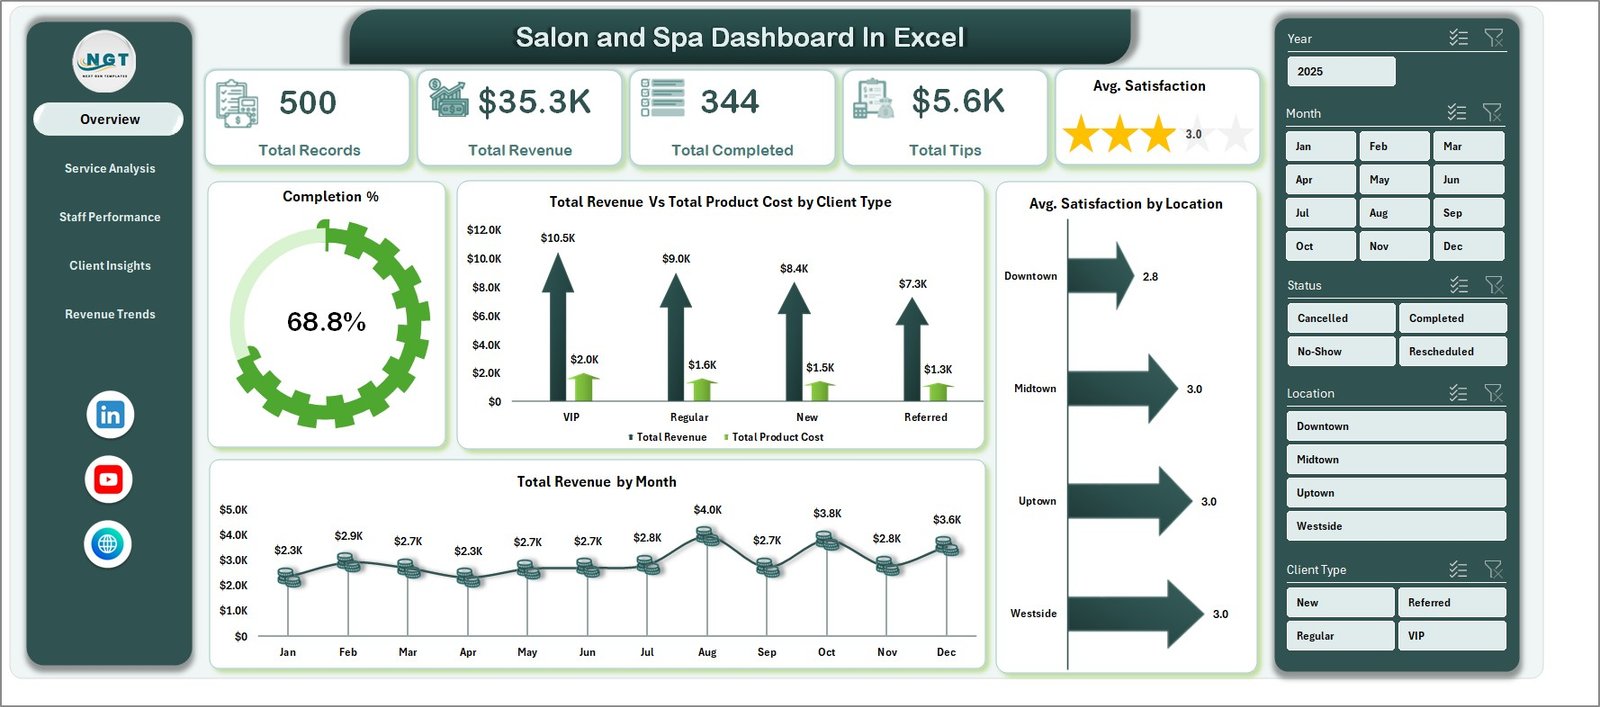
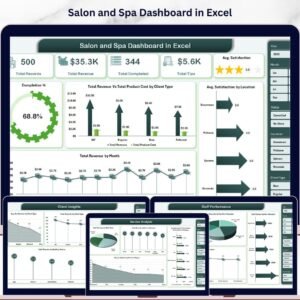
This Salon and Spa Dashboard in Excel delivers everything you need to run a data-driven beauty business. It includes 5 dedicated dashboard pages covering revenue analysis, service breakdowns, staff KPIs, client demographics, and revenue trend tracking. The template tracks 5 core KPIs on the overview page — Total Records, Total Revenue, Total Completed, Total Tips, and Avg. Satisfaction — giving you an instant snapshot of your salon’s health. Multiple interactive slicers let you filter the entire dashboard in seconds, and all charts refresh automatically when you update your data. Whether you manage a single spa location or a chain of beauty salons, this Excel Dashboard Template scales to fit your needs.
📦 What’s Inside the Salon and Spa Dashboard in Excel
📌 Overview Page — Displays high-level KPI cards for Total Records, Total Revenue, Total Completed, Total Tips, and Avg. Satisfaction. Includes charts for Completion % by Status, Total Revenue Vs Total Product Cost by Client Type, Total Revenue by Month, and Avg. Satisfaction by Location. Interactive slicers let you filter the dashboard quickly by any dimension.
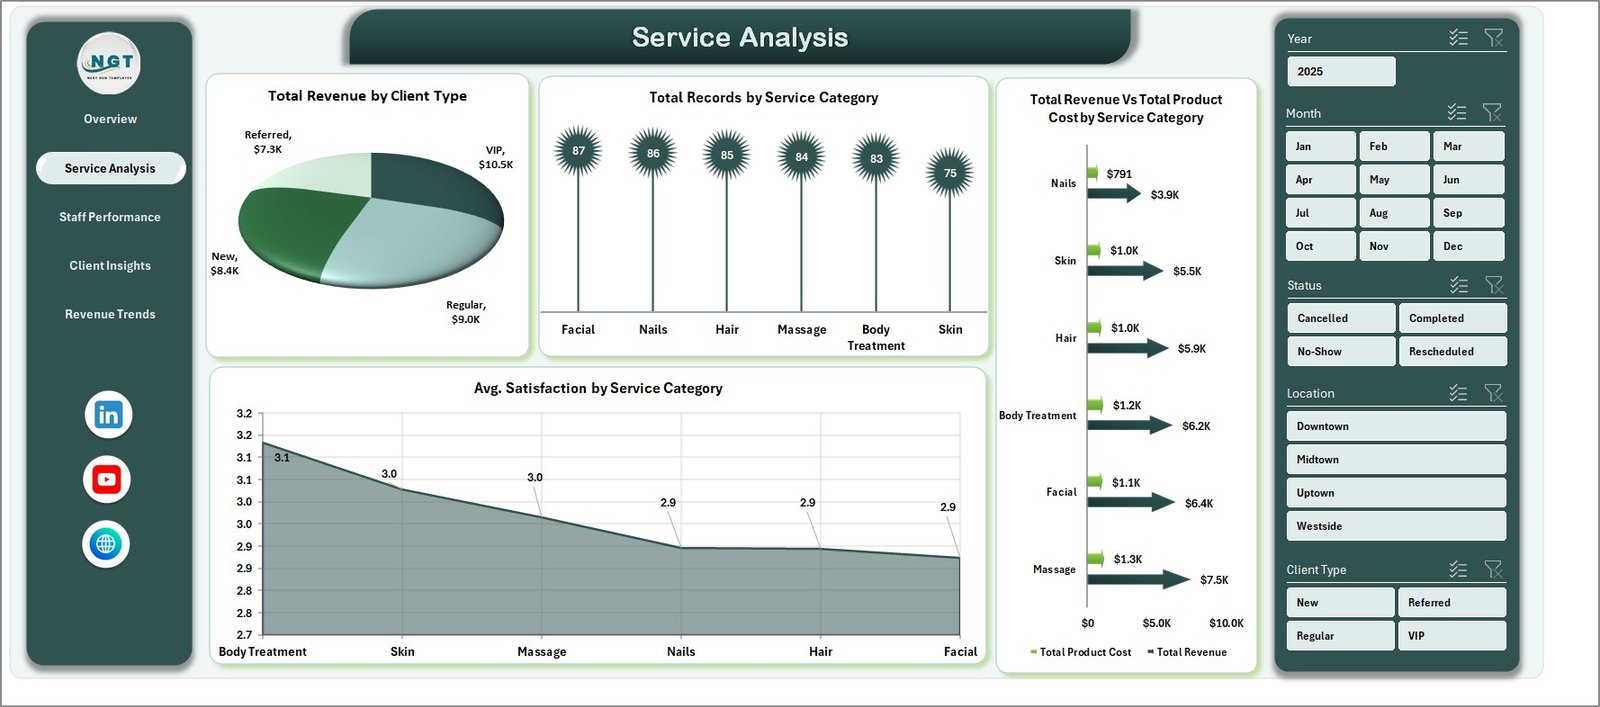
📌 Service Analysis Page — Breaks down your salon services with charts for Total Revenue by Client Type, Total Records by Service Category, Total Revenue Vs Total Product Cost by Service Category, and Avg. Satisfaction by Service Category. Understand which treatments generate the most revenue and which services have the highest client satisfaction.
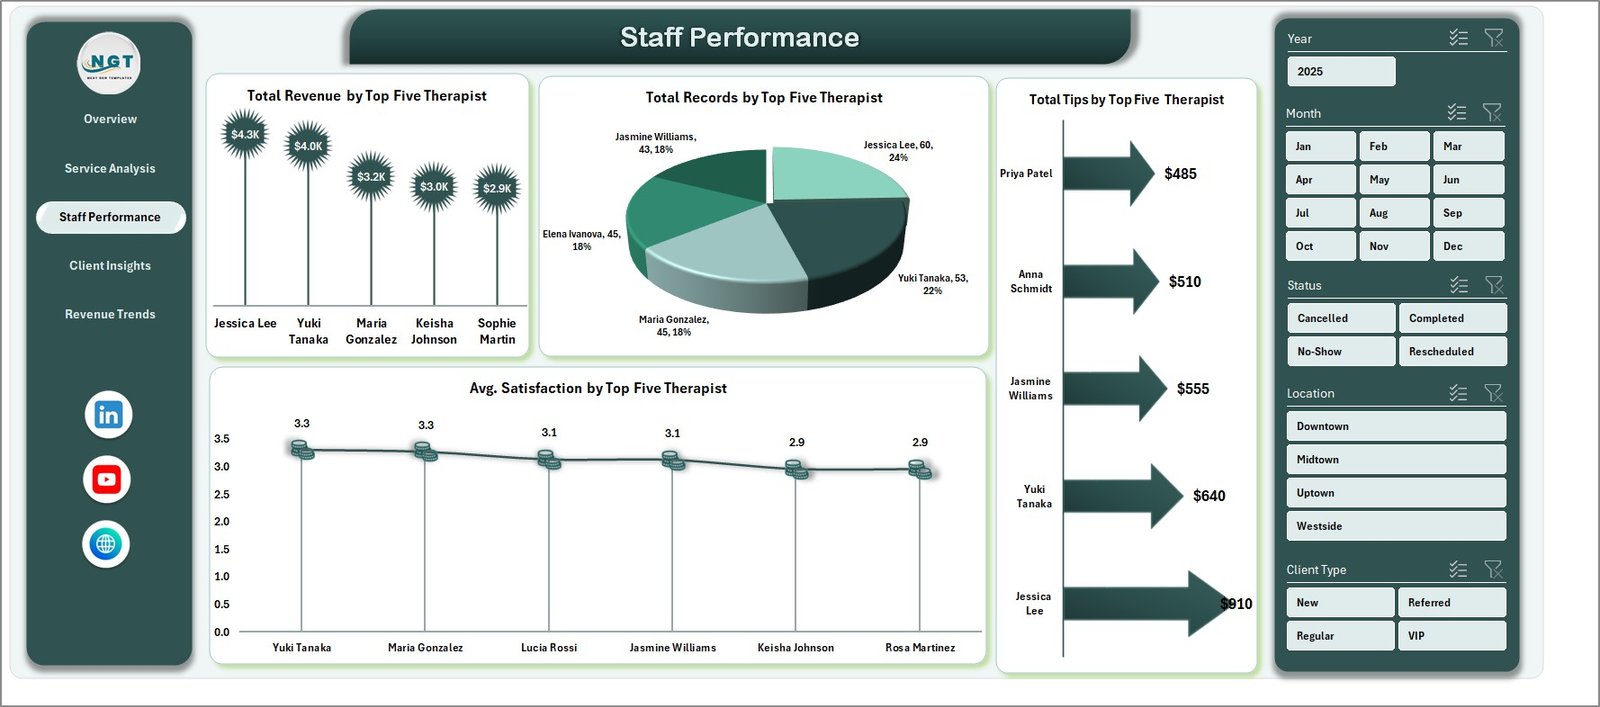
📌 Staff Performance Page — Evaluates your team with charts showing Total Revenue by Top Five Therapist, Total Records by Top Five Therapist, Total Tips by Top Five Therapist, and Avg. Satisfaction by Top Five Therapist. Identify your best performers and reward top talent based on real data.
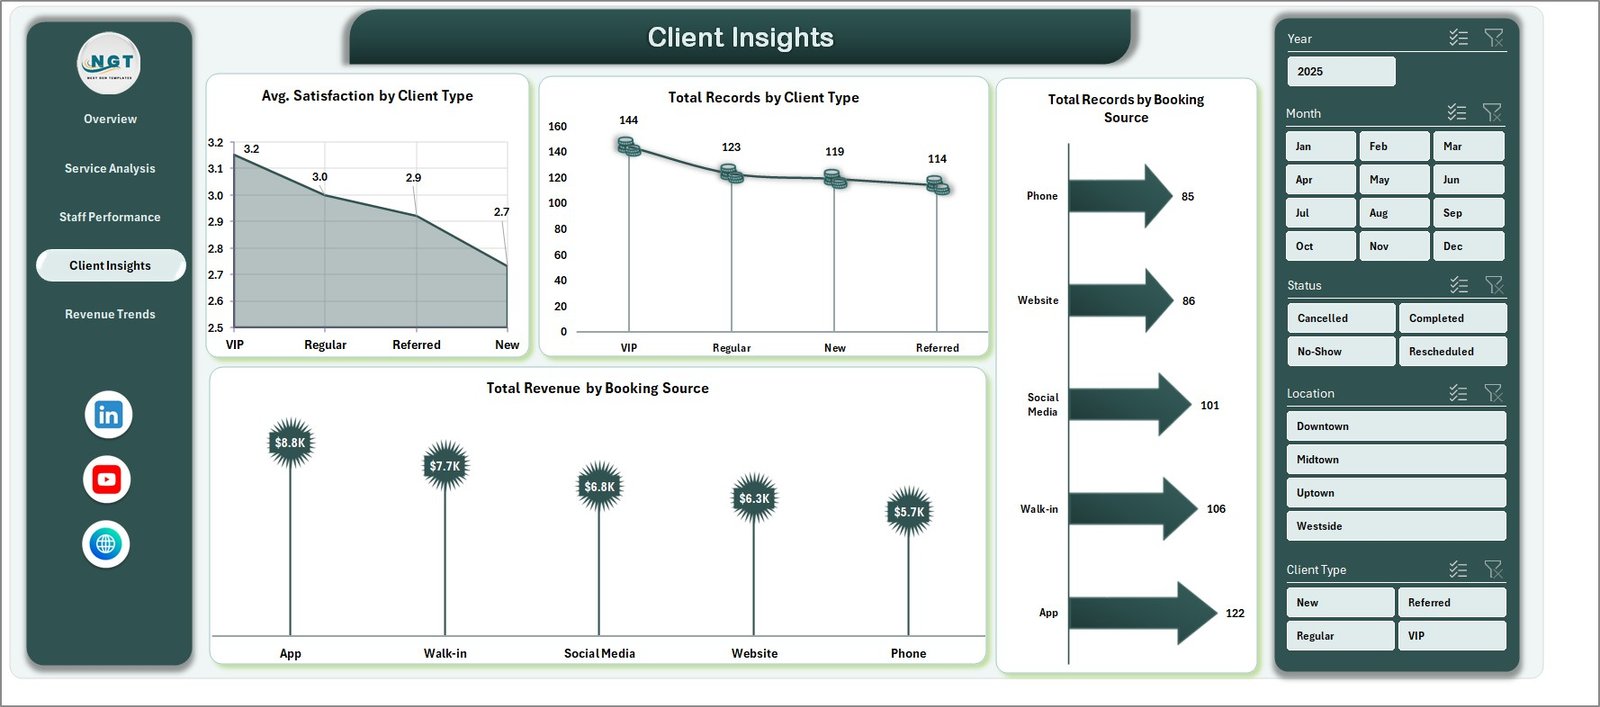
📌 Client Insights Page — Analyzes your customer base with Avg. Satisfaction by Client Type, Total Records by Client Type, Total Records by Booking Source, and Total Revenue by Booking Source. Discover which booking channels drive the most revenue and which client segments are most satisfied.
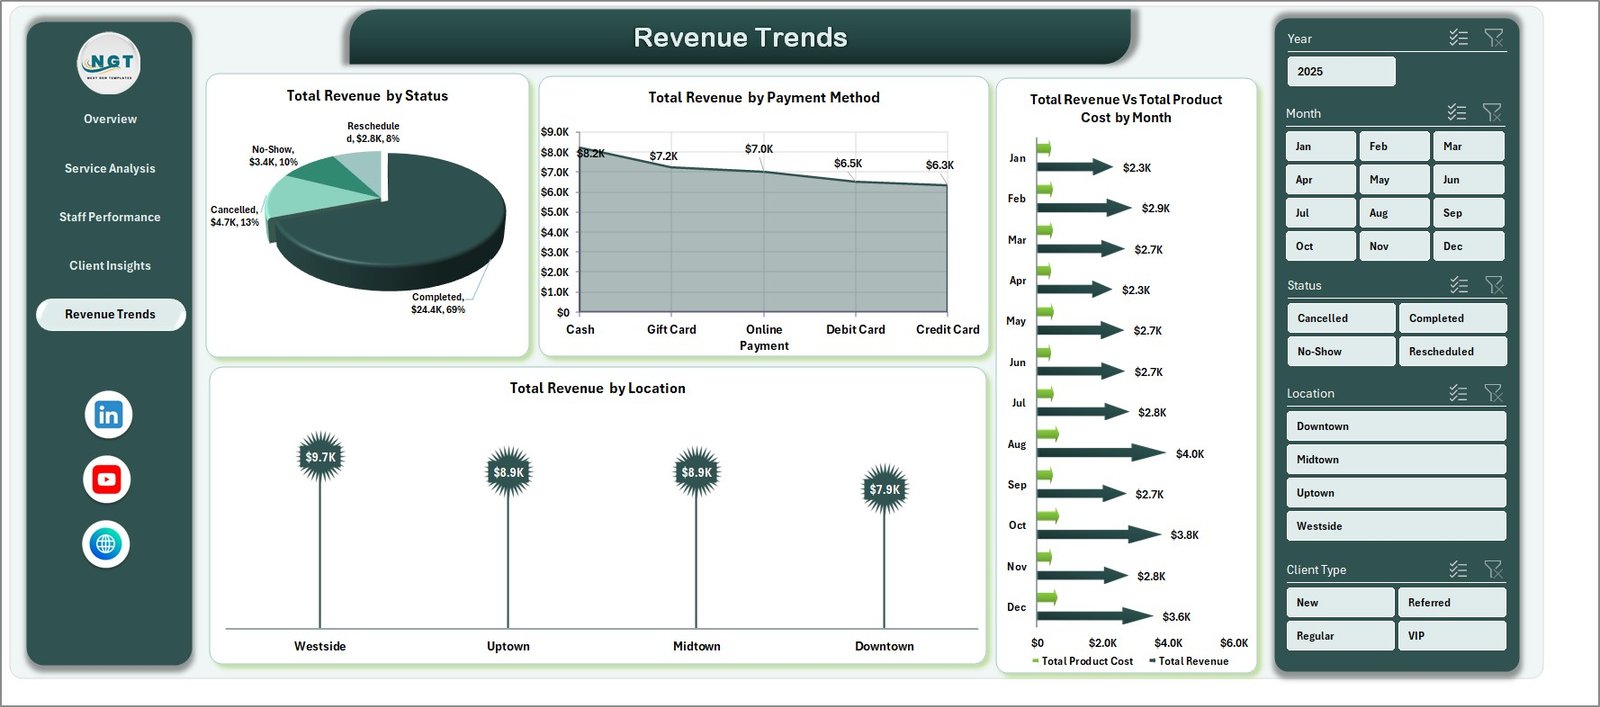
📌 Revenue Trends Page — Tracks financial performance over time with Total Revenue by Status, Total Revenue by Payment Method, Total Revenue Vs Total Product Cost by Month, and Total Revenue by Location. Spot seasonal patterns and optimize your pricing strategy.
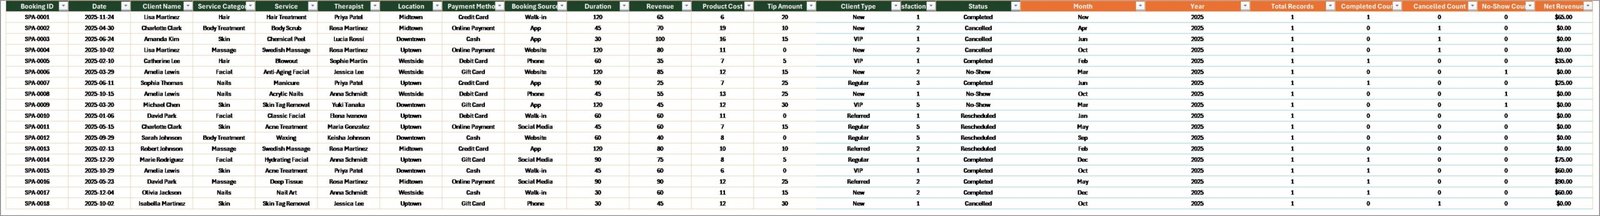
📌 Data Sheet — A structured data input sheet where you add your salon records in the predefined format. Simply paste your data and the entire dashboard updates automatically.
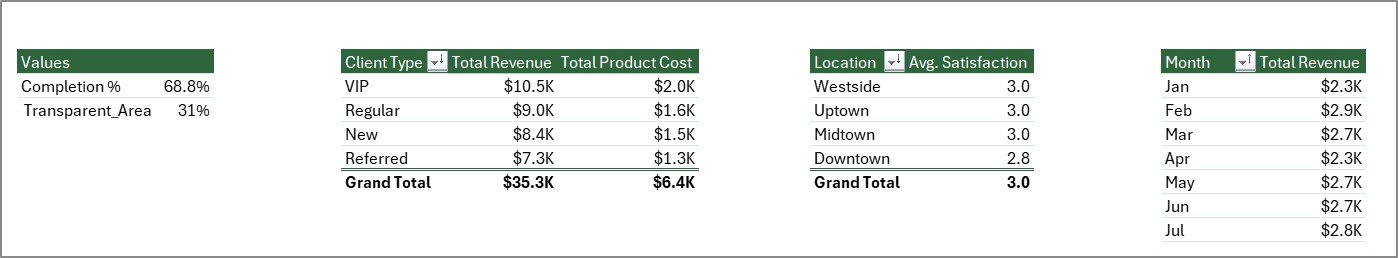
📌 Support Sheet — Contains multiple pivot tables that power the entire dashboard dynamically. Go to the Data tab in the Excel Ribbon and click Refresh All after updating data. Keep this sheet hidden during presentations.
If you also run beauty businesses on other platforms, explore the Beauty Salons Dashboard in Excel or the Beauty Salons Dashboard in Power BI for more specialized analytics.
⚙️ How to Use the Salon and Spa Dashboard in Excel
1️⃣ Download and open the Excel file on your desktop
2️⃣ Navigate to the Data Sheet tab and replace the sample data with your own salon records
3️⃣ Go to the Data tab in the Excel Ribbon and click Refresh All to update all pivot tables
4️⃣ Use the interactive slicers on the Overview page to filter by location, service, client type, or date range
5️⃣ Explore each dashboard page to analyze services, staff, clients, and revenue trends
6️⃣ Keep the Support Sheet hidden during client presentations for a clean look
👥 Who Can Benefit from This Salon and Spa Dashboard in Excel
🎯 Salon owners and beauty parlor managers who want to track daily operations
🎯 Spa directors monitoring therapist performance and treatment revenue
🎯 Beauty business consultants presenting data-driven insights to clients
🎯 Multi-location salon chains comparing performance across branches
🎯 Wellness center managers tracking client satisfaction and booking trends
🎯 Freelance beauticians analyzing their service revenue and tips
❓ Frequently Asked Questions
What KPIs does the Salon and Spa Dashboard in Excel track?
The Salon and Spa Dashboard in Excel tracks 5 key performance indicators on the overview page: Total Records, Total Revenue, Total Completed appointments, Total Tips earned, and Average Satisfaction score. Additional metrics are available across the service analysis, staff performance, client insights, and revenue trends pages.
Do I need advanced Excel skills to use this dashboard?
No. Simply replace the sample data in the Data Sheet with your own salon records and click Refresh All in the Data tab. All charts, KPI cards, and pivot tables update automatically without any manual formula editing.
Can I use this dashboard for multiple salon locations?
Yes. The dashboard includes location-based analysis on both the Overview page and the Revenue Trends page. Add records for all your locations in the Data Sheet and use the slicers to filter by specific branches or view combined performance.
What is the best Excel dashboard template for tracking salon and spa performance?
The Salon and Spa Dashboard in Excel from NextGen Templates is one of the best options available. It includes 5 interactive pages covering service analysis, staff performance, client insights, and revenue trends with fully dynamic charts powered by pivot tables.
How do I refresh the dashboard after adding new data?
After adding or updating records in the Data Sheet, navigate to the Data tab in the Excel Ribbon and click Refresh All. This refreshes all pivot tables in the Support Sheet and updates every chart across all 5 dashboard pages automatically.
🔗 Explore Related Templates
📊 Beauty Salons Dashboard in Excel — Specialized analytics dashboard designed for beauty salon operations with appointment and treatment tracking.
📊 Beauty Salons Dashboard in Power BI — Advanced interactive Power BI dashboard for beauty salons with drill-through analysis and AI-powered visuals.
📊 Alternative Medicine Dashboard in Excel — Track wellness treatments, therapist performance, and client satisfaction for alternative health practices.
📖 Click here to read the Detailed Blog Post
🎥 Visit our YouTube channel to learn step-by-step video tutorials
👉 YouTube.com/@NextGenTemplates
Watch the step-by-step video tutorial:
YouTube


Reviews
There are no reviews yet.