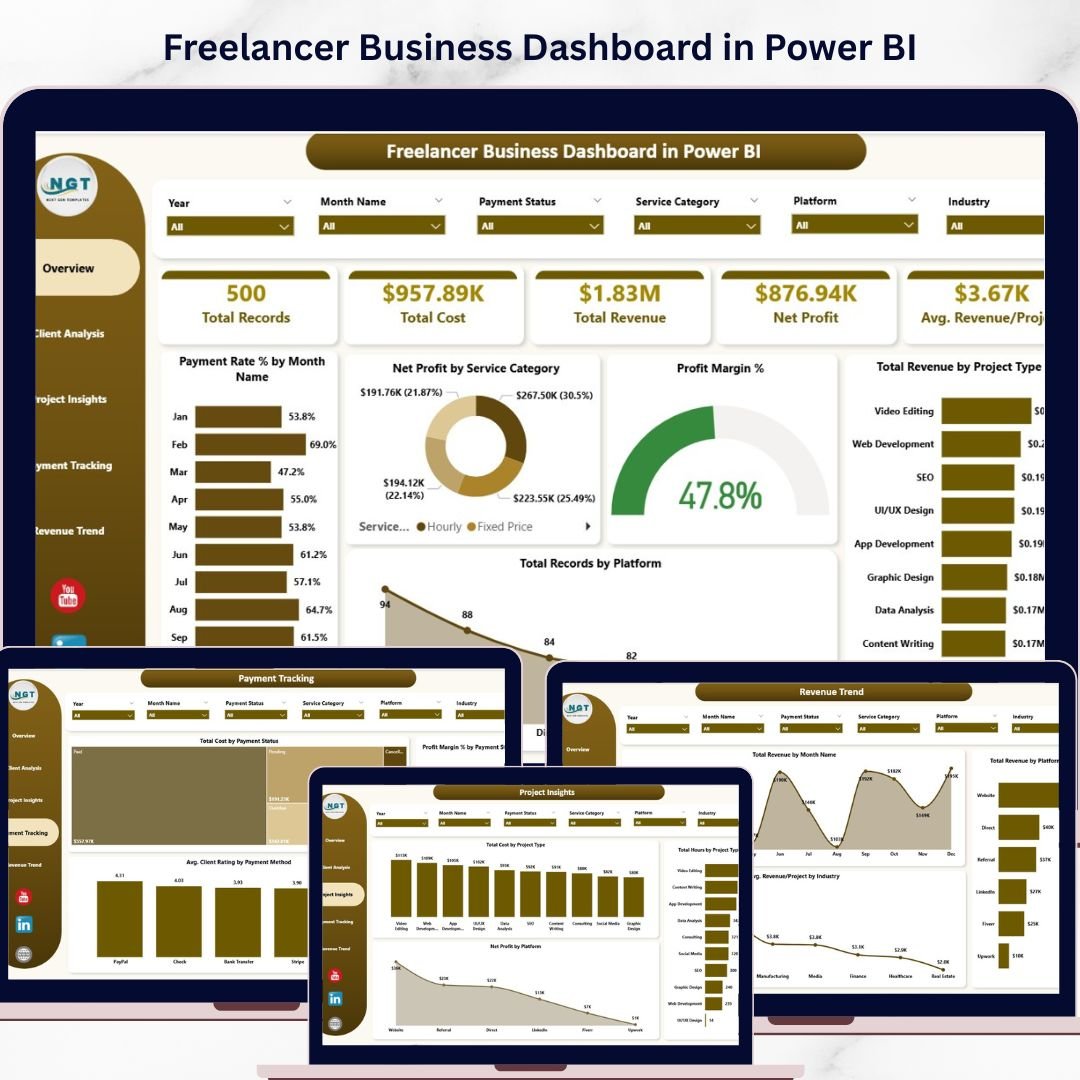

Freelancer Business Dashboard in Power BI is a professionally designed analytics template built for freelancers, independent consultants, solopreneurs, and small business owners who want to monitor revenue, costs, profitability, client performance, and payment trends from a single dynamic interface. This Power BI Dashboard transforms raw freelance project data into actionable visual insights that help you make smarter business decisions 🚀. Simply open the .pixy file in Power BI Desktop, replace the sample data with your own, and watch your entire dashboard update automatically.
This template includes 5 interactive dashboard pages covering Overview, Client Analysis, Project Insights, Payment Tracking, and Revenue Trend — giving you complete visibility into your freelance business with dynamic charts, KPI cards, and slicer-based filtering. Whether you are tracking project revenue by client, analyzing profit margins by service category, or monitoring payment collection rates by month, this Freelancer Business Dashboard in Power BI gives you the data-driven edge every freelancer needs 💼.
🔑 Key Features of Freelancer Business Dashboard in Power BI
📊 5 Interactive Dashboard Pages – Navigate between Overview, Client Analysis, Project Insights, Payment Tracking, and Revenue Trend tabs to explore your freelance business data from every angle.
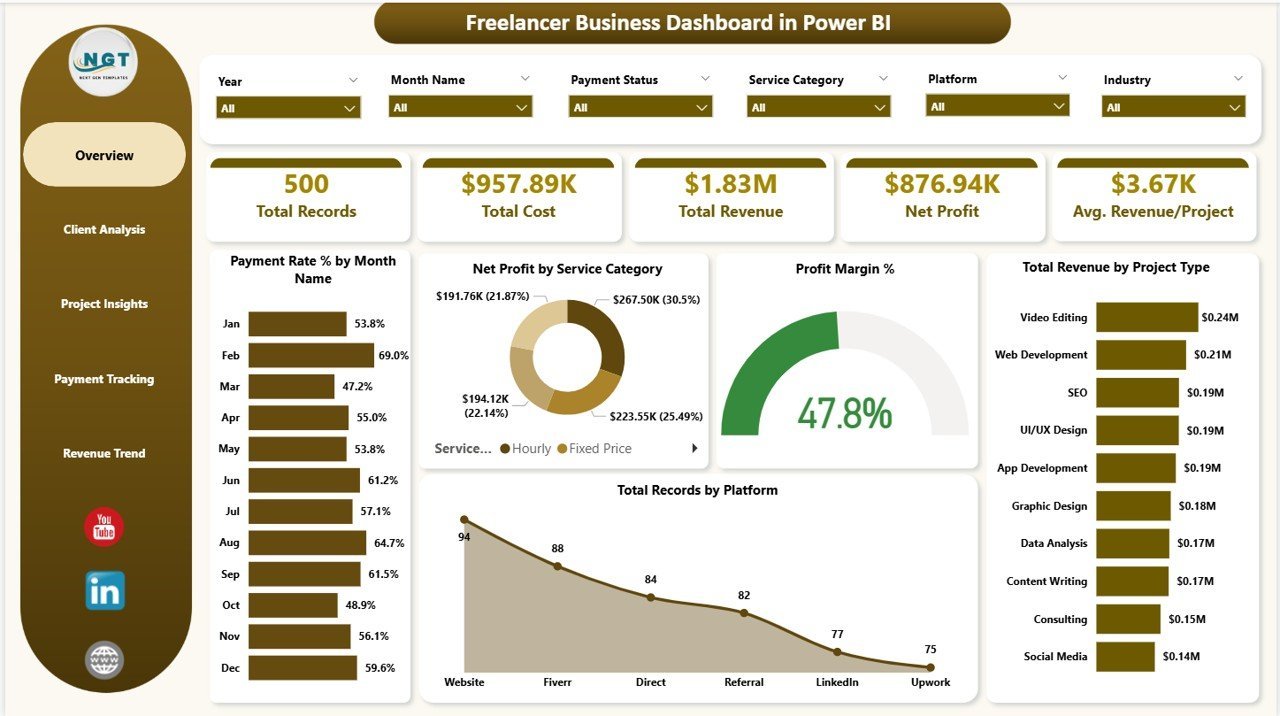
📈 5 Dynamic KPI Cards – Track high-level metrics at a glance including Total Records, Total Cost, Total Revenue, Net Profit, and Avg. Revenue/Project on the overview page.
🔍 Advanced Slicers and Filters – Filter the entire dashboard instantly by service category, project type, platform, payment status, client name, and more for targeted analysis.
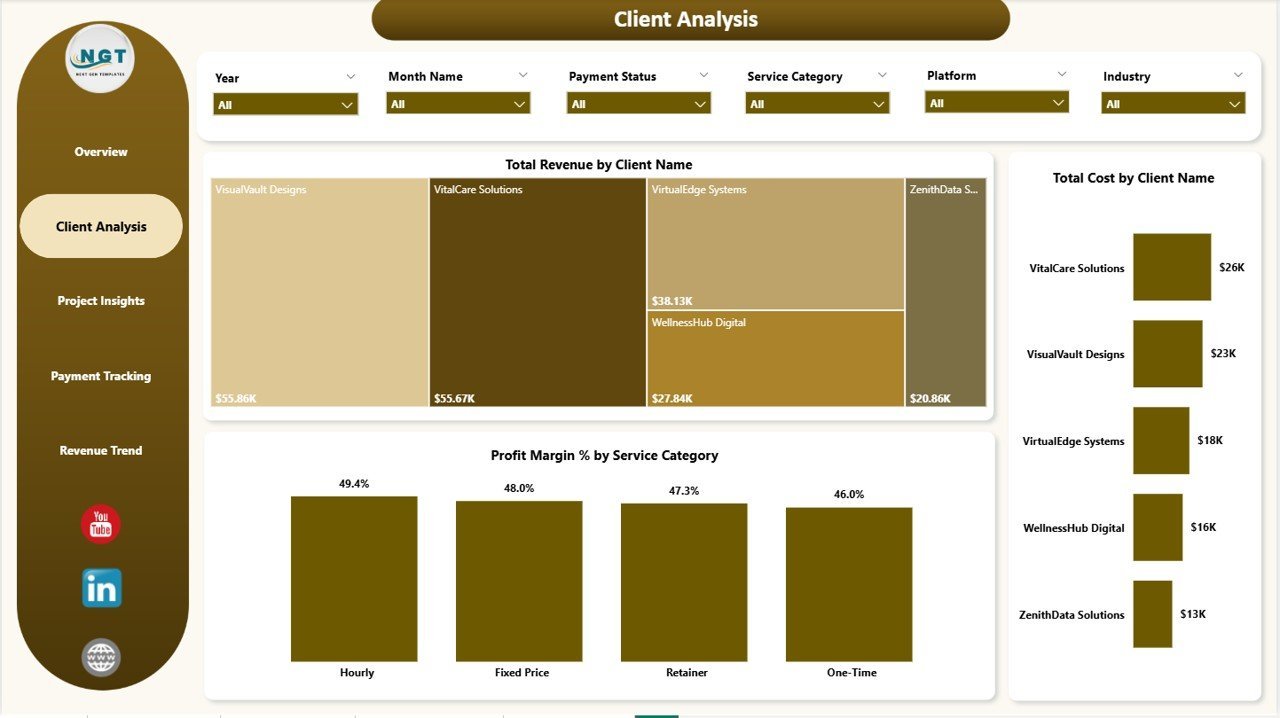
💰 Client Revenue and Cost Analysis – Analyze Total Revenue by Client Name and Total Cost by Client Name side by side, plus drill into Profit Margin % by Service Category to identify your most profitable work.
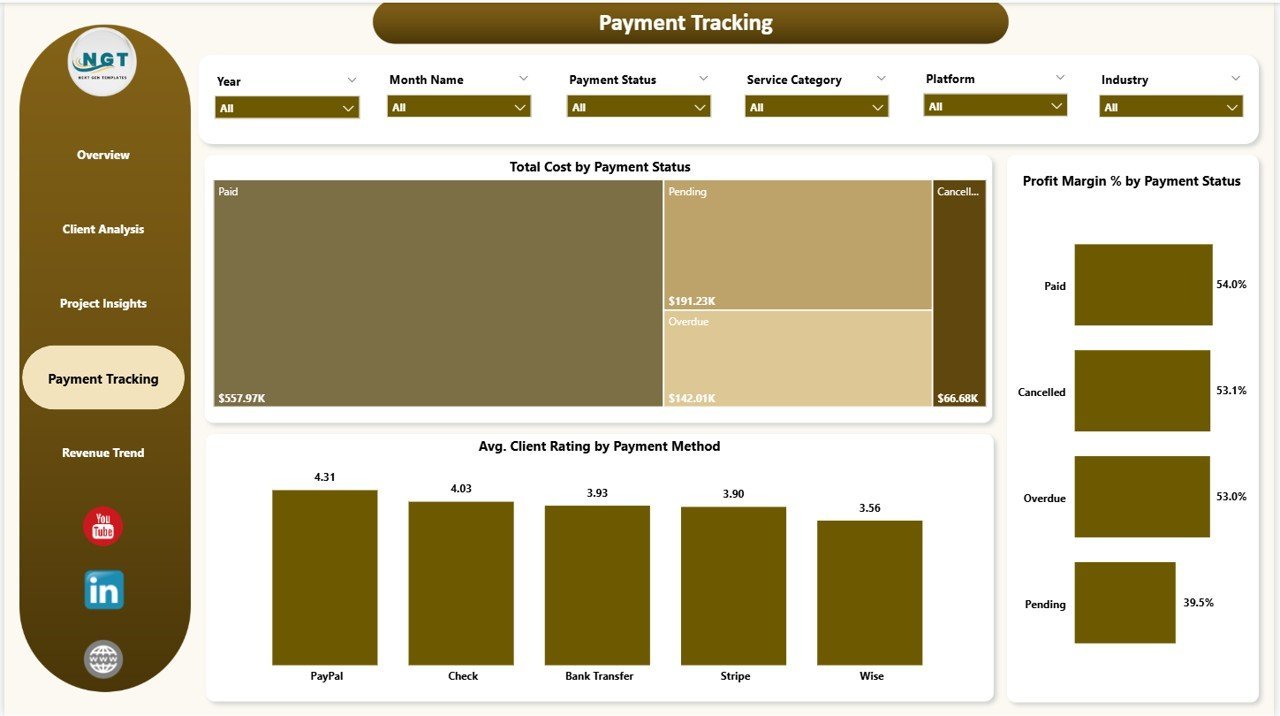
📉 Payment Collection Tracking – Monitor Total Cost by Payment Status, Profit Margin % by Payment Status, and Avg. Client Rating by Payment Method to improve your cash flow management.
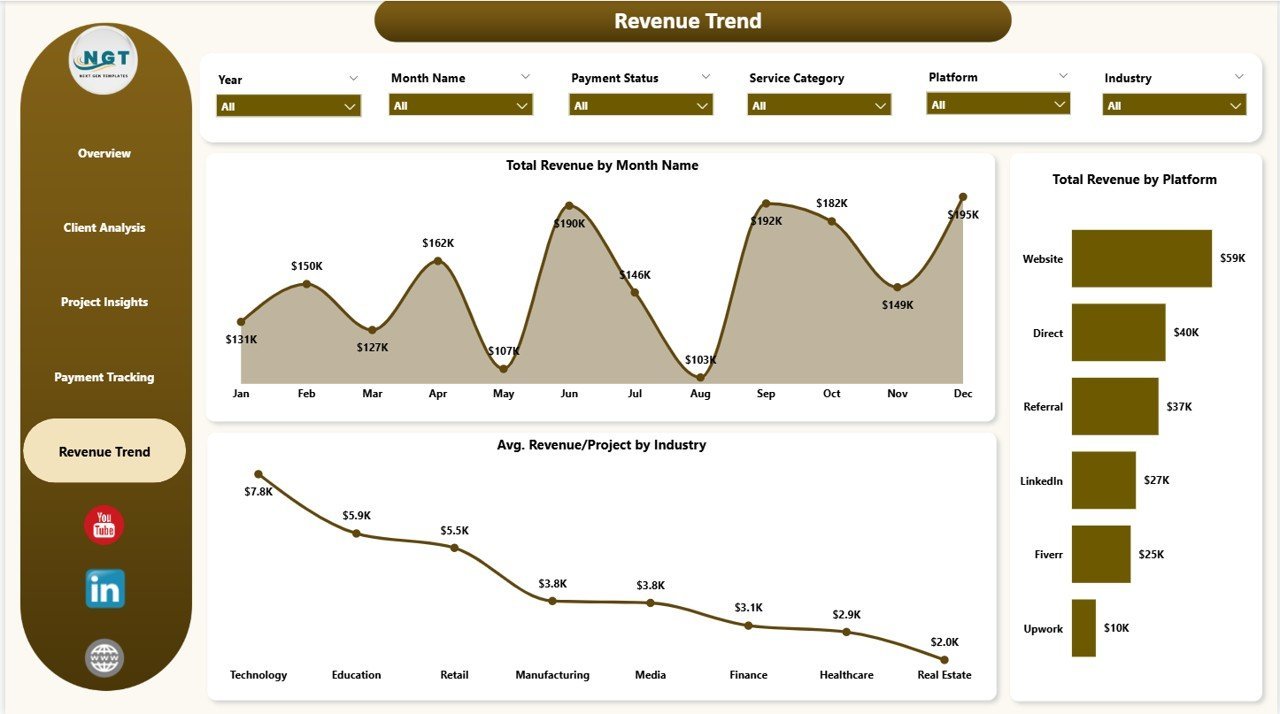
📅 Revenue Trend Analysis – Visualize Total Revenue by Month Name, Total Revenue by Platform, and Avg. Revenue/Project by Industry to spot growth patterns and seasonal trends.
🔗 Project Performance Insights – Explore Total Cost by Project Type, Total Hours by Project Type, and Net Profit by Platform to understand which projects deliver the highest return on your time.
📦 What’s Inside the Freelancer Business Dashboard in Power BI
This dashboard contains 5 purpose-built pages designed specifically for freelance business analytics:
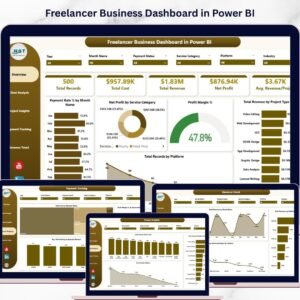
📌 Overview Page – Displays 5 KPI cards (Total Records, Total Cost, Total Revenue, Net Profit, Avg. Revenue/Project) along with charts showing Payment Rate % by Month Name, Net Profit by Service Category, Profit Margin %, Total Revenue by Project Type, and Total Records by Platform. Multiple slicers let you filter and drill down instantly.
 Freelancer Business Dashboard in Power BI
📌 Client Analysis Page – Breaks down Total Revenue by Client Name, Total Cost by Client Name, and Profit Margin % by Service Category so you can identify your highest-value clients and most profitable service lines.
 Client Analysis
📌 Project Insights Page – Analyzes Total Cost by Project Type, Total Hours by Project Type, and Net Profit by Platform to reveal which project categories and platforms generate the best returns.
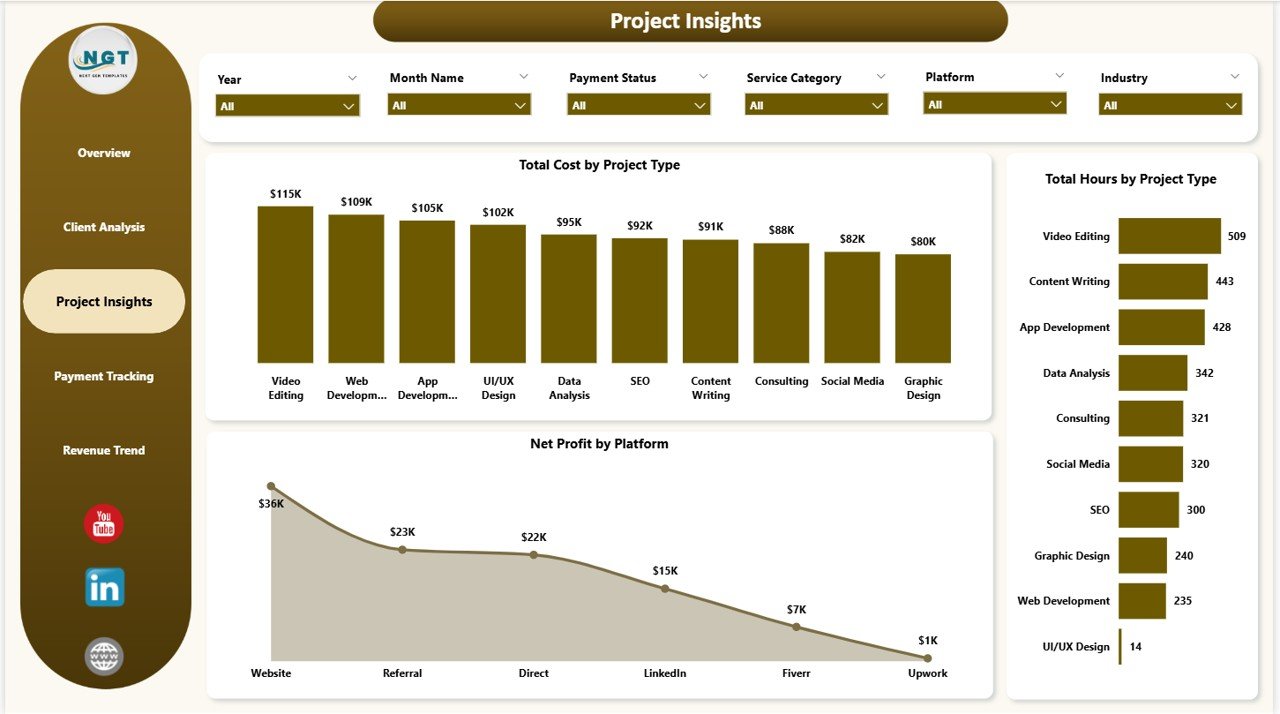 Project Insights
📌 Payment Tracking Page – Monitors Total Cost by Payment Status, Profit Margin % by Payment Status, and Avg. Client Rating by Payment Method to optimize your invoicing and payment collection workflows.
 Payment Tracking
📌 Revenue Trend Page – Tracks Total Revenue by Month Name, Total Revenue by Platform, and Avg. Revenue/Project by Industry to visualize income trends and forecast future earnings.
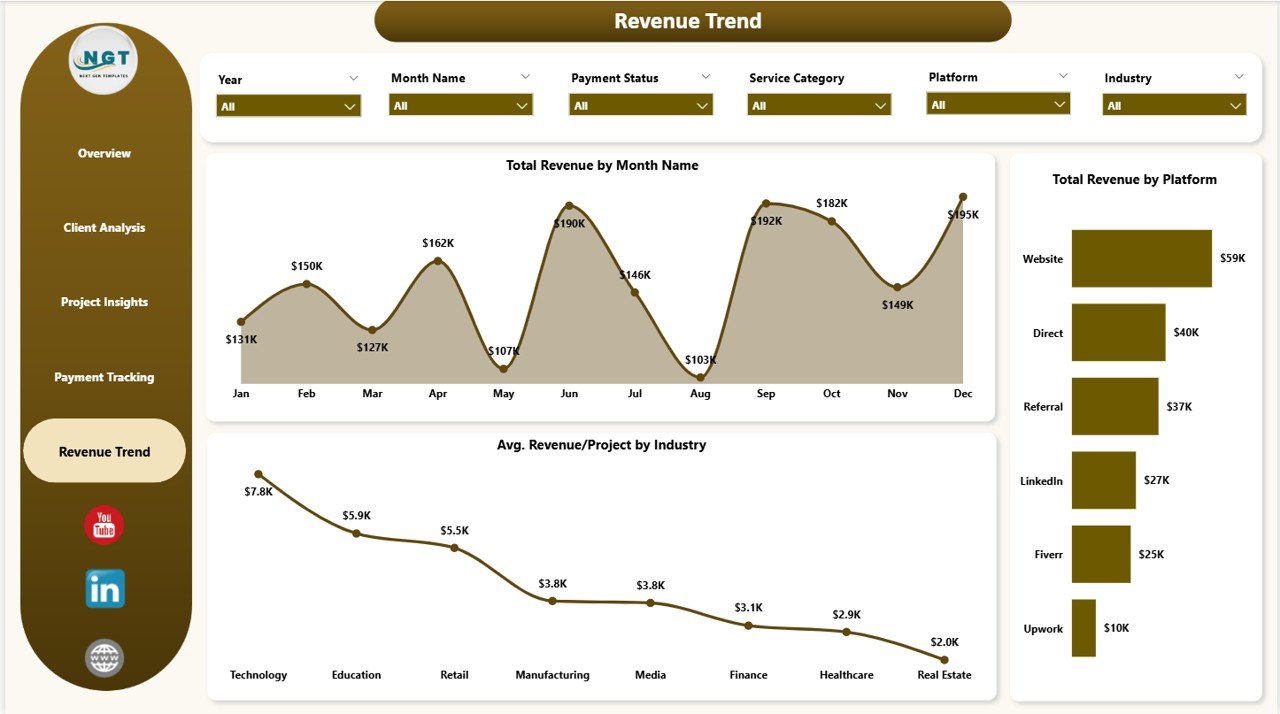 Revenue Trend
⚙️ How to Use the Freelancer Business Dashboard in Power BI
1️⃣ Download and unzip the template file after purchase.
2️⃣ Open the .pbix file in Microsoft Power BI Desktop (free download from Microsoft).
3️⃣ Replace the sample data with your own freelance project data — update client names, project details, revenue, costs, and payment information.
4️⃣ Click Refresh to update all visuals automatically.
5️⃣ Use the slicers and filters on each page to drill down into specific clients, service categories, platforms, or time periods.
👥 Who Can Benefit from This Freelancer Business Dashboard in Power BI
🎯 Freelancers and independent contractors tracking income, expenses, and profitability across multiple clients and projects.
🎯 Solopreneurs and consultants who want clear visibility into their business performance without complex accounting software.
🎯 Creative professionals, developers, and designers managing multiple platform-based projects (Upwork, Fiverr, Toptal, direct clients).
🎯 Small agency owners monitoring team productivity, project costs, and client satisfaction metrics.
🎯 Finance and business students learning Power BI with real-world freelance business data. Also check out the Freelancer Business Dashboard in Excel and Freelance Business KPI Scorecard in Google Sheets for alternative platform options.
❓ Frequently Asked Questions
What KPIs does the Freelancer Business Dashboard in Power BI track?
The Freelancer Business Dashboard in Power BI tracks 5 key performance indicators on the overview page including Total Records, Total Cost, Total Revenue, Net Profit, and Avg. Revenue/Project. Additional metrics across other pages include Profit Margin %, Payment Rate %, and Avg. Client Rating.
Do I need advanced Power BI skills to use this template?
No. Simply open the .pbix file in Power BI Desktop, replace the sample data with your own freelance project data, and click Refresh. All charts, KPI cards, and filters update automatically without any DAX or formula editing required.
Can I track multiple freelance platforms in this dashboard?
Yes. The dashboard includes a Platform dimension that lets you analyze Total Records by Platform, Net Profit by Platform, and Total Revenue by Platform — perfect for freelancers working across Upwork, Fiverr, Toptal, and direct client channels.
How is this different from the Freelancer Business Dashboard in Excel?
The Power BI version offers more advanced interactive filtering, cross-page drill-through capabilities, and richer data visualization compared to the Excel version. Power BI also handles larger datasets more efficiently and provides a more polished presentation experience.
What is the best Power BI dashboard template for freelancers?
The Freelancer Business Dashboard in Power BI from NextGenTemplates is one of the best options available. It includes 5 interactive pages covering revenue, costs, clients, projects, and payments with dynamic KPI cards and slicer-based filtering for complete freelance business visibility.
🔗 Explore Related Templates
📎 Freelancer Business Dashboard in Excel – Same freelance analytics concept built in Microsoft Excel with pivot tables and dynamic charts.
📎 Freelance Business KPI Scorecard in Google Sheets – A KPI scorecard template for freelancers who prefer Google Sheets.
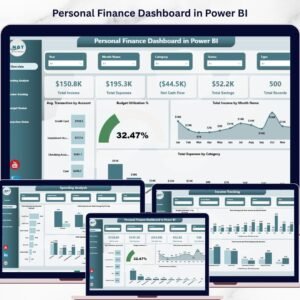
📎 Personal Finance Dashboard in Power BI – Track your personal income, expenses, and savings goals in Power BI.
📖 Click here to read the Detailed Blog Post
🎥 Visit our YouTube channel to learn step-by-step video tutorials
👉 YouTube.com/@NextGenTemplates
Watch the step-by-step video tutorial:
YouTube


Reviews
There are no reviews yet.