
Key Features of Call Abandonment Rate KPI Dashboard in Google Sheets
Unlock the power of actionable insights with our Call Abandonment Rate KPI Dashboard in Google Sheets, designed to help businesses monitor, analyze, and improve call center performance effortlessly. This ready-to-use, fully customizable template consolidates all critical KPI data into one interactive dashboard, allowing you to track monthly and yearly trends with ease.
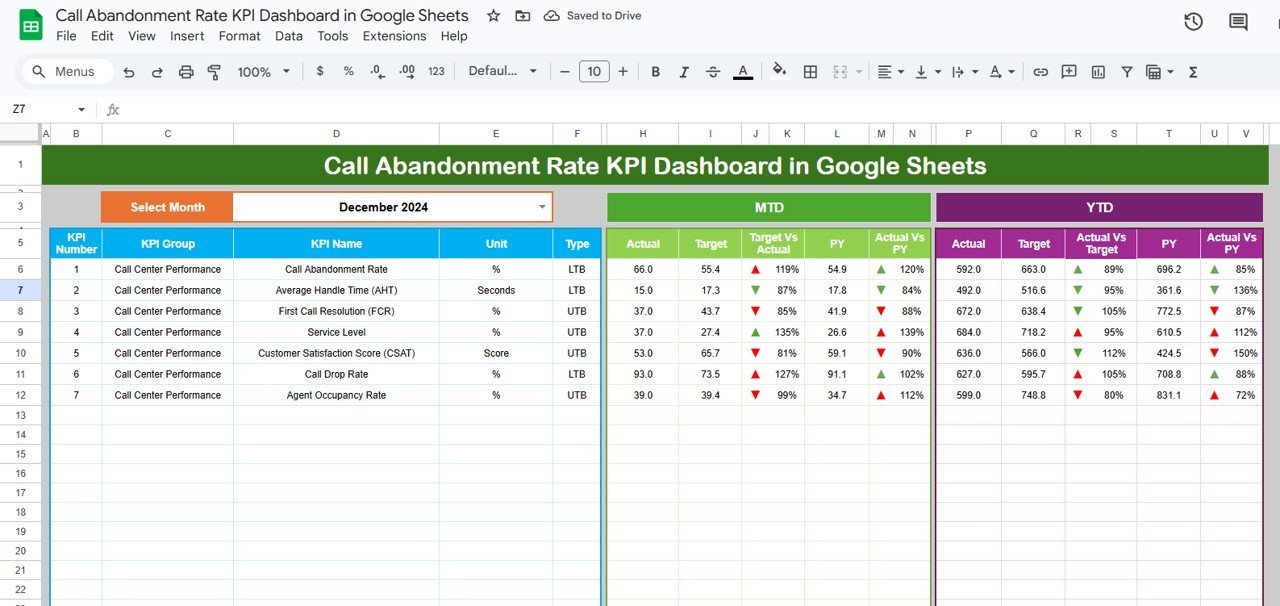
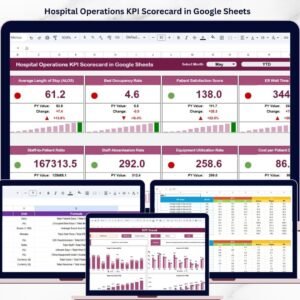
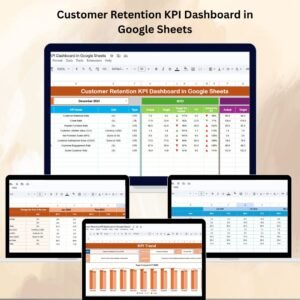
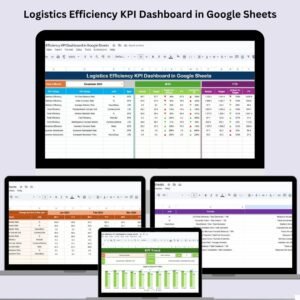
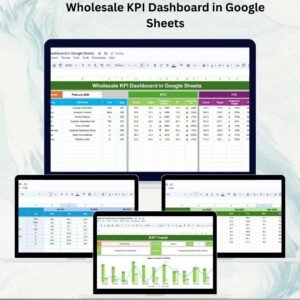
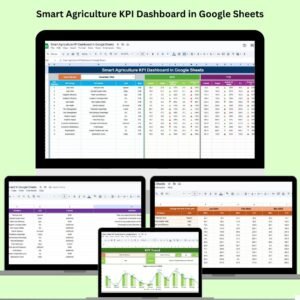
Featuring six well-organized worksheets, this dashboard provides a comprehensive view of your call abandonment metrics. The Dashboard sheet is the main control center, where you can select any month from a drop-down menu, and instantly see the MTD (Month-To-Date) Actual, Target, and Previous Year data. It also highlights Target vs Actual and Previous Year vs Actual comparisons with intuitive conditional formatting using up/down arrows for quick interpretation.
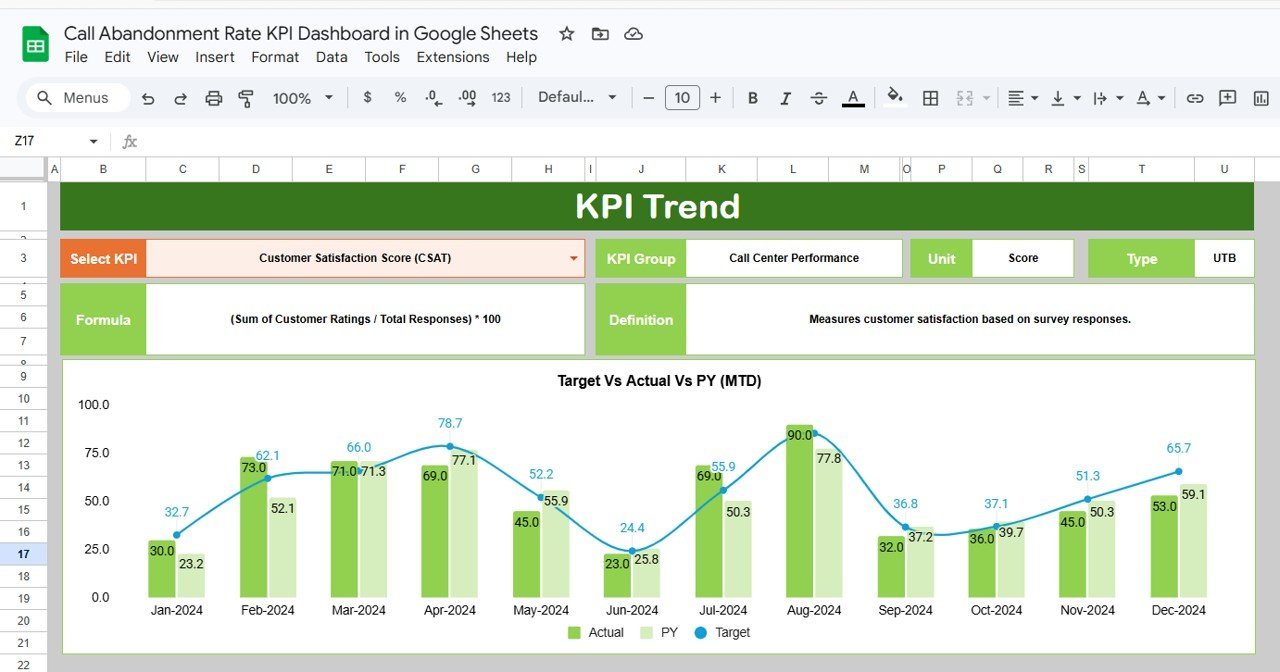
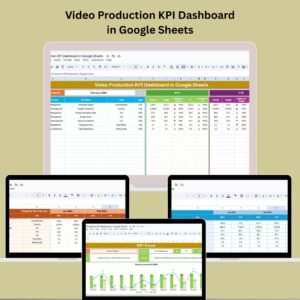
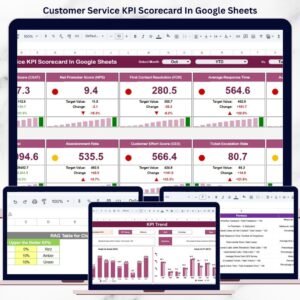
The KPI Trend sheet allows you to deep-dive into specific KPIs by selecting the KPI name from a drop-down menu, displaying KPI groupings, units, types (Lower the Better or Upper the Better), formulas, and definitions. This sheet also presents dynamic MTD and YTD trend charts for Actual, Target, and Previous Year data, making data-driven decisions simpler than ever.
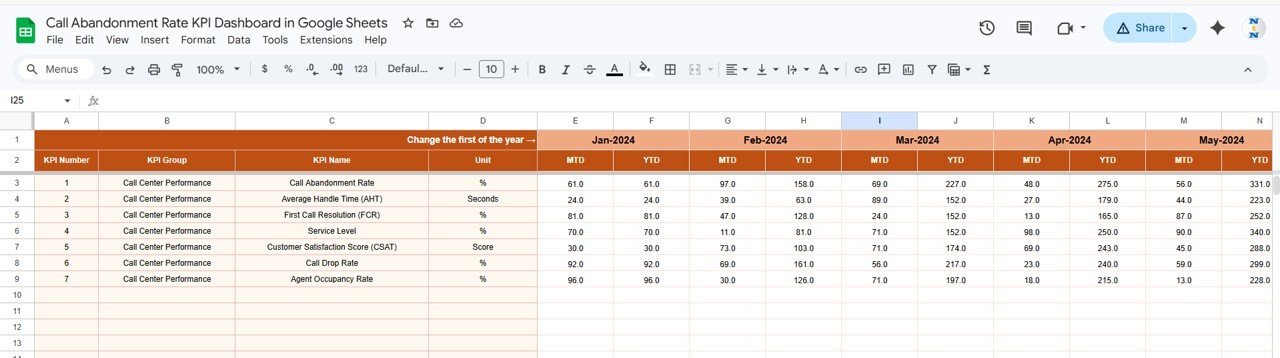
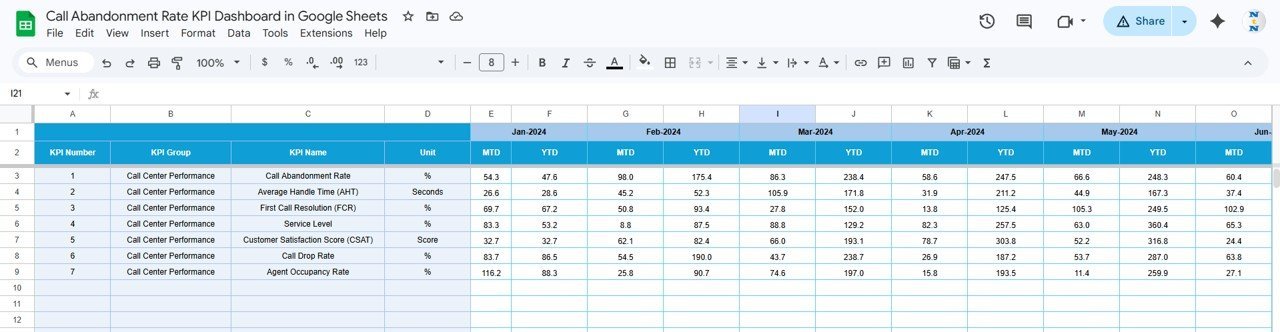
Input sheets for Actual Numbers and Target Numbers provide user-friendly interfaces to enter your monthly and yearly data. You can easily adjust the starting month of the year to align with your fiscal calendar. The Previous Year Number sheet ensures you can compare current performance against historical data accurately.
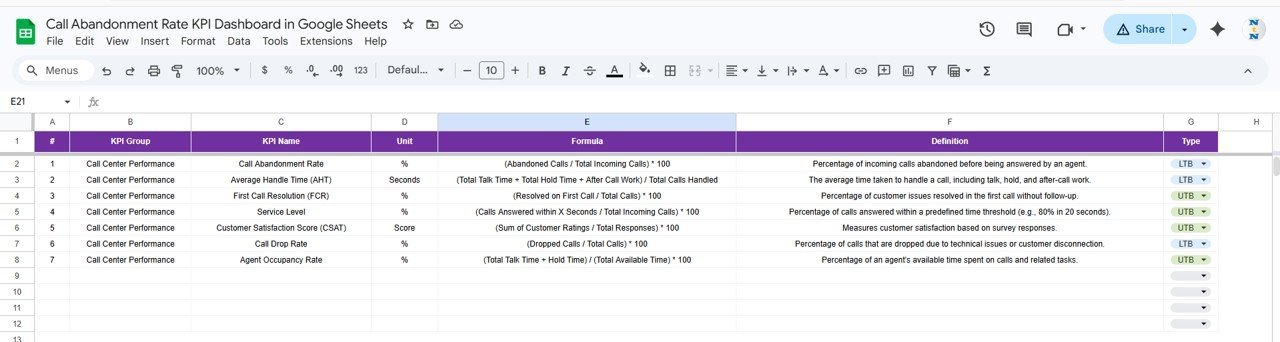
Finally, the KPI Definition sheet lets you customize and define your KPIs with details such as KPI name, group, unit, formula, definition, and KPI type (Lower the Better or Upper the Better), enabling full personalization to your business metrics.
What’s Inside the Call Abandonment Rate KPI Dashboard in Google Sheets
- 📊 Dashboard Sheet: Interactive monthly and yearly KPI summaries with conditional formatting for quick insights.
- 📈 KPI Trend Sheet: Detailed KPI breakdown with trend charts for actual, target, and previous year comparisons.
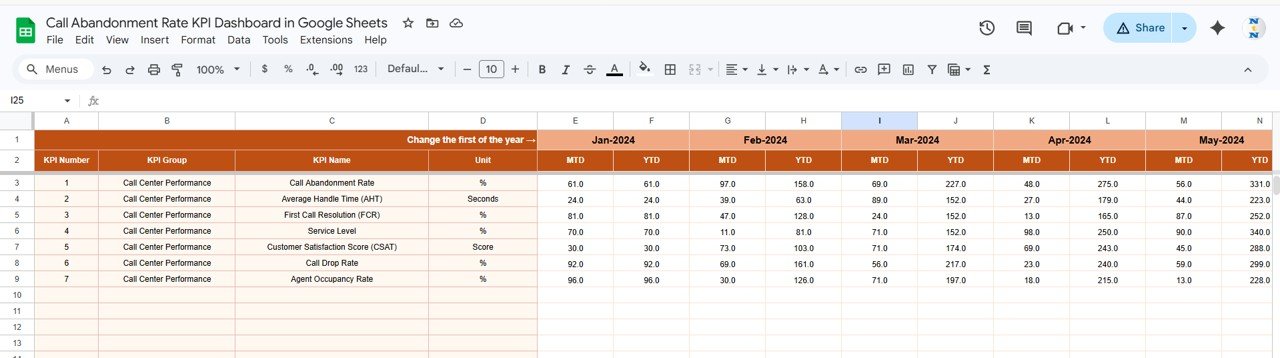
- 📝 Actual Numbers Input Sheet: Easy data entry for month-to-date and year-to-date actual values.
- 🎯 Target Number Input Sheet: Set and adjust target KPIs monthly and yearly to track progress.
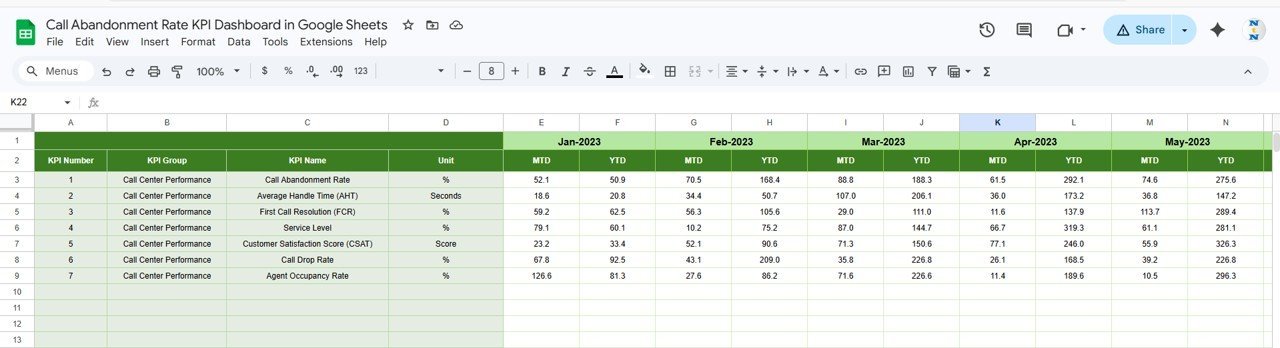
- 📅 Previous Year Number Sheet: Input prior year data for effective benchmarking.
- 📚 KPI Definition Sheet: Customize your KPIs including formula, unit, and type for precise measurement.
- 🔄 Dynamic Filtering: Select months or KPIs via drop-downs to instantly update dashboard views.
- 📊 Visual Indicators: Conditional formatting with arrows to easily spot performance trends.
How to Use the Call Abandonment Rate KPI Dashboard in Google Sheets
- 🔄 Select the month: Use the drop-down in the Dashboard sheet (cell D3) to choose the month for which you want to view KPIs.
- 📝 Enter actual data: Go to the Actual Numbers Input sheet to fill in your month-to-date and year-to-date call abandonment data.
- 🎯 Set targets: Input monthly and yearly target KPIs in the Target Number Input sheet to benchmark your goals.
- 📅 Input previous year data: Use the Previous Year Number sheet to enter last year’s figures for accurate trend analysis.
- 📚 Define KPIs: Customize or add new KPIs in the KPI Definition sheet by specifying their formulas, units, and whether lower or upper values are better.
- 📊 Analyze trends: Check the KPI Trend sheet to see graphical representations of your KPIs over time.
- 🔍 Interpret Results: Use the Dashboard’s conditional formatting arrows to quickly assess if performance is improving or declining.
- 💡 Make data-driven decisions: Use insights from the dashboard to reduce call abandonment rates and improve customer satisfaction.
Who Can Benefit from This Call Abandonment Rate KPI Dashboard in Google Sheets
- 📞 Call Center Managers: Easily monitor call abandonment trends and adjust staffing or processes accordingly.
- 📊 Business Analysts: Analyze KPI trends and generate reports for management using dynamic dashboards.
- 👩💼 Customer Service Teams: Track performance against targets to improve response times and customer experience.
- 🏢 Small to Medium Enterprises: Get professional-level KPI tracking without expensive software.
- 📈 Operations Managers: Identify bottlenecks and improve operational efficiency based on real data.
- 🧑💻 Data Enthusiasts: Customize and expand the dashboard to integrate with other business metrics.
Click here to read the Detailed blog post.
Visit our YouTube channel to learn step-by-step video tutorials

Call Abandonment Rate KPI Dashboard in Google Sheets
KPI Trend Sheet


Reviews
There are no reviews yet.