Customer complaints are not just service issues—they are powerful signals about product quality, service gaps, and customer expectations. When complaints are handled slowly or inconsistently, customer trust erodes, brand reputation suffers, and revenue is put at risk. Unfortunately, many organizations still manage complaints through emails, ticket lists, or scattered spreadsheets. As a result, resolution delays increase, backlogs grow, and performance visibility disappears.
That is exactly why the Customer Complaint Resolution KPI Dashboard in Google Sheets becomes a must-have customer experience management tool.
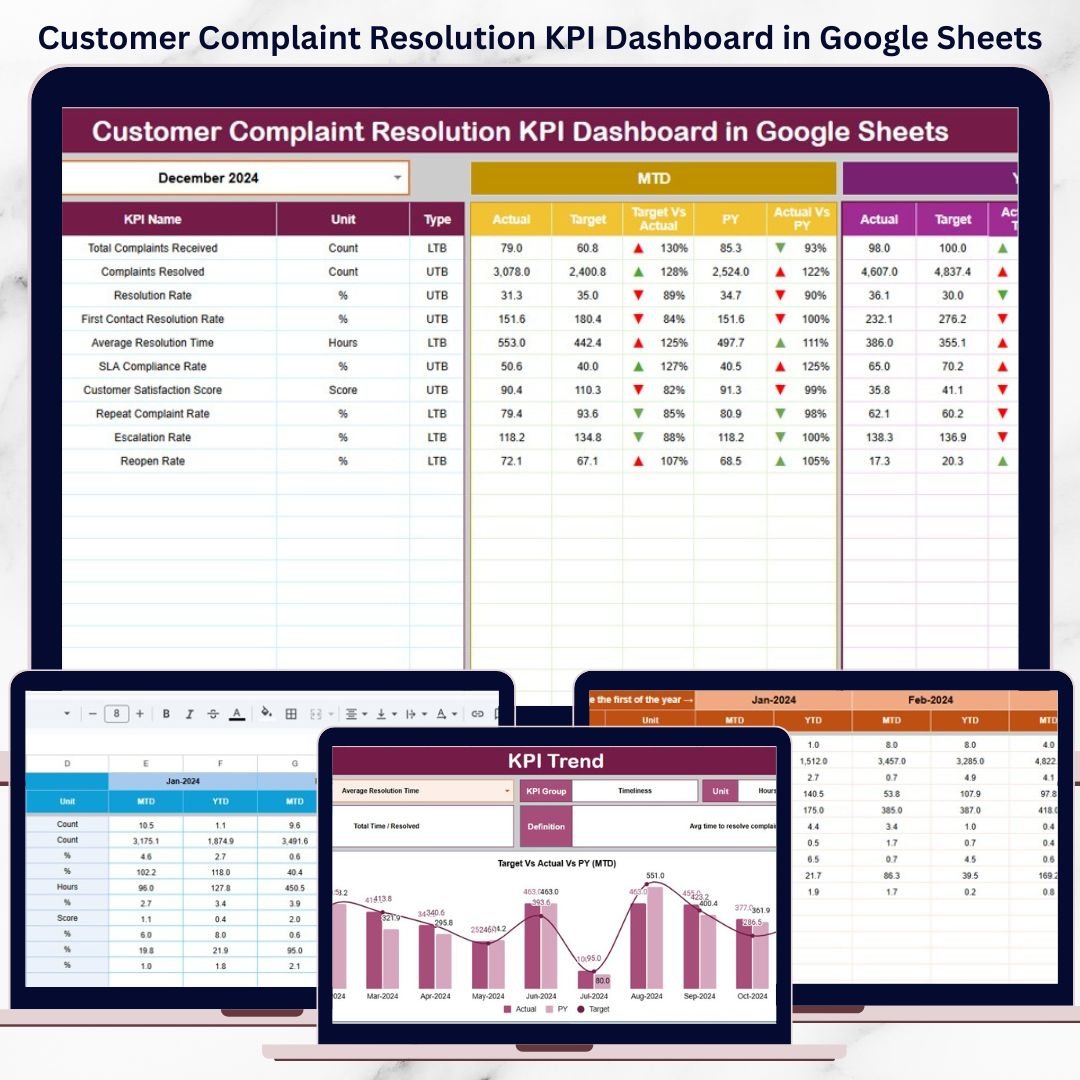
This ready-to-use dashboard provides a centralized, KPI-driven system to track complaint volume, resolution speed, backlog, SLA compliance, and service quality. Instead of reacting to complaints after escalation, teams gain real-time visibility into performance trends and bottlenecks. With automated calculations, comparison metrics, and trend analysis, managers can quickly identify gaps and improve resolution efficiency—without expensive CRM or BI software.
Because the dashboard is built entirely in Google Sheets, it is easy to use, collaborative, and scalable for teams of all sizes.
✨ Key Features of the Customer Complaint Resolution KPI Dashboard in Google Sheets
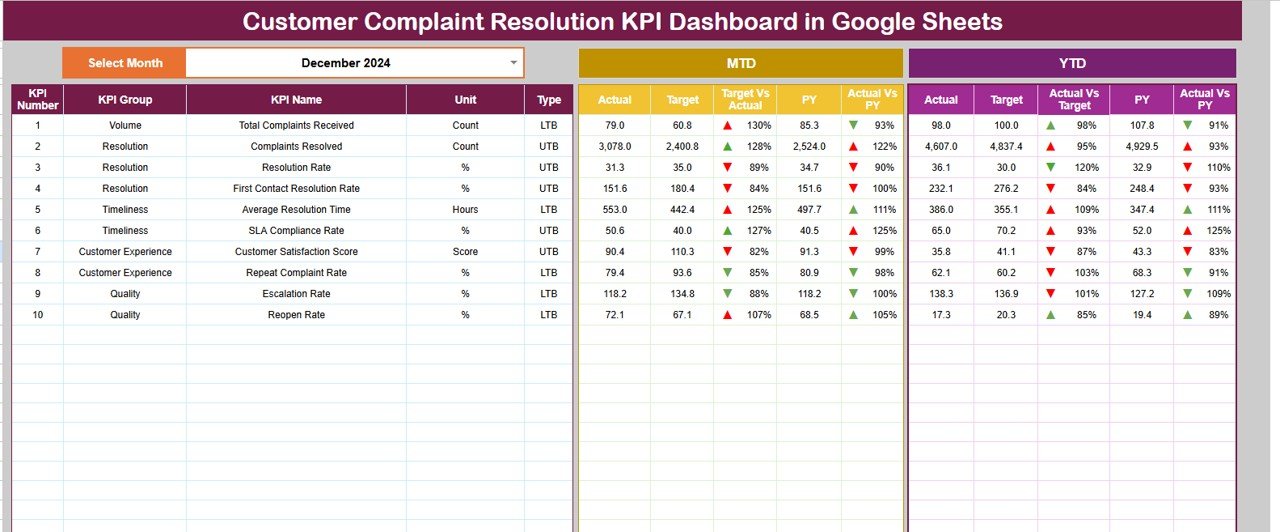
📊 1. MTD & YTD Complaint Performance Tracking
Monitor Month-to-Date and Year-to-Date complaint KPIs to evaluate short-term service quality and long-term improvement.
🎯 2. Target vs Actual & Previous-Year Comparison
Compare actual performance against targets and last year’s results to identify service gaps and progress.
📈 3. Visual Performance Indicators
Conditional formatting arrows give instant clarity:
-
🟢 Green arrow → improved resolution performance
-
🔴 Red arrow → delays or service decline
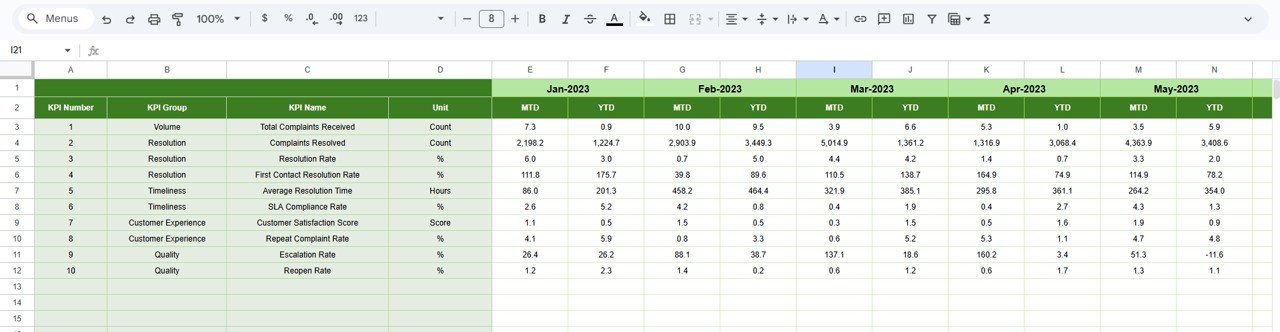
📉 4. KPI Trend Analysis
Track month-wise KPI movement to understand complaint patterns, backlog growth, and resolution efficiency.
☁️ 5. Google Sheets-Based Collaboration
Enable customer support, quality teams, and leadership to work together using a single shared dashboard.
📦 What’s Inside the Customer Complaint Resolution KPI Dashboard in Google Sheets
🖥️ Dashboard Sheet Tab (Main Control Panel)
This is the executive view used during service reviews and management meetings.
Month Selector
-
Located in cell D3
-
Automatically refreshes all KPIs
MTD Metrics Displayed
-
Actual
-
Target
-
Previous Year
-
Target vs Actual
-
Previous Year vs Actual
YTD Metrics Displayed
-
Actual
-
Target
-
Previous Year
-
Target vs Actual
-
Previous Year vs Actual
This structure gives leaders a complete view of complaint handling performance at a glance.
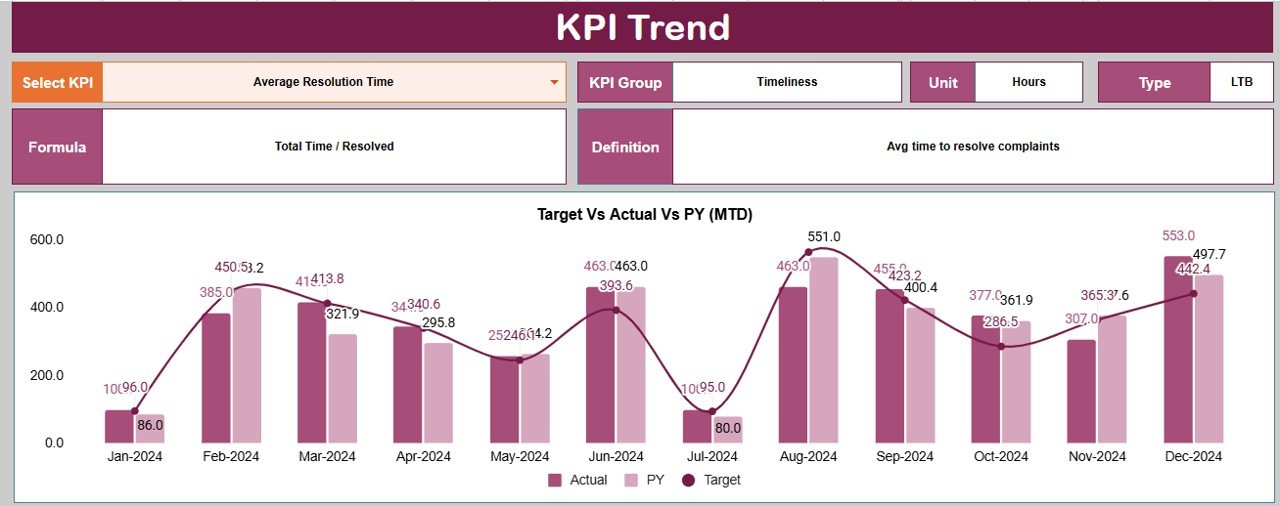
📊 KPI Trend Sheet Tab
This sheet allows deep-dive analysis of individual complaint KPIs.
How It Works
-
Select a KPI from the dropdown in cell C3
Details Displayed
-
KPI Group
-
Unit of Measurement
-
KPI Type (UTB / LTB)
-
KPI Formula
-
KPI Definition
Trend Visualization
-
Month-wise KPI movement
-
Resolution speed patterns
-
Backlog and SLA risk indicators
This sheet is ideal for root-cause analysis and service improvement planning.
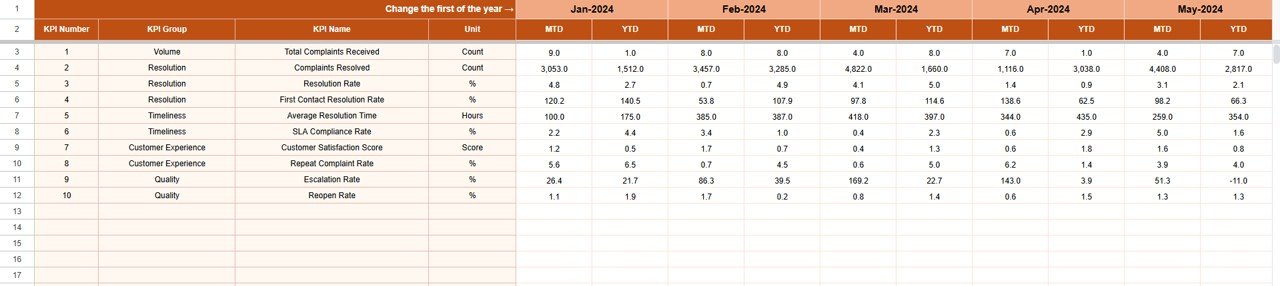
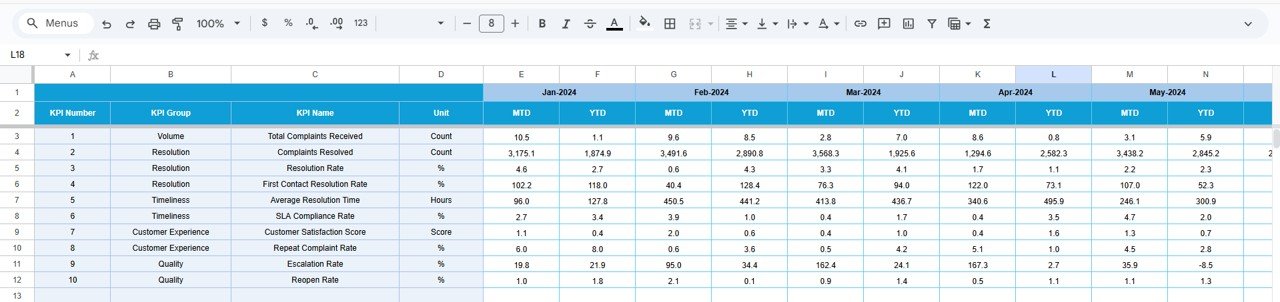
📋 Actual Number Sheet Tab
This is the structured data-entry sheet for real complaint performance.
-
Enter MTD Actual values
-
Enter YTD Actual values
-
Define the first month of the year in cell E1
All calculations and visuals update automatically.
🎯 Target Sheet Tab
This sheet stores complaint resolution goals.
-
Monthly (MTD) targets
-
Annual (YTD) targets
Targets help teams stay aligned with SLA commitments and CX goals.
📆 Previous Year Number Sheet Tab
Stores last year’s complaint data to support:
-
Year-over-year comparison
-
Service improvement benchmarking
-
Historical trend analysis
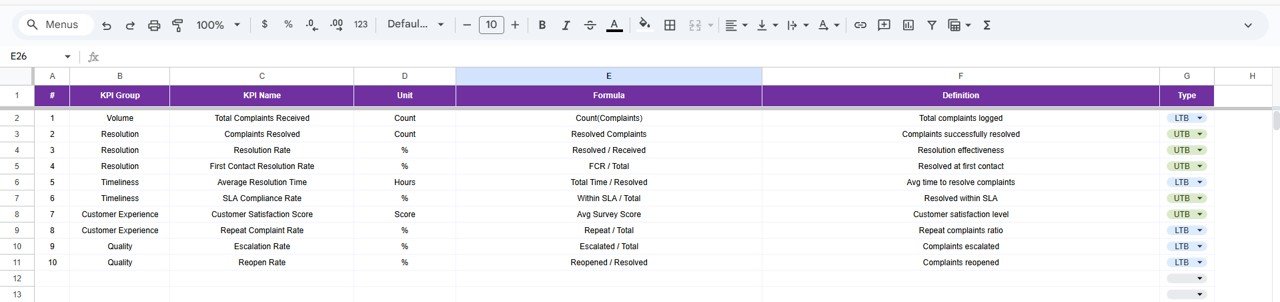
📘 KPI Definition Sheet Tab
This is the governance layer of the dashboard.
It contains:
-
KPI Name
-
KPI Group
-
Unit
-
Formula
-
KPI Definition
-
KPI Type (UTB / LTB)
This ensures consistent KPI interpretation across all stakeholders.
🎯 Who Can Benefit from This Customer Complaint Resolution KPI Dashboard
🎧 Customer Support Teams
Track resolution speed, backlog, and SLA compliance clearly.
📊 CX & Quality Managers
Identify recurring service issues and improvement opportunities.
🏢 Service Leadership
Gain real-time visibility into complaint performance and risks.
📈 Process Improvement Teams
Use KPI trends to optimize workflows and reduce escalations.
🏬 Organizations of Any Size
Improve complaint management without complex tools.
### Click here to read the Detailed blog post
Watch the step-by-step video tutorial:


Reviews
There are no reviews yet.