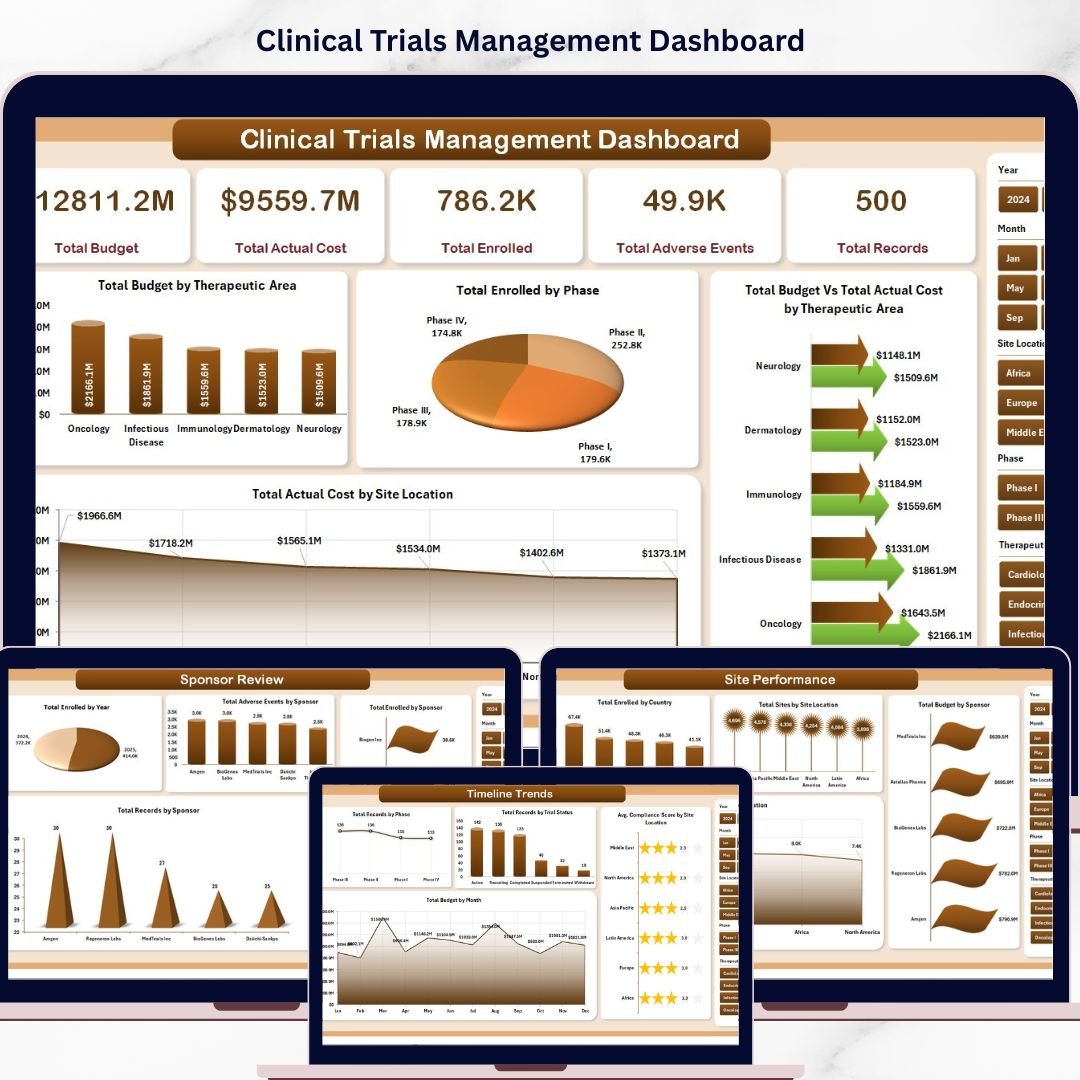

Clinical Trials Management Dashboard in Excel is a powerful, ready-to-use analytics solution designed to help pharmaceutical companies, CROs, and healthcare research teams track trial performance, budgets, enrollment, adverse events, and compliance from one centralized Excel workbook. Managing clinical trial data across multiple spreadsheets and disconnected reports creates confusion, delays decisions, and increases the risk of compliance issues. This Excel Dashboard Template eliminates those challenges by transforming your raw trial data into dynamic visual insights with just a few clicks.
This dashboard includes 5 interactive dashboard pages, 1 data sheet, and 1 support sheet with pivot tables that power all the charts automatically. It tracks metrics like Total Budget, Total Actual Cost, Total Enrolled, Total Adverse Events, and Total Records across multiple therapeutic areas, phases, sponsors, and site locations.
 Clinical Trials Management Dashboard
🔑 Key Features of Clinical Trials Management Dashboard in Excel
📊 5 Interactive Dashboard Pages – Overview Page, Trial Analysis, Site Performance, Sponsor Review, and Timeline Trends for complete clinical trial analytics.
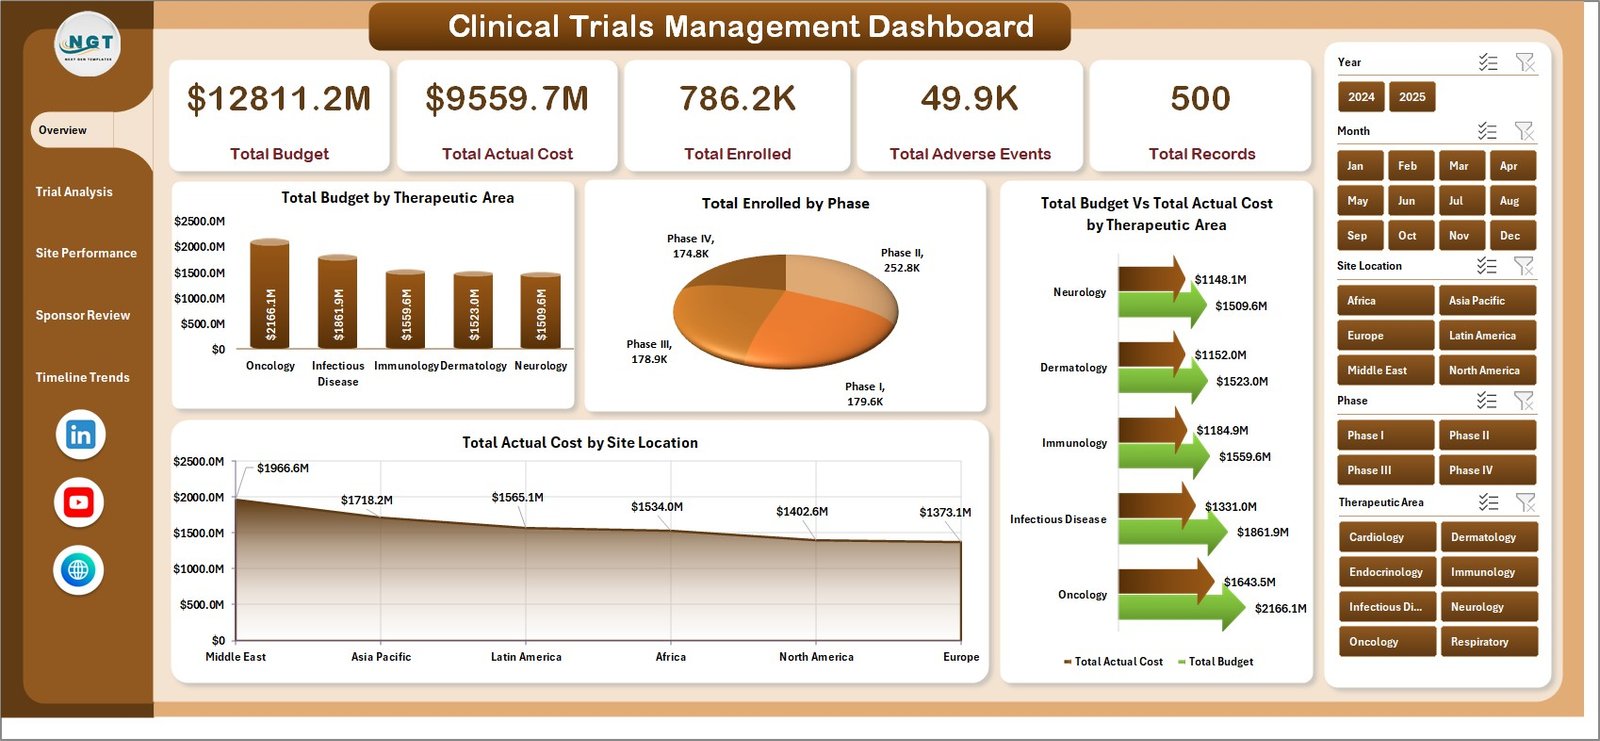
📈 Dynamic KPI Cards – Monitor Total Budget, Total Actual Cost, Total Enrolled, Total Adverse Events, and Total Records at a glance.
🎛️ Multiple Slicers for Quick Filtering – Apply filters instantly using slicers connected to therapeutic area, phase, sponsor, and site location.
🔄 Fully Automated with Pivot Tables – All charts are powered by pivot tables. Update your data and click Refresh All.
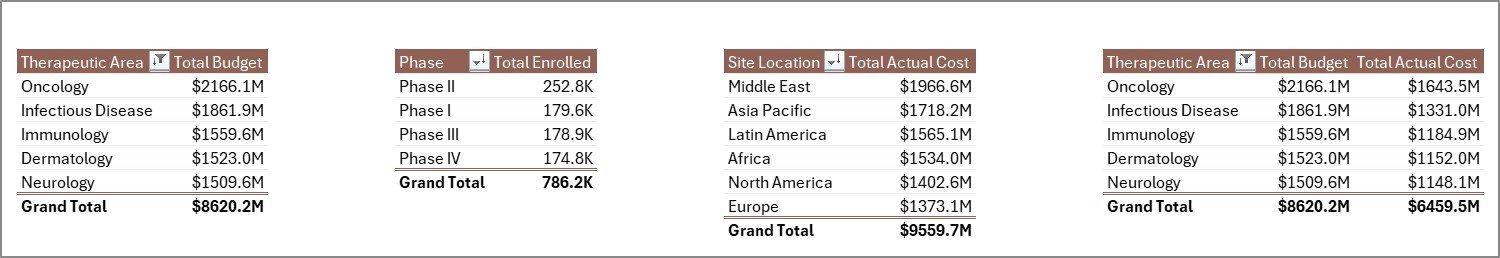
💰 Budget vs Actual Cost Analysis – Compare Total Budget against Total Actual Cost by therapeutic area and site location.
🌍 Multi-Dimensional Analysis – Analyze across therapeutic areas, trial phases, sponsors, site locations, countries, and months.
⚡ No VBA or Macros Required – Compatible with Excel 2016, 2019, 2021, and Microsoft 365.
📦 What’s Inside the Clinical Trials Management Dashboard in Excel
✅ Overview Page – 5 KPI cards with charts showing Total Budget by Therapeutic Area, Total Enrolled by Phase, Budget vs Actual Cost by Therapeutic Area, and Actual Cost by Site Location.
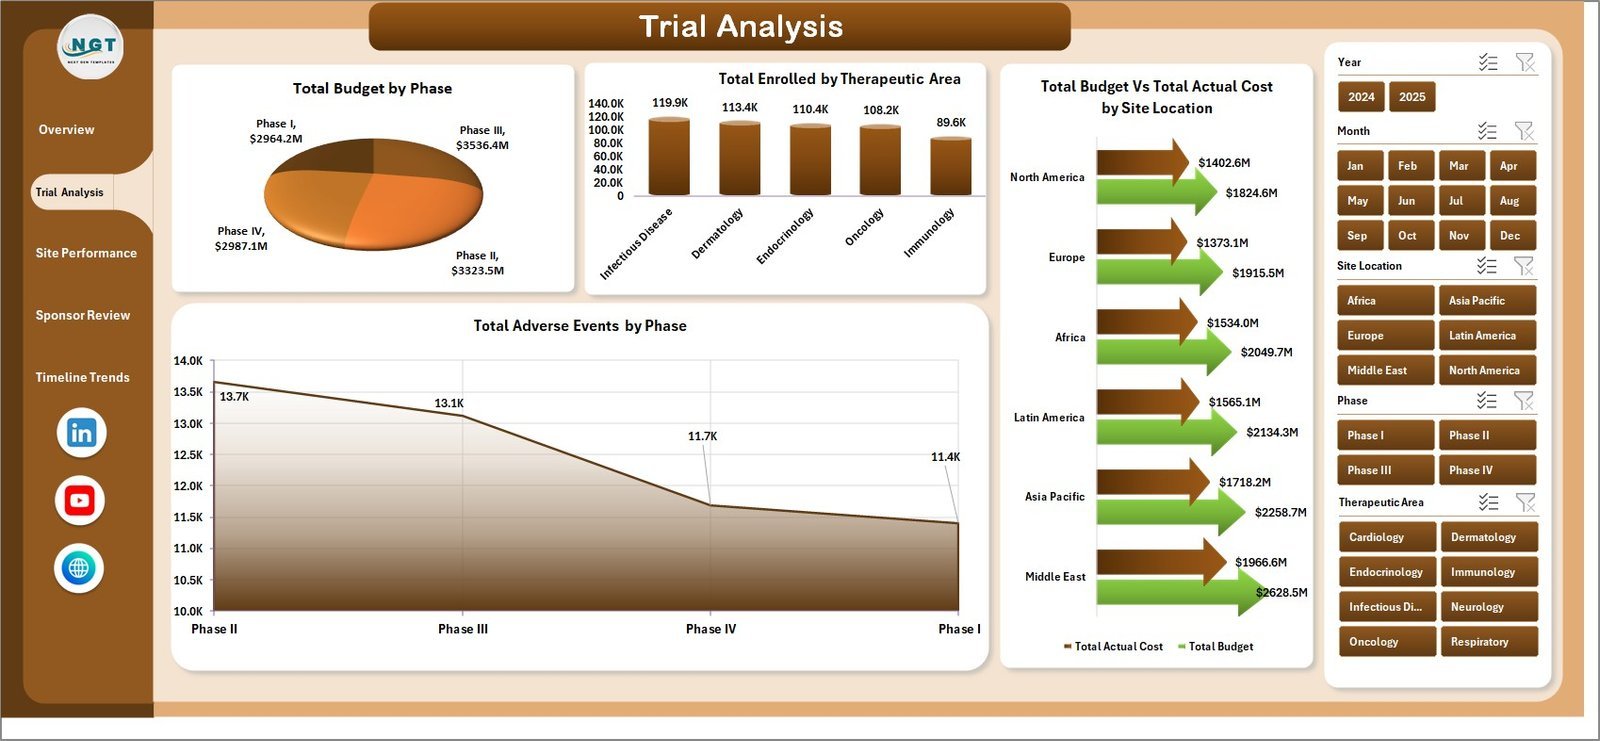
 Trial Analysis Page
✅ Trial Analysis Page – Total Budget by Phase, Total Enrolled by Therapeutic Area, Budget vs Actual Cost by Site Location, and Adverse Events by Phase.
 Site Performance Page
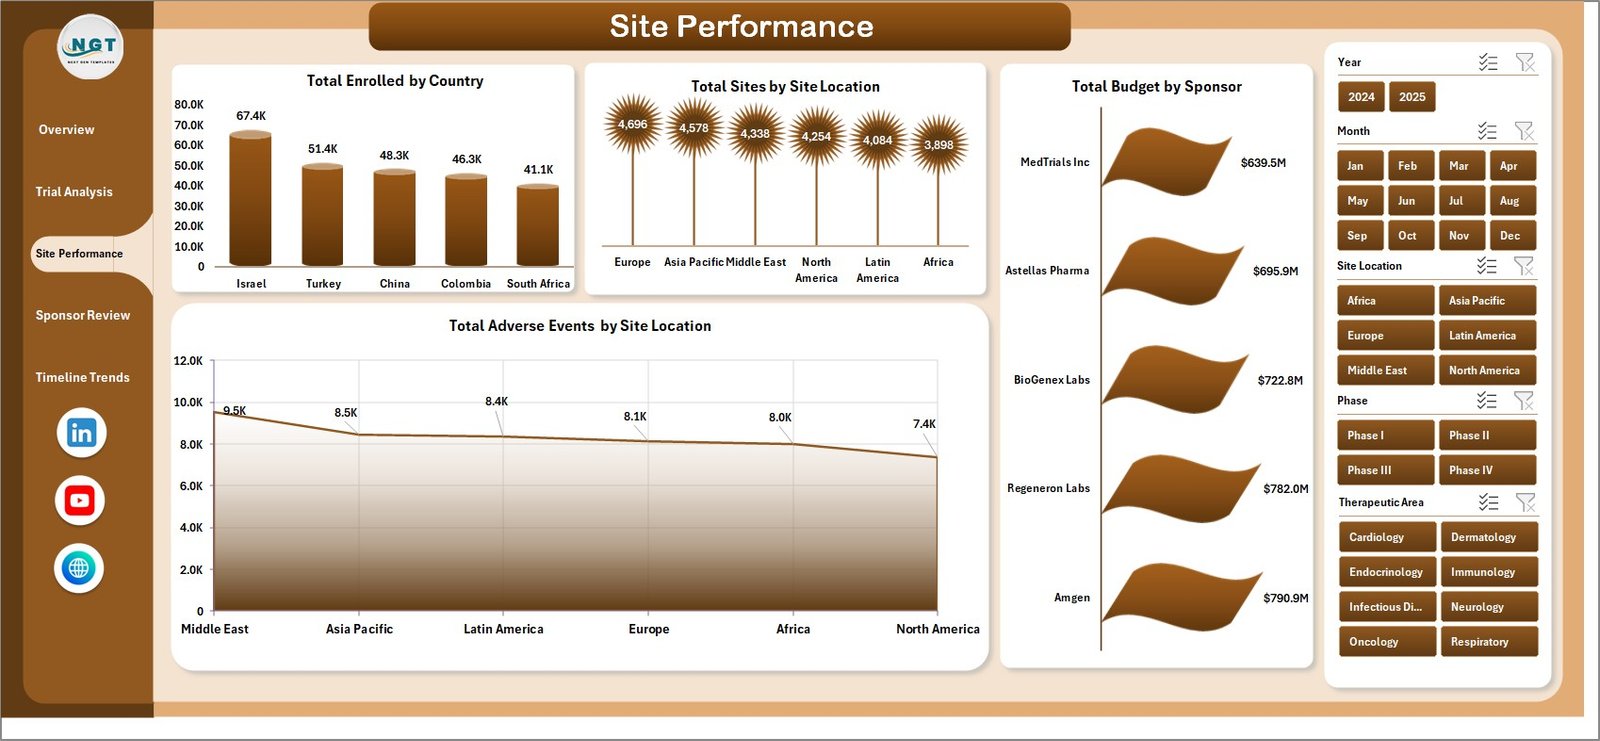
✅ Site Performance Page – Total Enrolled by Country, Total Sites by Site Location, Total Budget by Sponsor, and Adverse Events by Site Location.
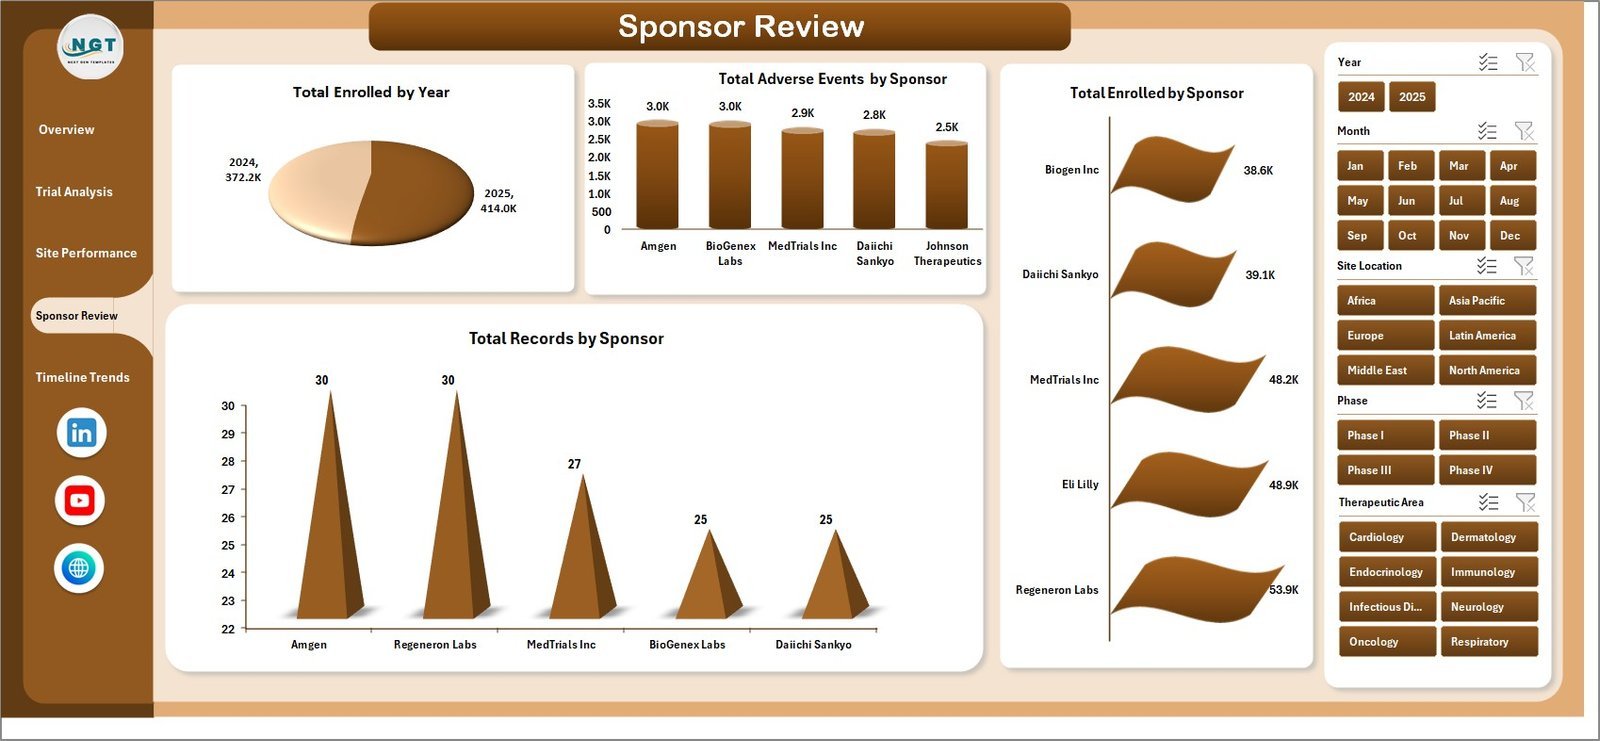
 Sponsor Review Page
✅ Sponsor Review Page – Total Enrolled by Year, Adverse Events by Sponsor, Enrolled by Sponsor, and Records by Sponsor.
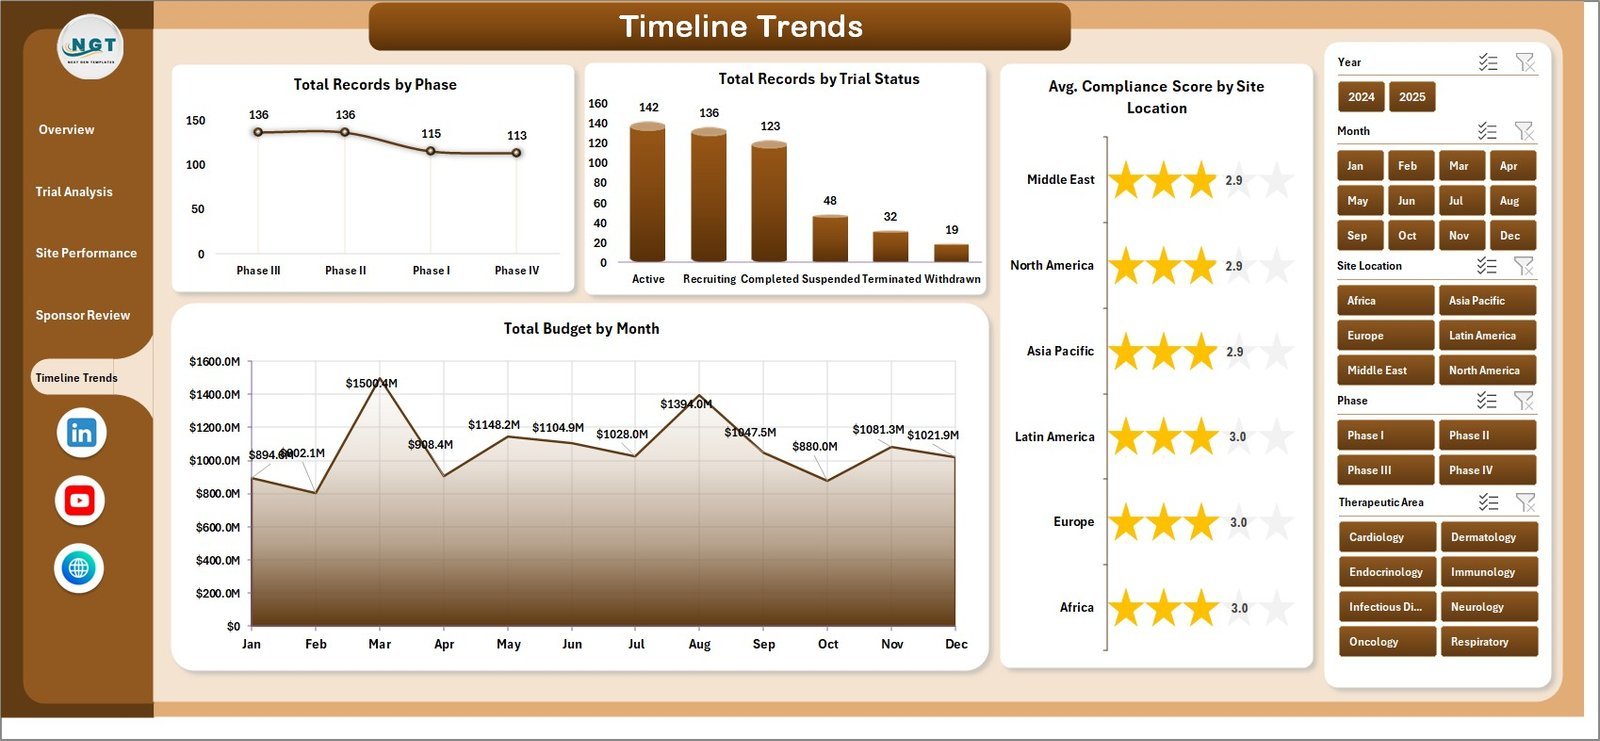
 Timeline Trends Page
✅ Timeline Trends Page – Records by Phase, Records by Trial Status, Avg. Compliance Score by Site Location, and Budget by Month.
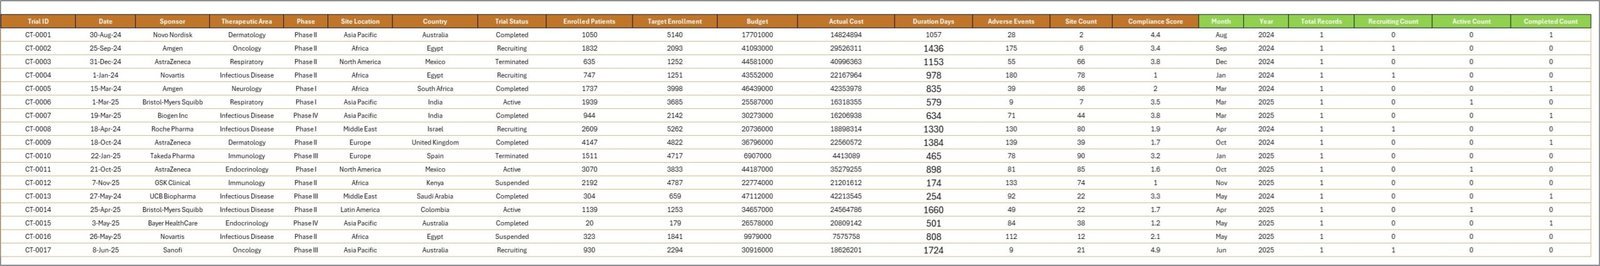
✅ Data Sheet – Enter your raw clinical trial data here. Dashboard updates automatically after refresh.
✅ Support Sheet – Pivot tables power the dashboard dynamically. Click Refresh All after updating data.
⚙️ How to Use the Clinical Trials Management Dashboard in Excel
1️⃣ Open the file in Microsoft Excel
2️⃣ Replace sample data with your clinical trial records
3️⃣ Click Refresh All in the Data tab
4️⃣ All 5 dashboard pages update automatically
5️⃣ Use slicers to filter by therapeutic area, phase, sponsor, site location
6️⃣ Analyze budgets, enrollment, adverse events, and trends
👥 Who Can Benefit
🔬 Clinical Trial Managers – Centralized trial performance view
💊 Pharmaceutical Companies – Track budgets, enrollment, adverse events
🏥 Healthcare Organizations – Multi-site research management
📊 Clinical Data Analysts – Interactive visual reports
🤝 CROs – Multi-sponsor trial tracking
📋 Quality Teams – Adverse events and compliance monitoring
❓ Frequently Asked Questions
What does this dashboard track?
It tracks Total Budget, Total Actual Cost, Total Enrolled, Total Adverse Events, and Total Records across therapeutic areas, phases, sponsors, site locations, countries, and months through 5 dashboard pages.
Do I need advanced Excel skills?
No. Replace sample data and click Refresh All. Everything updates automatically. No VBA or macros needed.
Can I customize it for my trials?
Yes. Add new therapeutic areas, phases, sponsors, and site locations. Pivot tables include new categories automatically.
How many pages are included?
5 dashboard pages plus a Data Sheet and Support Sheet with pivot tables.
Is it compatible with all Excel versions?
Yes. Works with Excel 2016, 2019, 2021, and Microsoft 365.
Can I use it for international trials?
Absolutely. Includes country-level analysis and site location breakdowns for multi-site management.
🔗 Explore Related Templates
📌 Clinical Trials Management KPI Dashboard in Power BI
📌 Gene Therapy KPI Dashboard in Excel
📌 Biotechnology Dashboard in Google Sheets
📖 Click here to read the Detailed Blog Post
🎥 Visit our YouTube channel to learn step-by-step video tutorials
👉 YouTube.com/@NextGenTemplates


Reviews
There are no reviews yet.