


Key Features of Carbon Capture Firms Dashboard in Power BI
Unlock powerful insights with the Carbon Capture Firms Dashboard in Power BI, a ready-to-use, dynamic dashboard designed specifically for tracking, analyzing, and visualizing carbon capture projects and firms. Simply update your data file, connect it with the Power BI file, and refresh to see your metrics updated instantly.
This comprehensive dashboard offers multiple interactive pages with detailed charts, slicers, and cards that enable quick filtering and deep analysis across various dimensions of carbon capture operations.
On the Overview Page, high-level cards display essential KPIs including Total Records, Capture Capacity, Efficiency Rating, Funding Raised, and Revenue. Key charts include:
- 🗺️ Operating Cost by Region: Visualizes cost distribution across different regions to identify high expenditure areas.
- 📊 Total Records by Project Phase: Tracks how many projects are in each development phase, helping prioritize focus.
- 🔬 Total Records by Technology Type: Breaks down projects by technology, showing the diversity and adoption rates.
- 💰 Operating Cost and Revenue by Technology Type: Compares costs and income generated per technology for profitability insights.
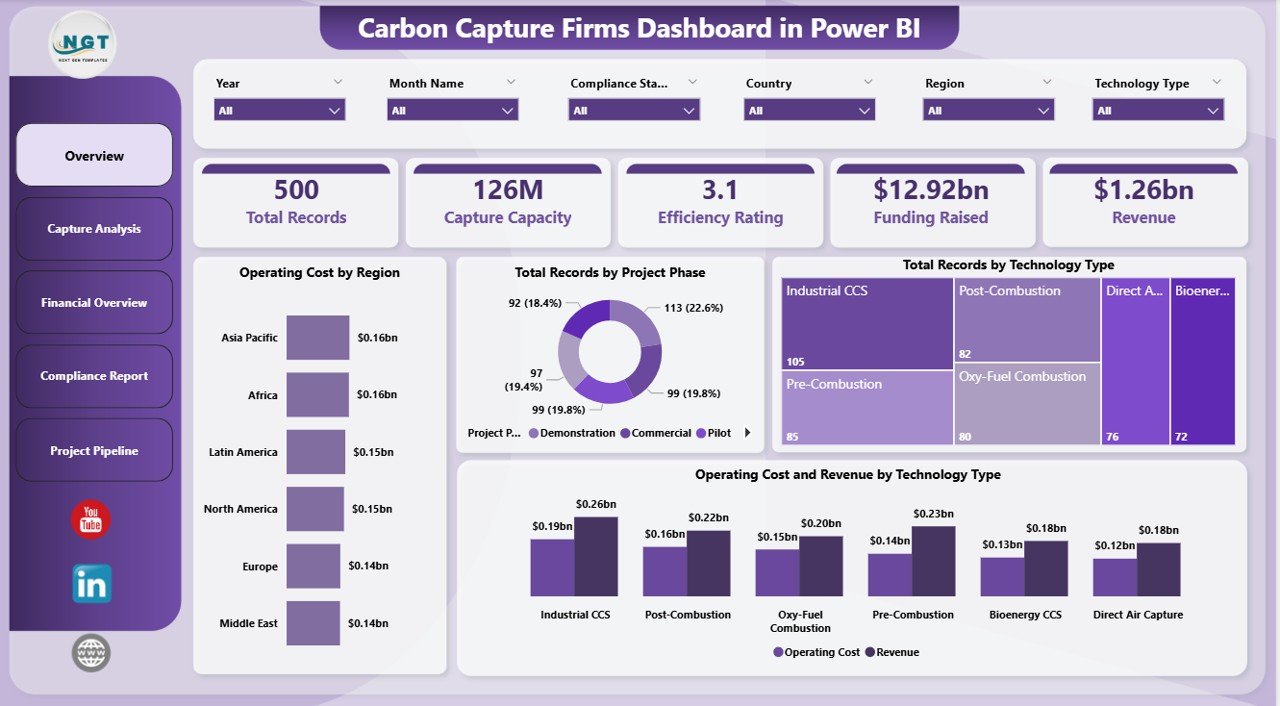
Carbon Capture Firms Dashboard in Power BI
What’s Inside the Carbon Capture Firms Dashboard in Power BI
This dashboard is segmented into five powerful tabs, each catering to specific analyses and insights:
1. Capture Analysis
- 🌍 CO2 Captured and Capture Capacity by Technology Type: Tracks performance of different technologies in carbon capture volume and capacity.
- 🏞️ CO2 Captured by Storage Method: Shows how captured CO2 is stored, highlighting the most effective methods.
- 📈 Capture Rate % by Region: Regional performance metrics for capture efficiency, helping identify top-performing areas.
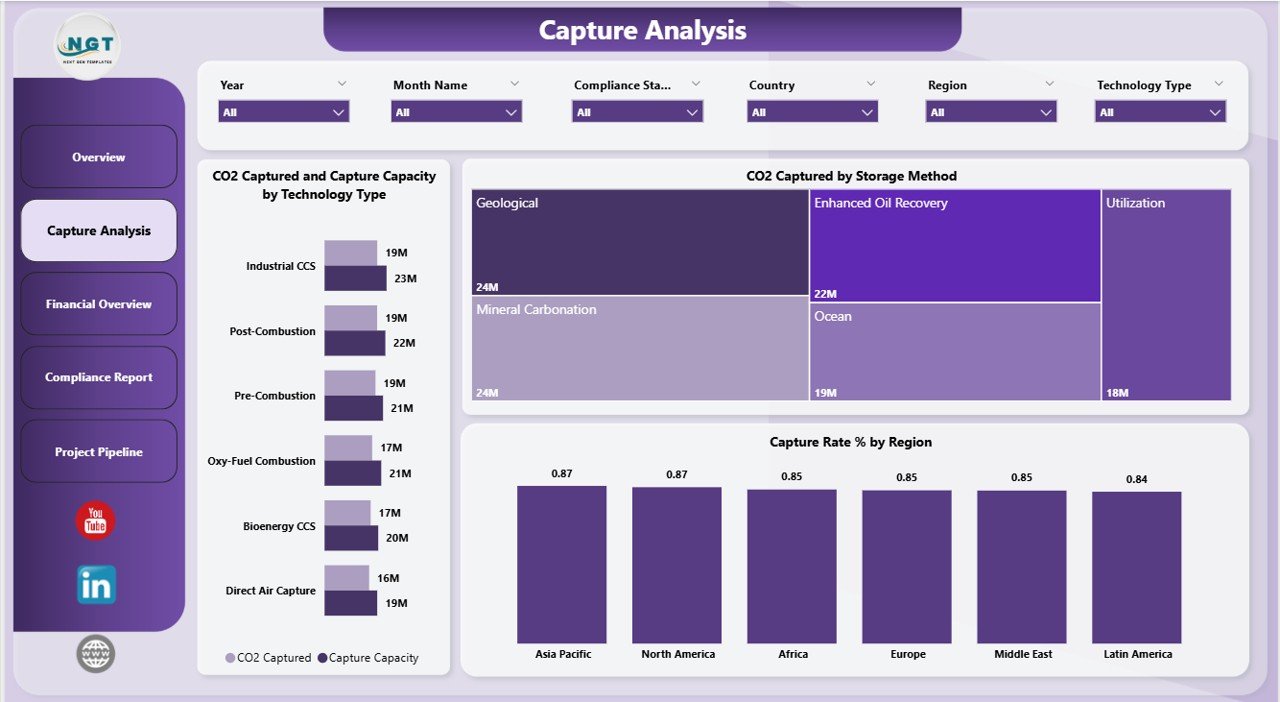
Capture Analysis
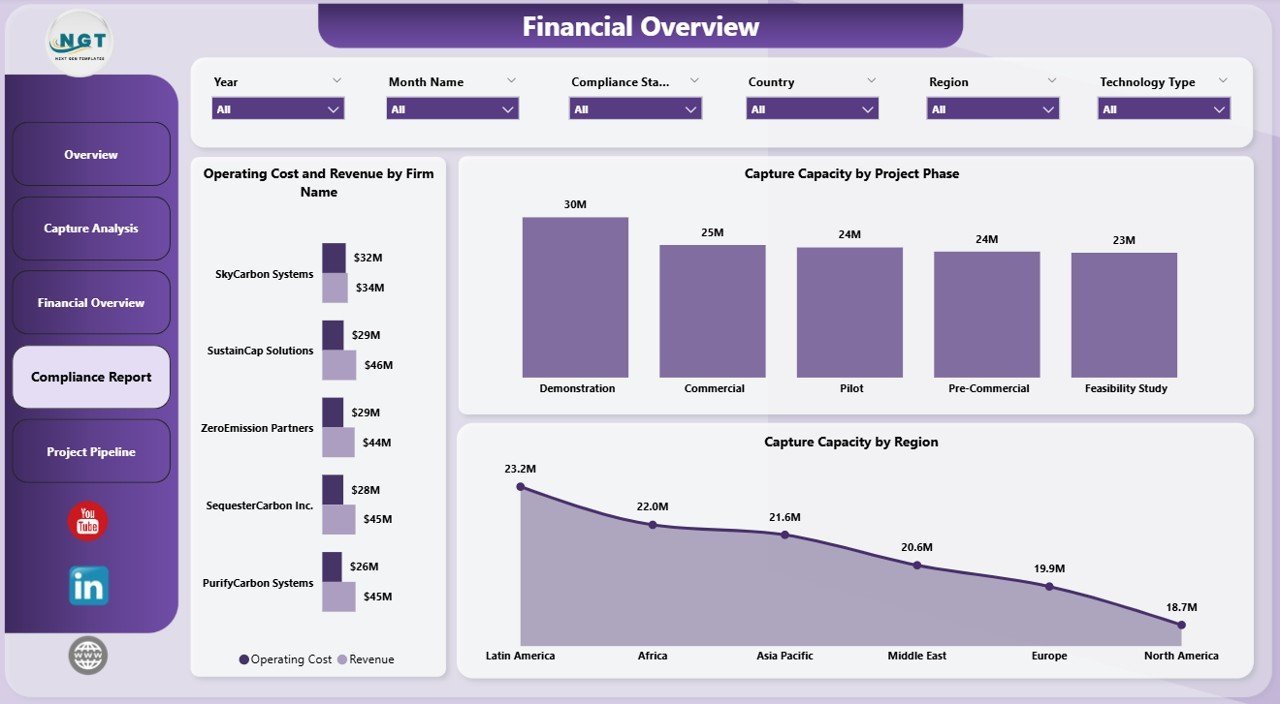
2. Financial Overview
- 💵 Operating Cost and Revenue by Region: Financial performance breakdown highlighting profitable regions.
- 📦 CO2 Captured by Storage Method: Financial impact of different storage techniques.
- 💰 Funding Raised by Region: Understand where investment is flowing to optimize funding strategies.
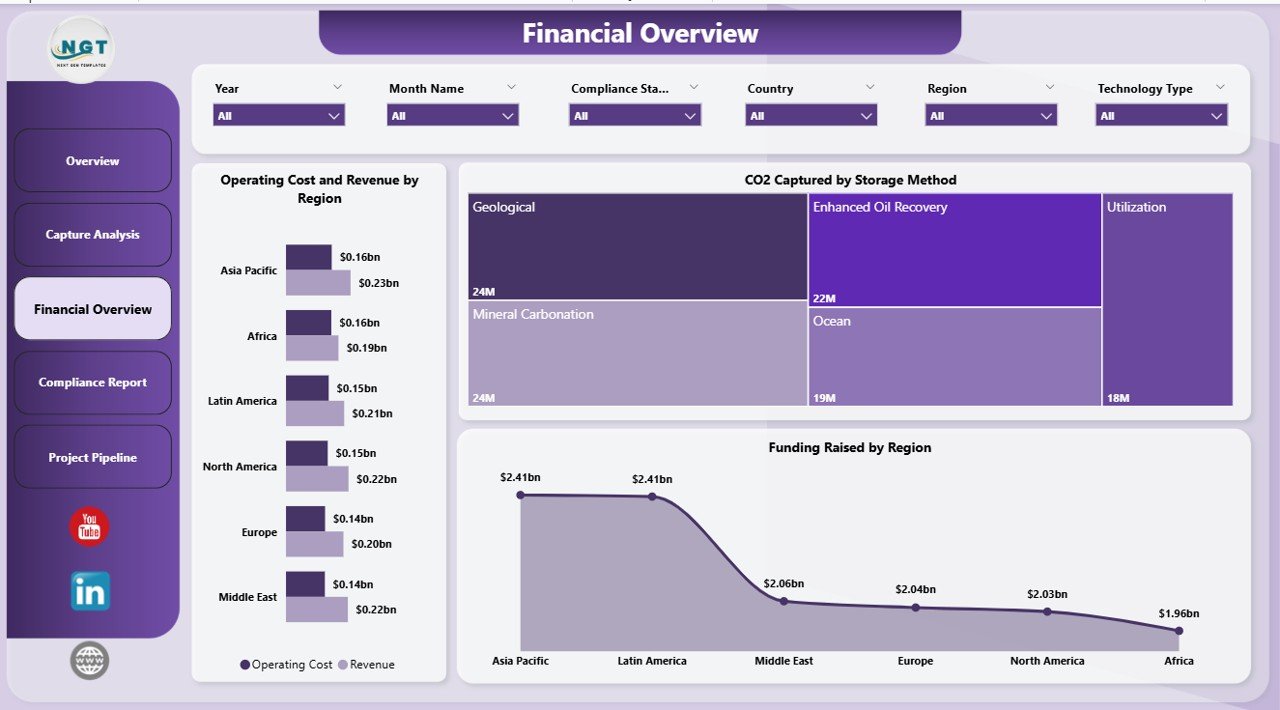
Financial Overview
3. Compliance Report
- 🏢 Operating Cost and Revenue by Firm Name: Firm-level financial tracking for compliance and budgeting.
- ⚙️ Capture Capacity by Project Phase: Monitoring capacity progress across project stages.
- 🗺️ Capture Capacity by Region: Regional compliance and capacity insights.
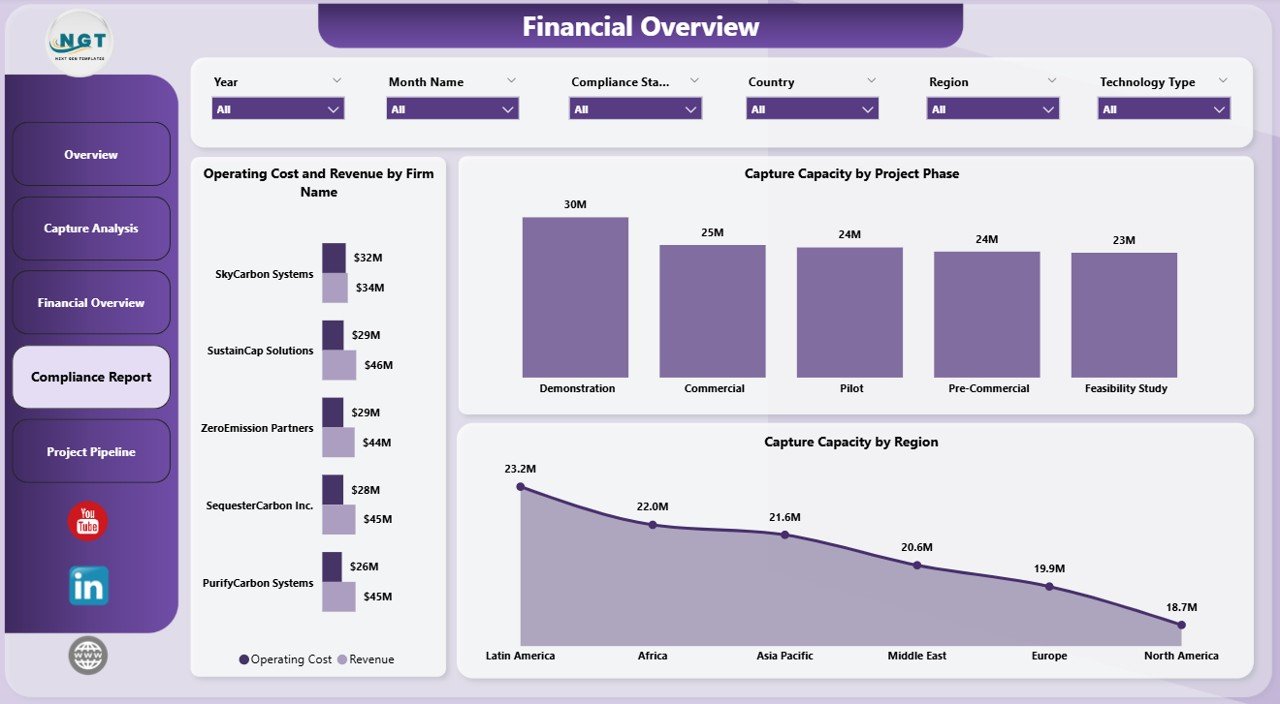
Compliance Report
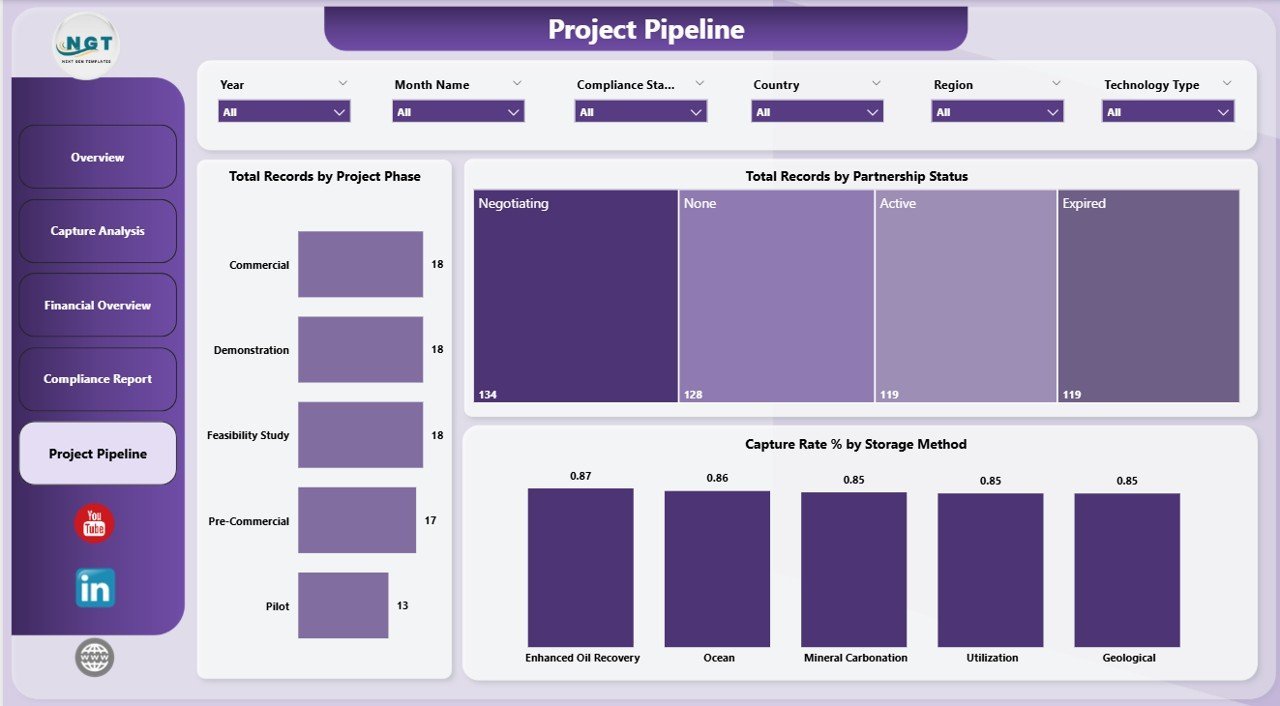
4. Project Pipeline
- 🚦 Total Records by Project Phase: Understand pipeline flow and project maturity.
- 🤝 Total Records by Partnership Status: Track collaborations and partnerships status to boost strategic alliances.
- ⚡ Capture Rate % by Storage Method: Efficiency rates segmented by storage techniques.

Project Pipeline
How to Use the Carbon Capture Firms Dashboard in Power BI
Getting started is simple! Just update the provided data file with your latest project data and connect it to the Power BI dashboard file. Then, click the Refresh button from the Home tab in Power BI, and all the charts, slicers, and cards will automatically update to reflect your current data.
The dashboard’s interactive slicers allow you to filter data by region, technology type, project phase, and more – enabling you to drill down into specific areas of interest quickly.
This plug-and-play setup saves you hours of manual reporting and empowers you with instant, actionable insights to make informed business decisions.
Who Can Benefit from This Carbon Capture Firms Dashboard in Power BI
Whether you’re a carbon capture project manager, environmental analyst, investor, or policy maker, this dashboard is tailored to meet your needs:
- 📊 Project Managers: Easily track project progress, capacity, and efficiency across phases.
- 💼 Business Executives: Gain financial visibility into costs, revenues, and funding.
- 🔍 Analysts: Perform in-depth capture and compliance analyses effortlessly.
- 🌱 Environmental Consultants: Monitor storage methods and regional performance for sustainability reporting.
- 📈 Investors: Identify promising technologies and regions for potential investments.
This dashboard is a must-have digital tool that streamlines data analysis and reporting in the rapidly growing carbon capture industry.
Click here to read the Detailed blog post.
Visit our YouTube channel to learn step-by-step video tutorials.


Reviews
There are no reviews yet.