Running an auction platform in today’s fast-paced digital economy means handling massive volumes of data every single day. From listings and bids to revenue, GMV, and seller activity—everything needs to be tracked efficiently. However, when this data is scattered across multiple spreadsheets, it becomes difficult to identify trends and make smart decisions.
That’s exactly where the Auction Tech Platforms Dashboard in Excel comes in 💡
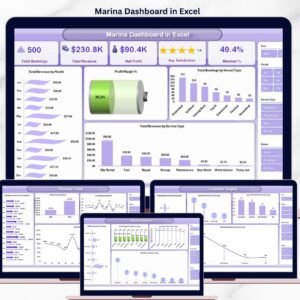
This ready-to-use and fully interactive dashboard helps you track, analyze, and optimize your auction platform in one place. Moreover, it transforms complex data into easy-to-understand visuals, KPI cards, and dynamic charts. Therefore, you can quickly uncover insights, improve performance, and increase your revenue.
Whether you run an online auction marketplace, B2B trading platform, or digital bidding system, this dashboard empowers you to make faster and smarter decisions.
📊 Key Features of Auction Tech Platforms Dashboard in Excel
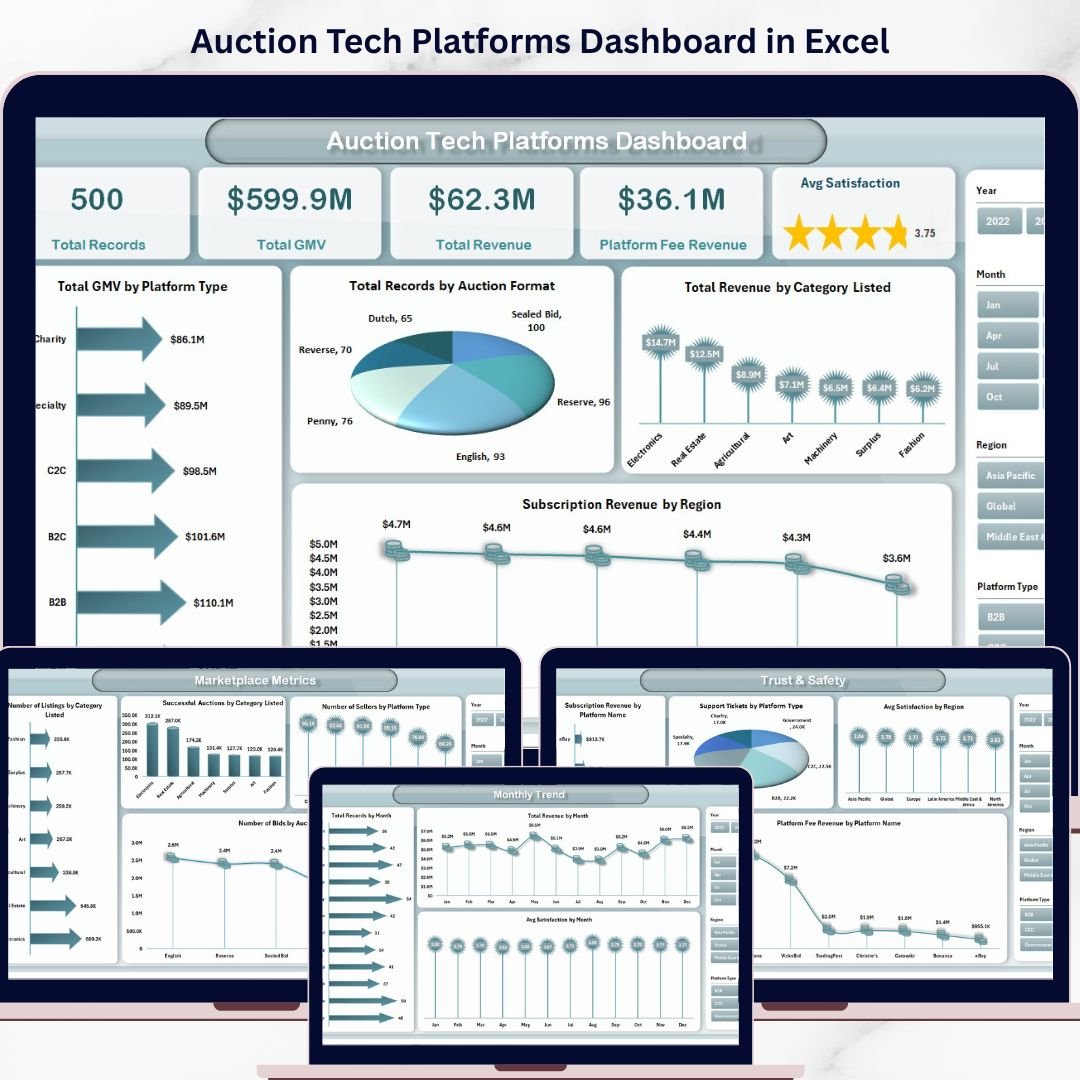
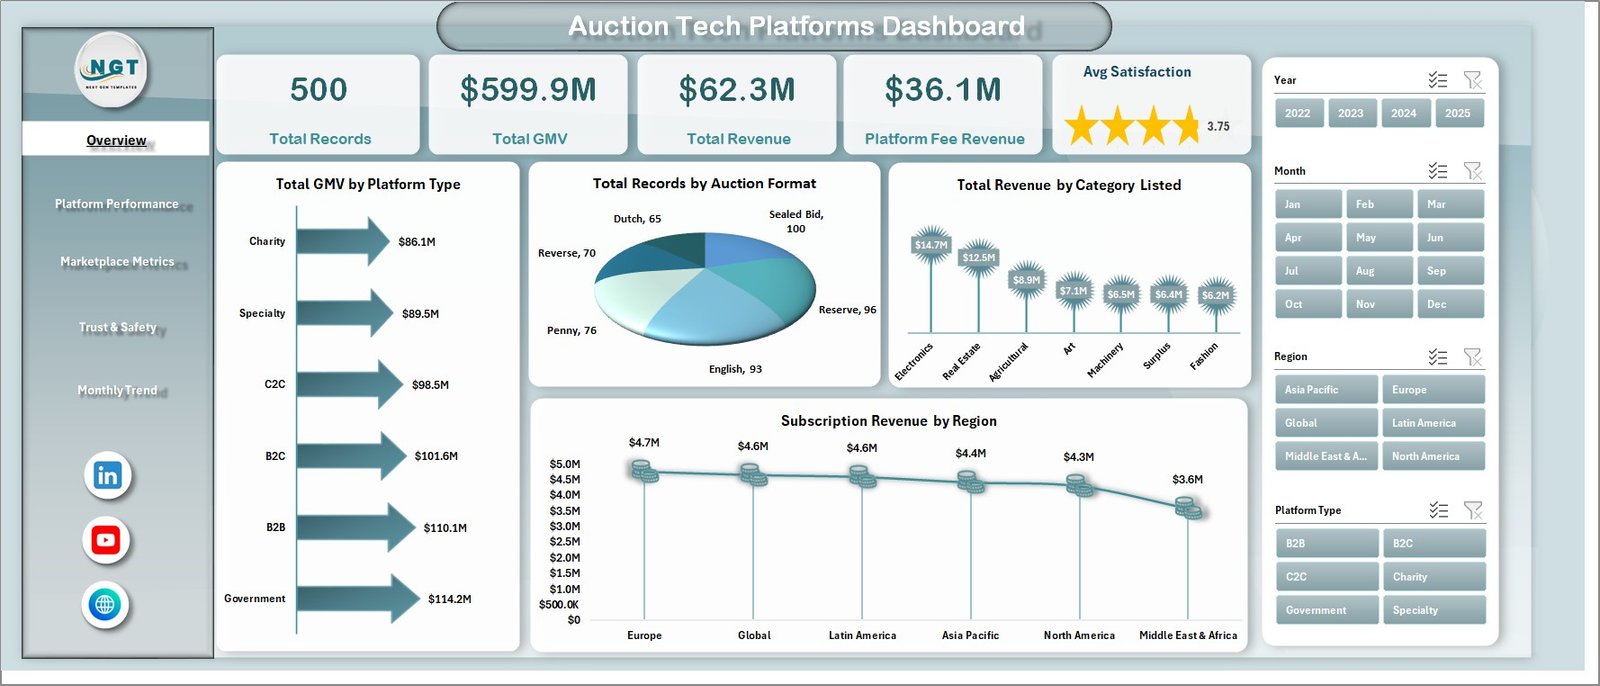
📊 Complete Business Overview – Track GMV, revenue, platform fees, and satisfaction in one place.
📈 5 Interactive Dashboard Pages – Analyze performance across multiple business dimensions.
💰 Revenue & GMV Tracking – Monitor financial performance and identify growth opportunities.
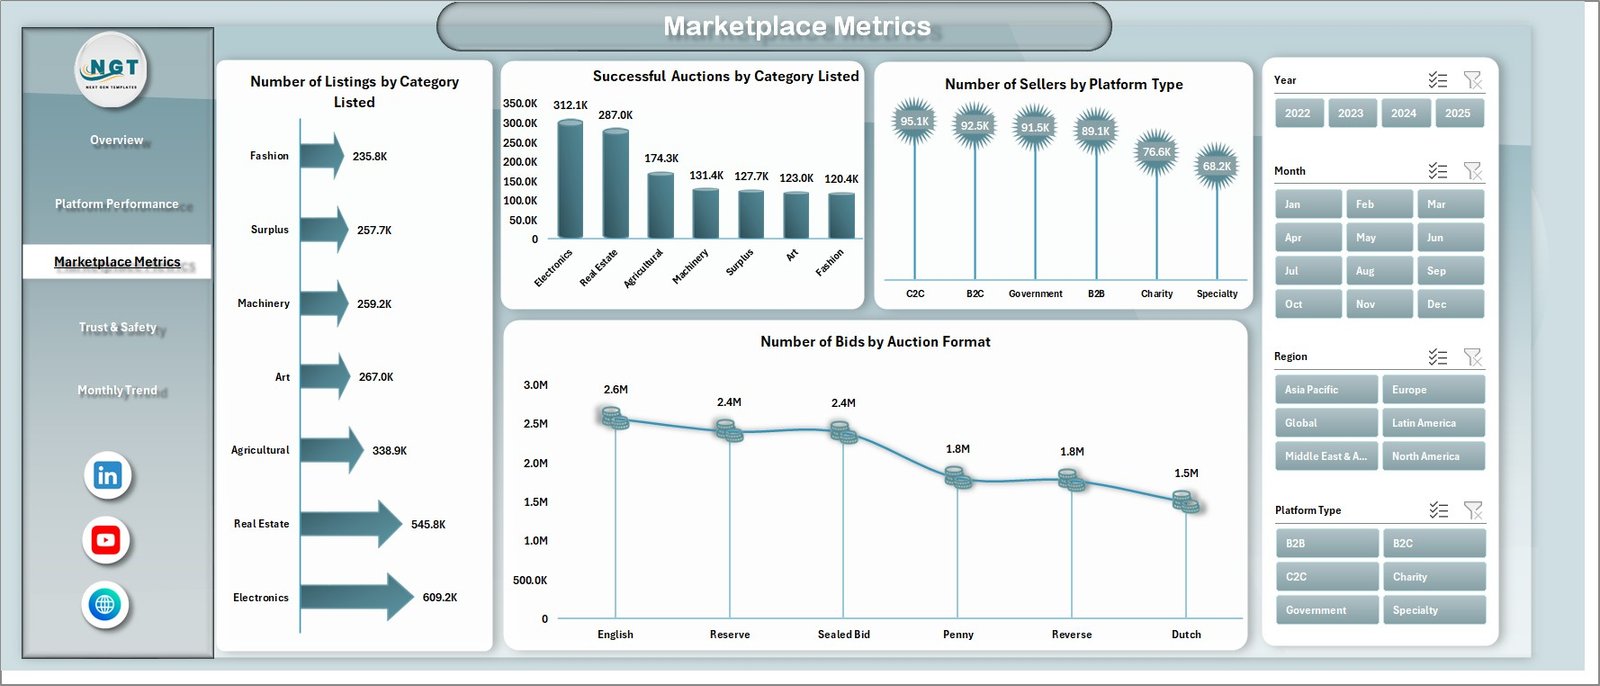
📦 Marketplace Activity Insights – Track listings, bids, and seller engagement.
🎯 Dynamic Filters (Slicers) – Drill down into specific categories, platforms, and formats.
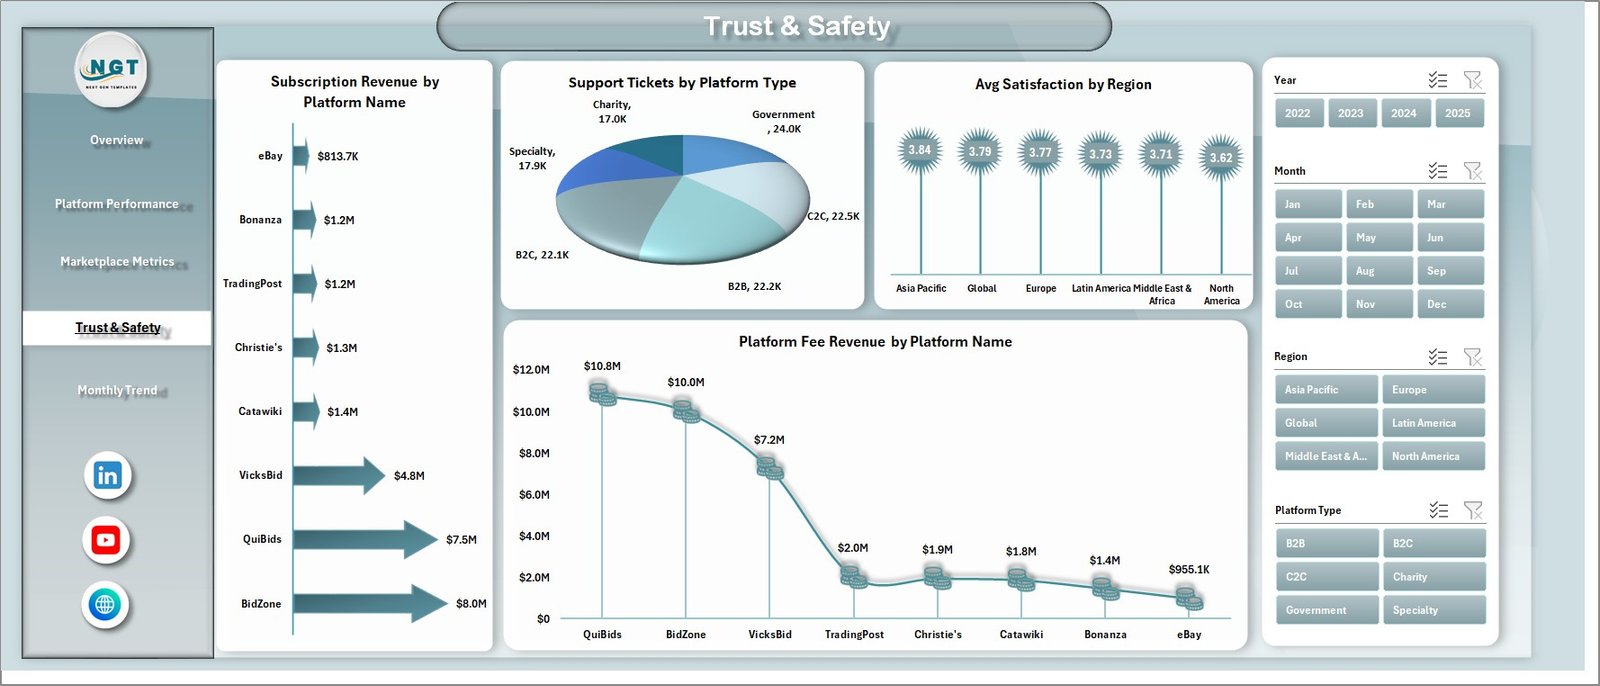
📉 Trust & Safety Metrics – Monitor support tickets, satisfaction, and platform reliability.
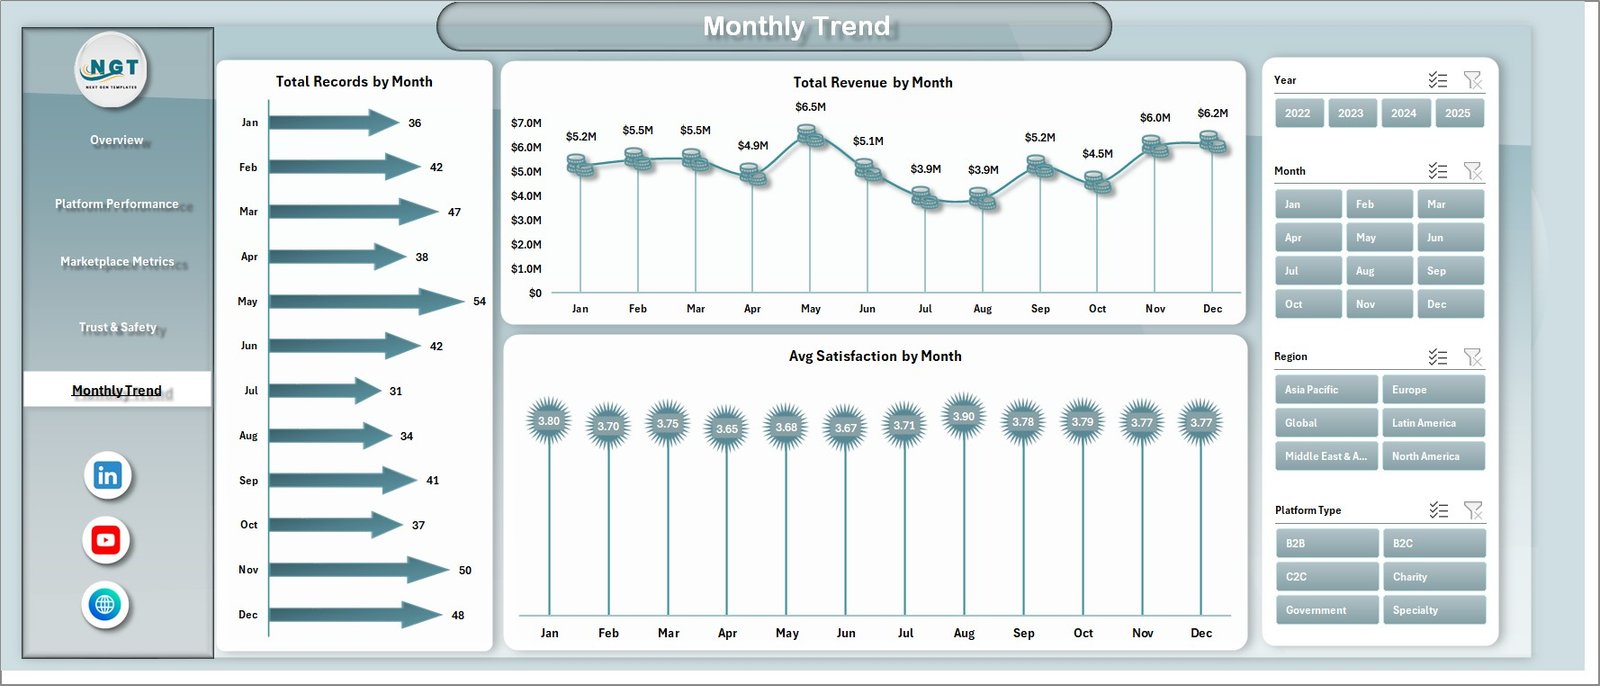
📅 Monthly Trend Analysis – Identify seasonal patterns and growth trends easily.
⚡ Automatic Dashboard Updates – Just update data and the dashboard refreshes instantly.
🧩 Fully Customizable Template – Modify based on your platform needs.
📂 What’s Inside the Auction Tech Platforms Dashboard in Excel
📊 Overview Page – Get a quick snapshot of GMV, revenue, platform fees, and satisfaction.
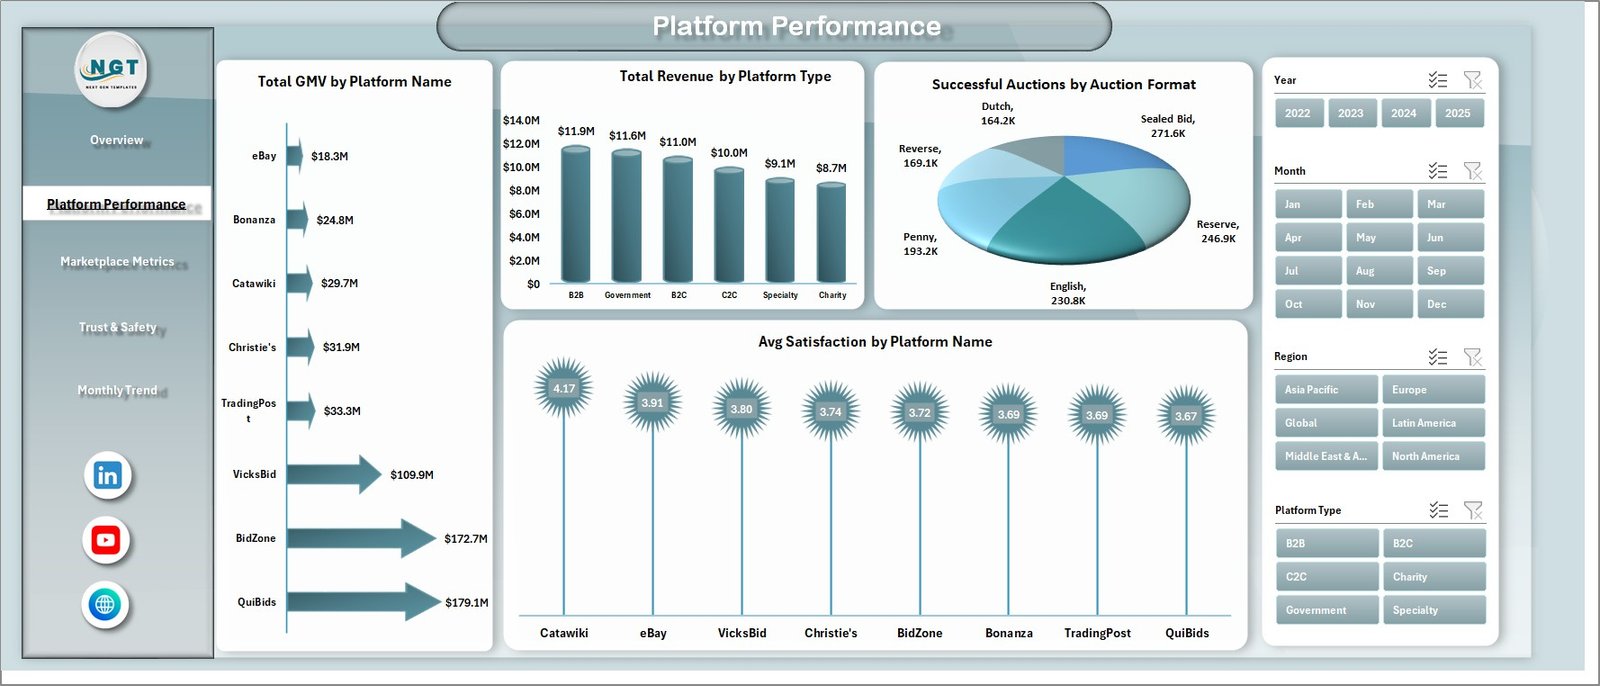
📊 Platform Performance Page – Analyze performance across different auction platforms.
📊 Marketplace Metrics Page – Track listings, bids, sellers, and auction activity.
📊 Trust & Safety Page – Monitor support tickets, satisfaction, and reliability metrics.
📊 Monthly Trends Page – Analyze performance over time with monthly insights.
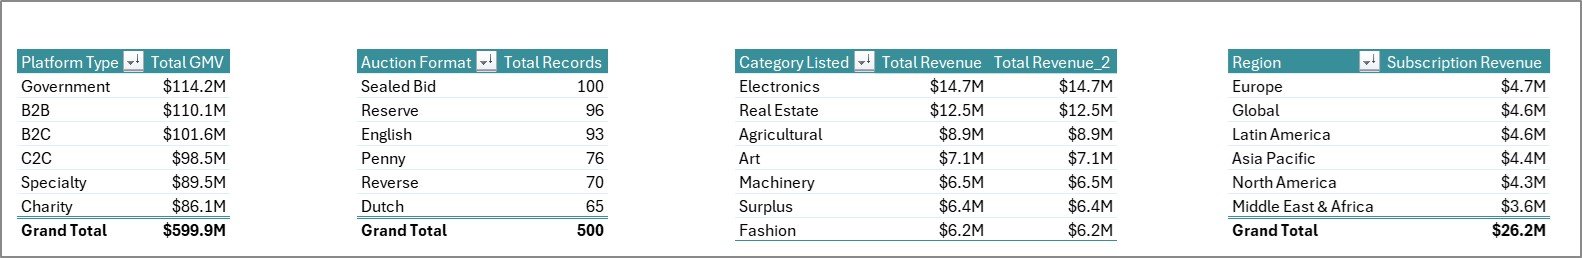
📁 Data Sheet – Enter all your raw data in one structured place.
⚙️ Support Sheet – Manage backend settings and dropdowns for smooth functionality.
🛠️ How to Use the Auction Tech Platforms Dashboard in Excel
1️⃣ Enter Your Data – Input auction records, revenue, and platform details into the Data Sheet.
2️⃣ Automatic Refresh – The dashboard updates instantly without manual work.
3️⃣ Use Filters – Apply slicers to analyze specific segments or categories.
4️⃣ Analyze Insights – Review KPIs and charts to identify trends.
5️⃣ Take Action – Optimize performance, improve engagement, and increase revenue.
🎯 Who Can Benefit from This Auction Tech Platforms Dashboard in Excel
🛒 Online Auction Platforms
🌐 Marketplace Businesses
🏢 B2B Trading Platforms
📦 E-commerce Auction Sites
💻 Digital Marketplace Operators
👉 In short, any business running auctions or bidding platforms can use this dashboard to improve performance and scale faster.
🚀 Why This Dashboard is a Must-Have
Instead of guessing performance, this dashboard gives you clear, data-driven insights. As a result, you can improve decision-making, boost revenue, and optimize your platform operations effortlessly.
📖 Click hare to read the Detailed blog post
🎥 Visit our YouTube channel to learn step-by-step video tutorials
👉 https://www.youtube.com/@PKAnExcelExpert