Take control of your crypto and blockchain data with the Blockchain Finance Dashboard in Excel 🚀. In today’s fast-evolving financial world, thousands of transactions happen every second across multiple blockchain networks. However, managing and analyzing this data manually can quickly become overwhelming.
That’s where this powerful and ready-to-use dashboard becomes a game-changing solution.
It transforms complex blockchain data into clear visuals, actionable insights, and structured reports—all in one place. As a result, you can track transactions, analyze risks, monitor wallet performance, and make faster, smarter financial decisions.
🚀 Key Feature of Blockchain Finance Dashboard in Excel
✅ 📊 Interactive Excel Dashboard
Visualize blockchain data using dynamic charts and slicers.
✅ 📈 Complete KPI Tracking
Track transactions, gas fees, risk scores, and wallet performance.
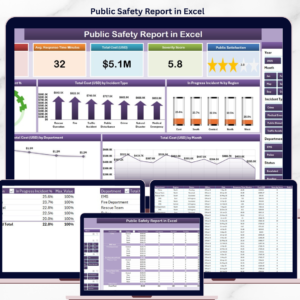
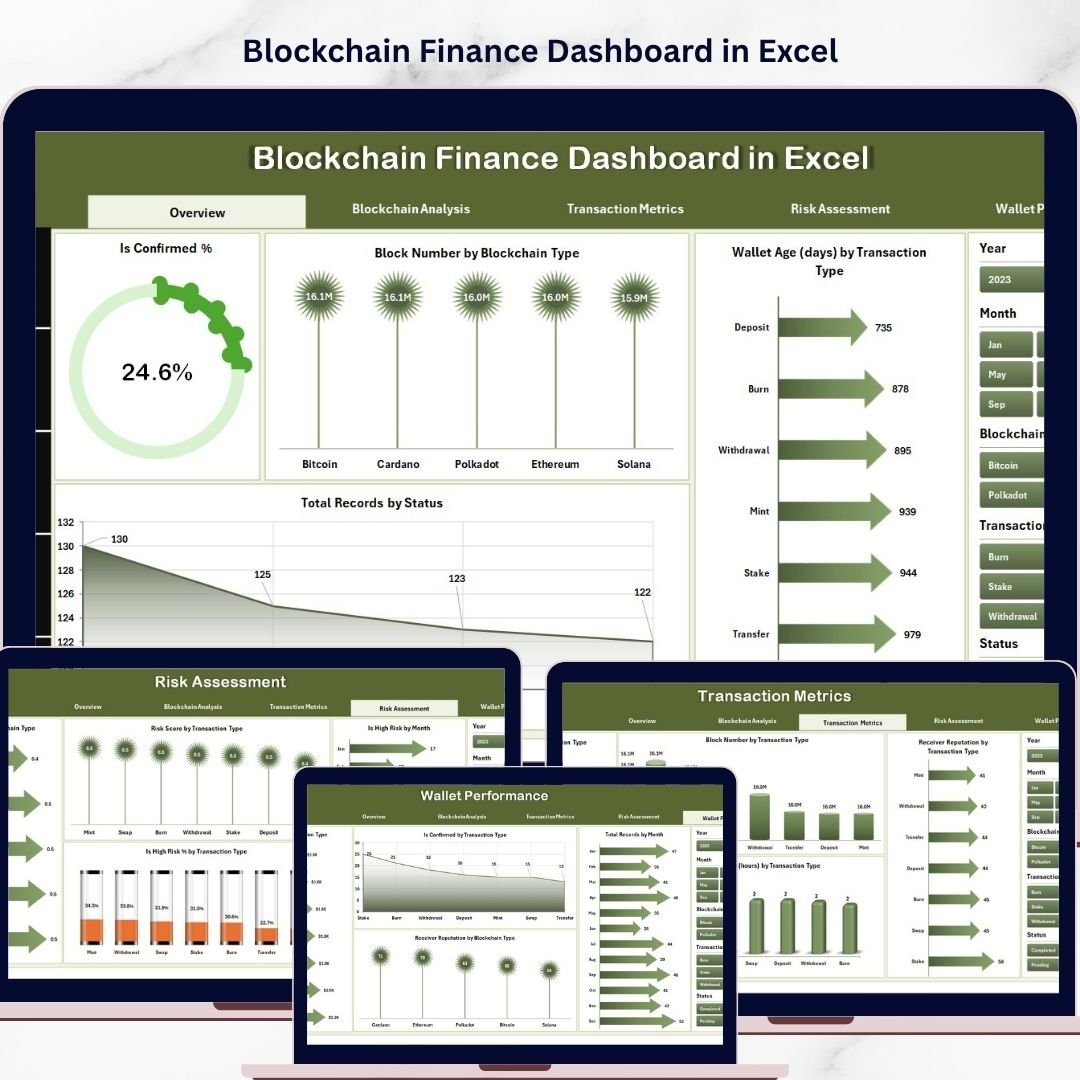
✅ 📅 Multi-Page Analytical Dashboard
Explore insights across 5 structured analytical pages.
✅ 🔍 Smart Filtering with Slicers
Filter data instantly for customized blockchain analysis.
✅ ⚠️ Risk Assessment Insights
Identify high-risk transactions and reduce financial risks.
✅ 👛 Wallet Performance Monitoring
Analyze wallet behavior and efficiency.
✅ 📂 Organized Data Structure
Separate Data and Support sheets for smooth functionality.
📦 What’s Inside the Blockchain Finance Dashboard in Excel
This template includes 5 powerful analytical pages:
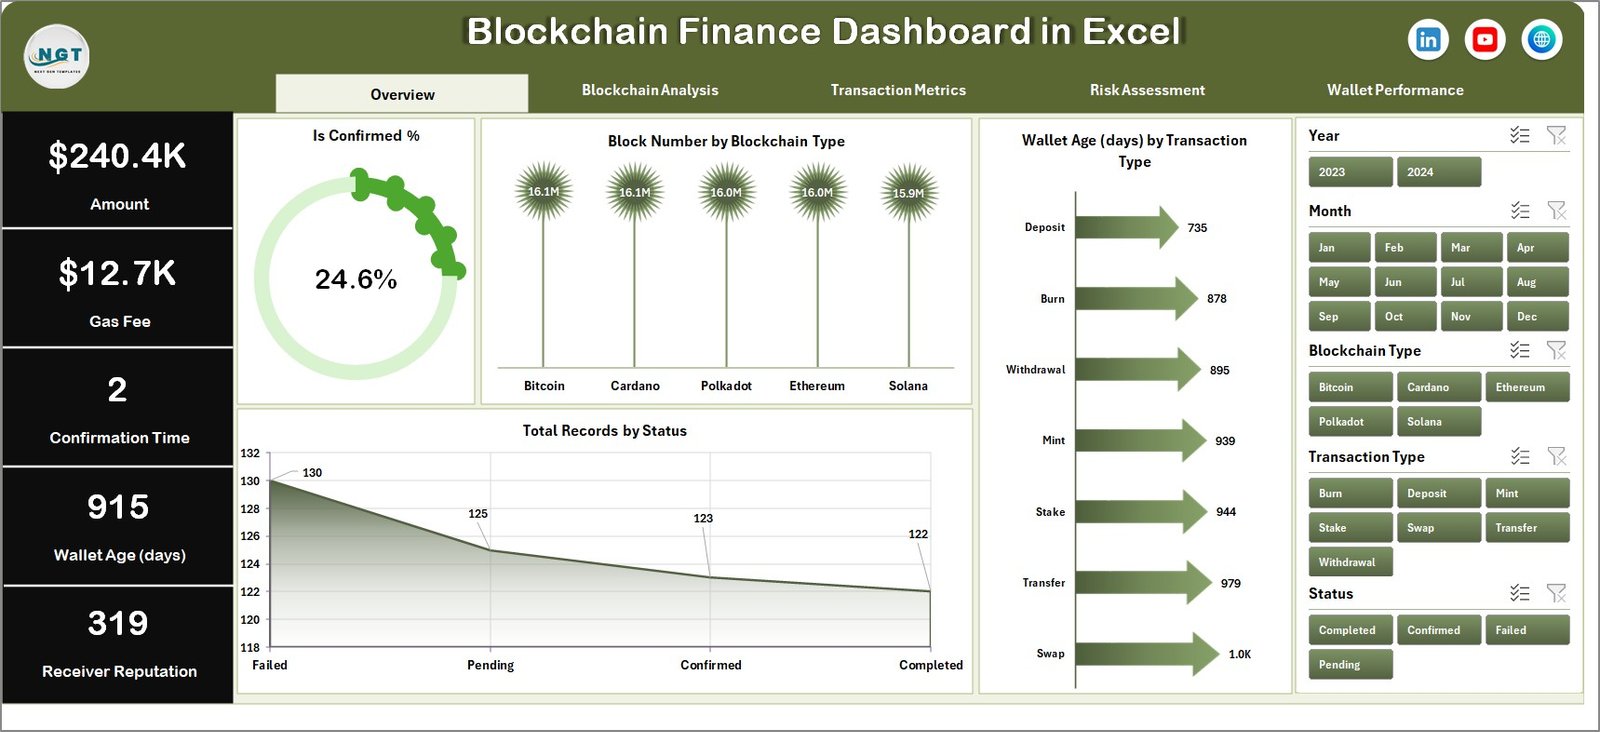
📊 Overview Page – Snapshot of blockchain KPIs with charts and filters
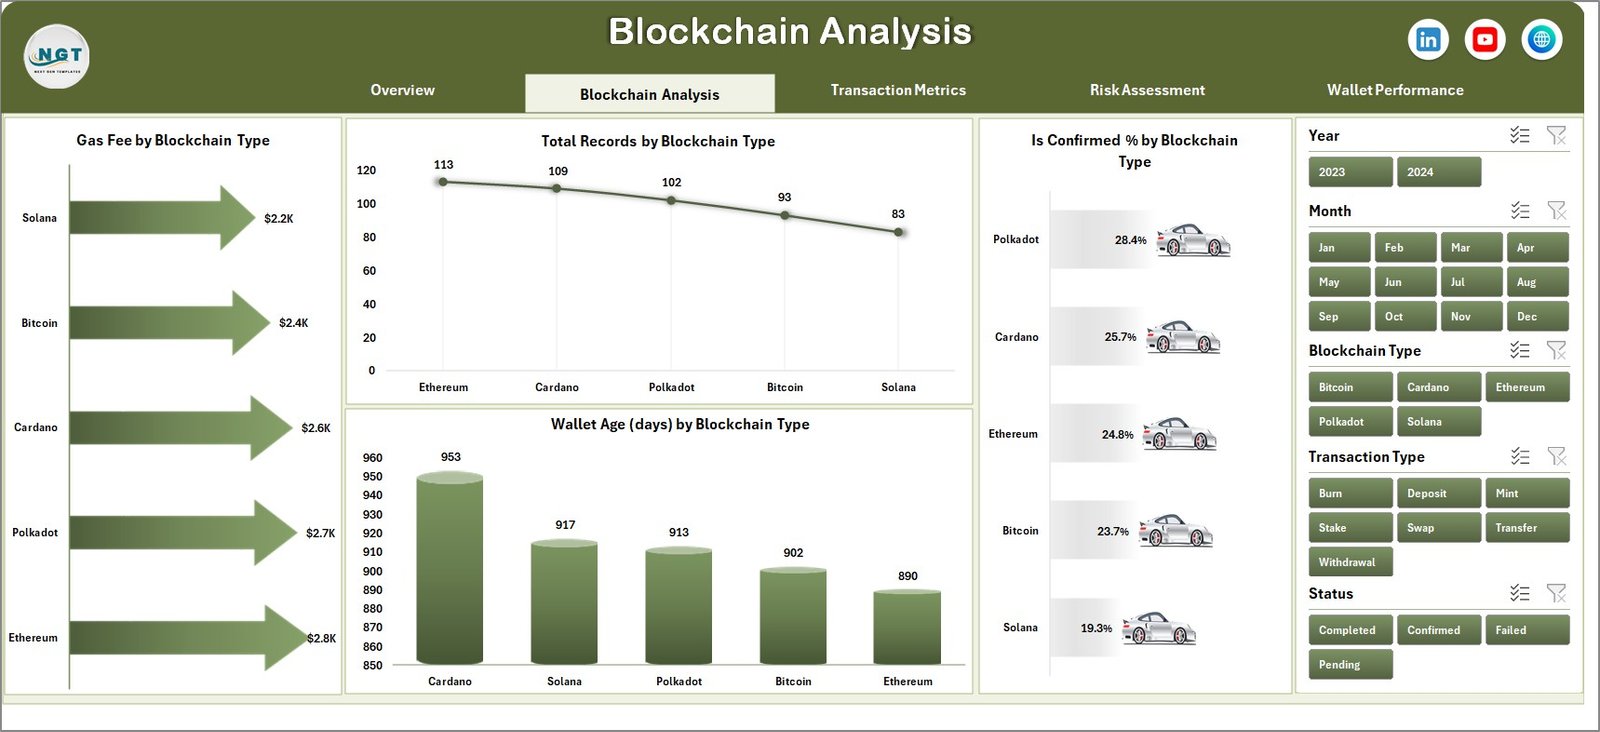
🔗 Blockchain Analysis – Compare performance across networks
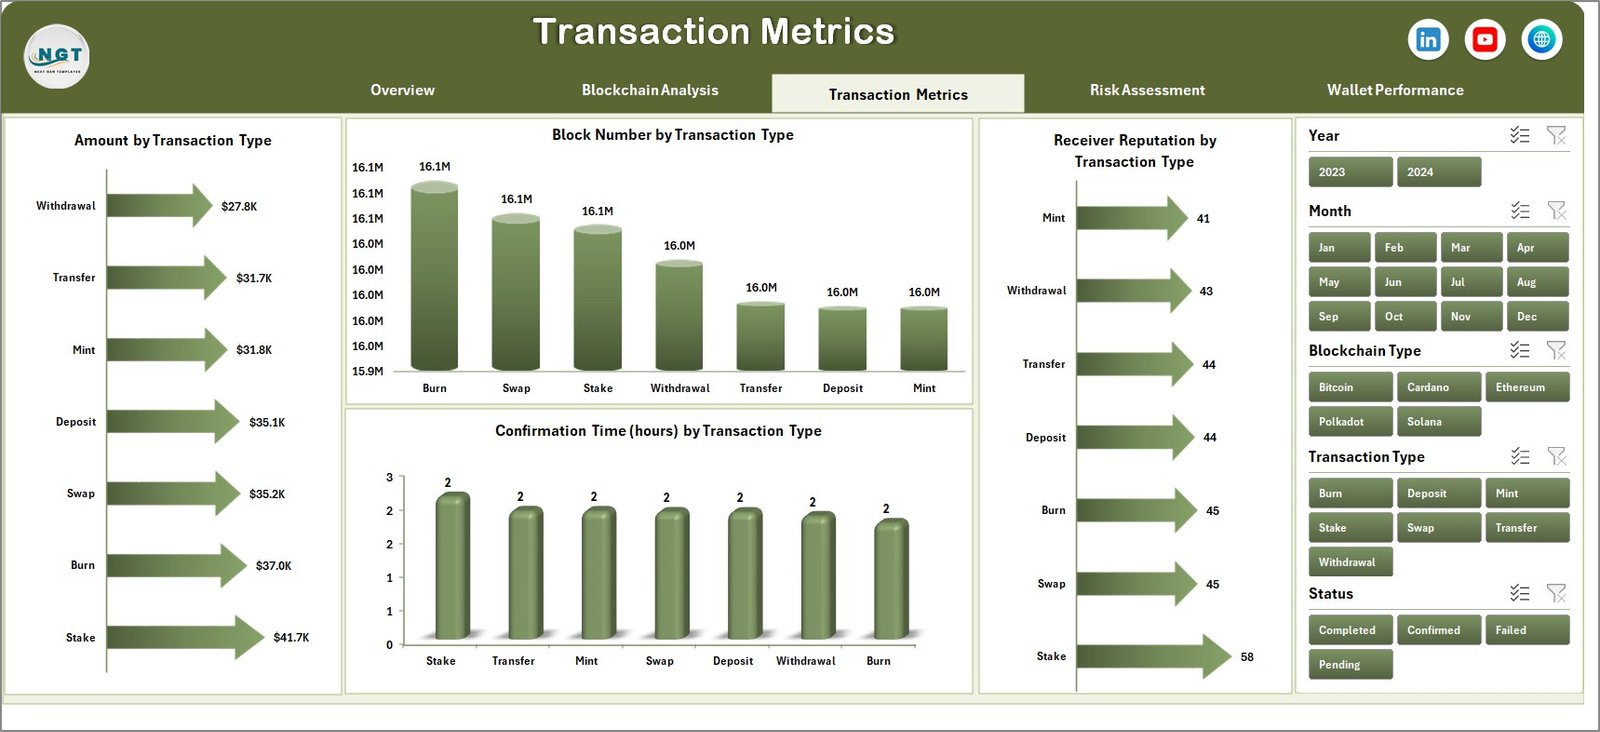
💱 Transaction Metrics – Analyze transaction-level data
⚠️ Risk Assessment Page – Identify high-risk activities
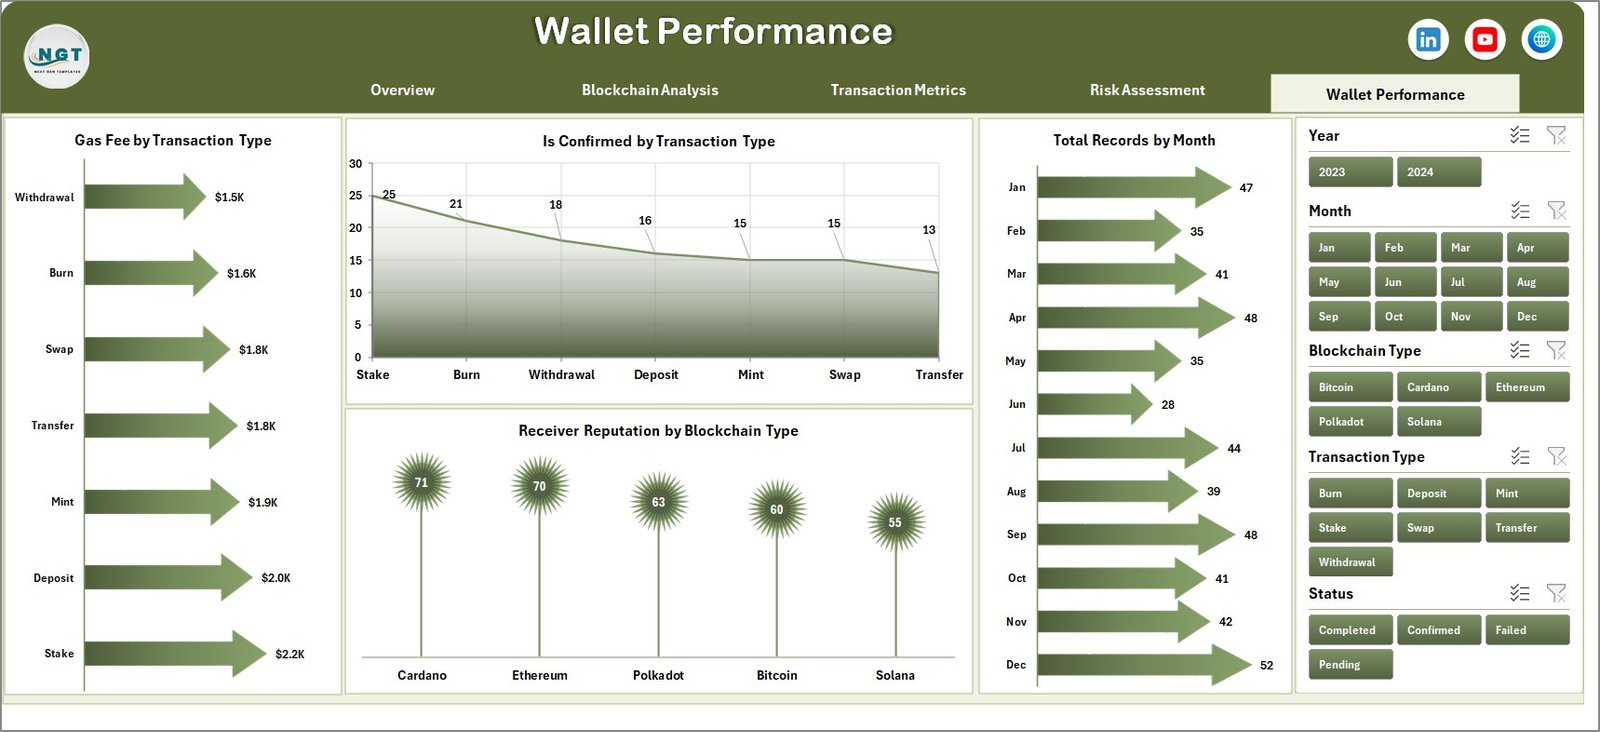
👛 Wallet Performance Page – Track wallet behavior and efficiency
📂 Additional Sheets:
-
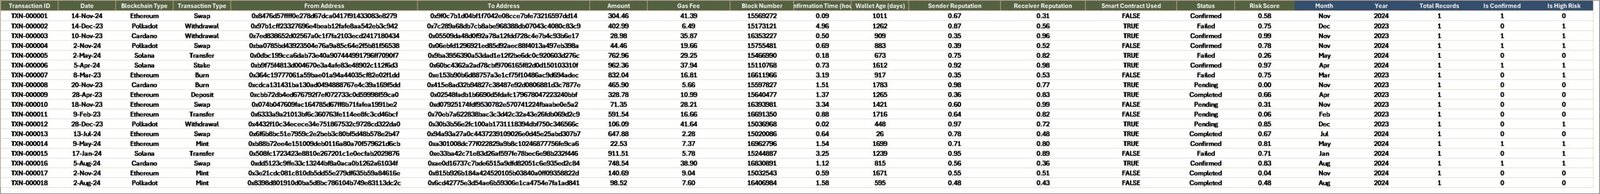
Data Sheet – Stores raw blockchain transaction data
-
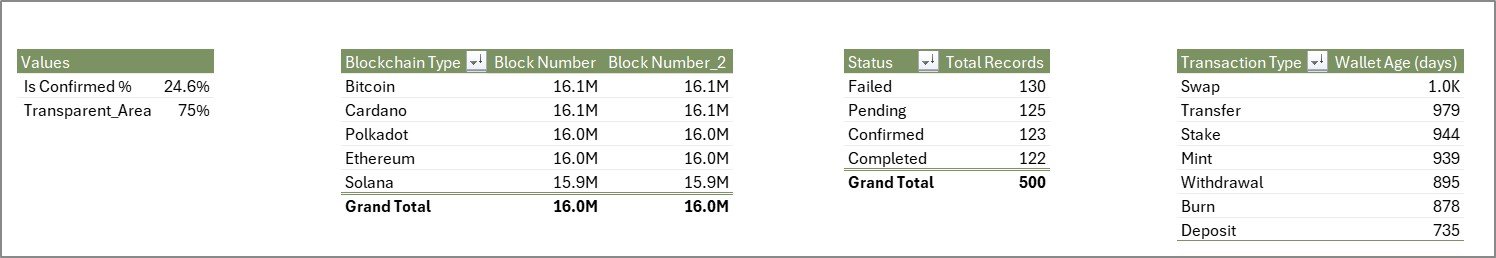
Support Sheet – Handles dropdowns and backend logic
Everything is designed to give you a complete 360° blockchain financial view.
⚙️ How to Use the Blockchain Finance Dashboard in Excel
Getting started is simple:
👉 Enter blockchain data in the Data Sheet
👉 Refresh the dashboard
👉 Use slicers to filter by blockchain type or transaction type
👉 Analyze KPI cards and charts
👉 Identify trends and risks
Within minutes, you can turn raw blockchain data into powerful financial insights 📊.
👨💻 Who Can Benefit from This Blockchain Finance Dashboard in Excel
This dashboard is ideal for:
💰 Crypto Investors – Track transactions and wallet performance
📊 Financial Analysts – Analyze blockchain financial data
🔗 Blockchain Companies – Monitor network activity
📉 Risk Analysts – Detect high-risk transactions
💼 Data Analysts – Generate insights and reports
Anyone involved in blockchain finance and analytics will benefit from this tool.
🔗 Click hare to read the Detailed blog post
Explore the full guide with detailed features, benefits, and best practices.
👉 Visit our YouTube channel to learn step-by-step video tutorials:
https://youtube.com/@PKAnExcelExpert