


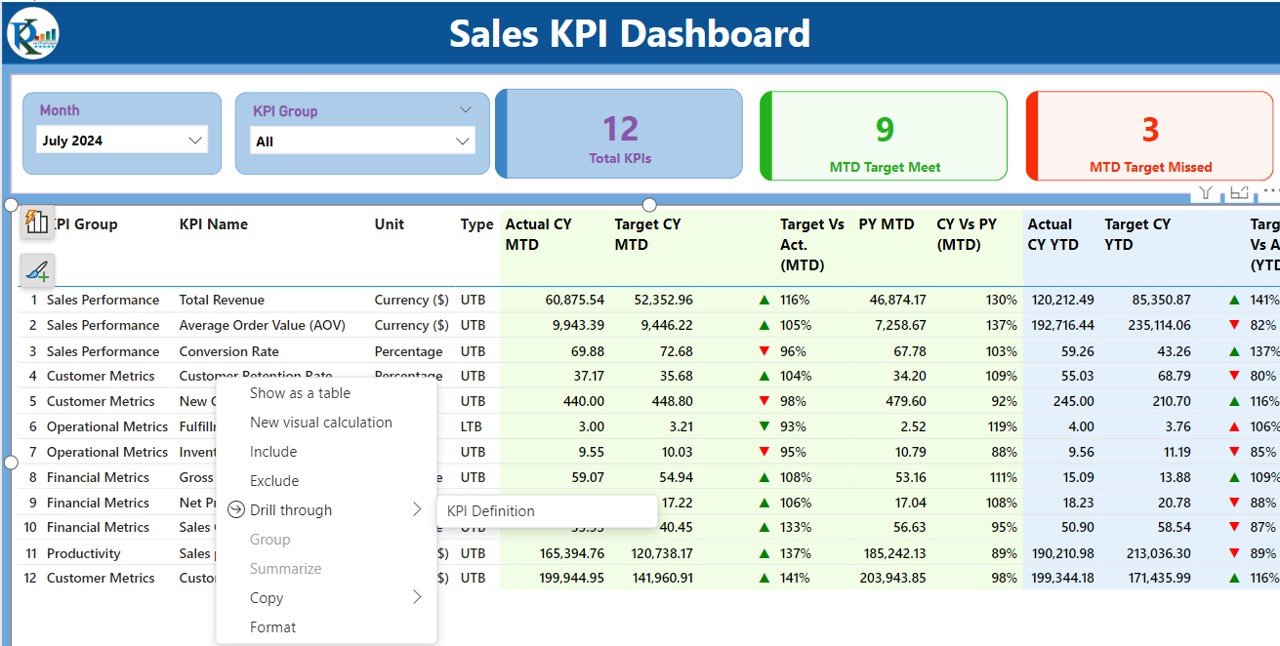




The Sales KPI Dashboard in Power BI is a powerful and interactive tool designed for sales teams, managers, and business owners who want to track, analyze, and optimize their sales performance. This customizable dashboard offers comprehensive insights into key performance indicators (KPIs) such as sales revenue, win rates, lead conversion rates, average deal size, and sales pipeline health, helping you make data-driven decisions to improve sales outcomes and revenue growth.
With real-time data tracking, this Power BI dashboard enables you to monitor and analyze your sales performance across various channels, providing you with the tools you need to optimize sales processes, boost team productivity, and drive profitability. Whether you’re managing a sales team, analyzing performance trends, or strategizing for business growth, this dashboard is an essential tool for increasing sales effectiveness and ensuring success.
Key Features of the Sales KPI Dashboard in Power BI
📊 Comprehensive Sales Performance Monitoring
Track essential KPIs like sales revenue, conversion rates, win rates, and deal size. Get a full picture of your sales performance and monitor progress in real-time.
⚡ Real-Time Sales Insights
Track sales performance at every stage of the sales funnel with real-time insights. Monitor KPIs such as lead conversion, opportunities created, and closed deals to ensure that your team stays on target.
📈 Sales Pipeline & Opportunity Analysis
Visualize and analyze your sales pipeline health. Track the progress of leads, opportunities, and deals to identify areas for improvement and boost conversion rates.
📅 Customizable Sales KPIs
Adjust the dashboard to track KPIs specific to your sales process, whether it’s focusing on revenue generation, lead qualification, or customer acquisition.
🖥️ Interactive & User-Friendly Interface
The Power BI dashboard is designed to be easy to navigate, with interactive charts, slicers, and filters that allow you to drill down into your sales data and gain deeper insights.
Why You’ll Love the Sales KPI Dashboard in Power BI

✅ Track Sales Performance Across Channels
Monitor sales across multiple channels, including direct sales, B2B, and e-commerce, to optimize strategies for each channel and increase revenue generation.
✅ Optimize Lead Conversion
Use real-time insights into lead conversion rates, win rates, and sales pipeline health to optimize your lead generation and sales conversion processes.
✅ Make Data-Driven Sales Decisions
Leverage detailed insights from the dashboard to make data-driven decisions about sales strategy, team performance, and resource allocation.
✅ Improve Sales Forecasting & Planning
Track key metrics such as average deal size and sales cycle length to improve sales forecasting, adjust sales targets, and optimize performance.
✅ Enhance Team Performance
Monitor individual and team performance to ensure that sales representatives are meeting targets and staying on track to meet organizational goals.
What’s Inside the Sales KPI Dashboard Template?
- Sales Performance Tracking: Monitor revenue, conversion rates, win rates, and sales volume.
- Sales Pipeline Health: Track the progress of leads and opportunities through the sales funnel.
- Opportunity & Deal Analysis: Analyze average deal size, close rates, and sales cycle length.
- Customizable KPIs: Tailor the dashboard to your sales strategy, tracking key metrics that matter most to your business.
- Interactive Visual Reporting: Use charts, graphs, and filters to analyze sales data and identify trends.
How to Use the Sales KPI Dashboard in Power BI
1️⃣ Download the Template: Get access to the Sales KPI Dashboard in Power BI instantly.
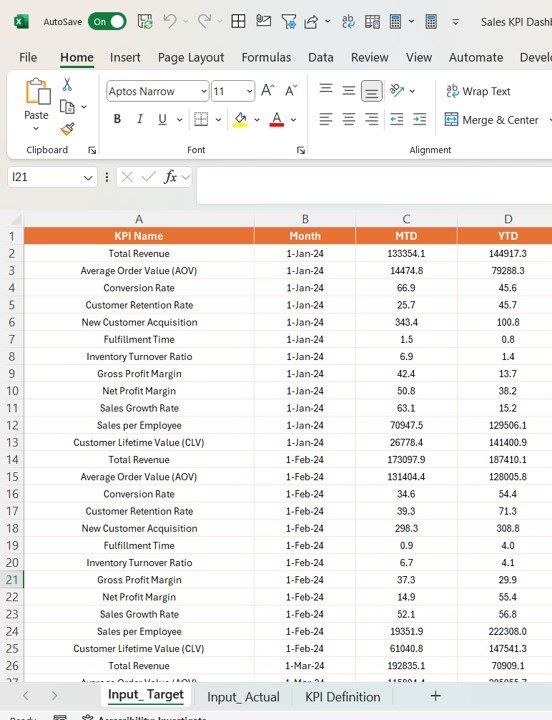
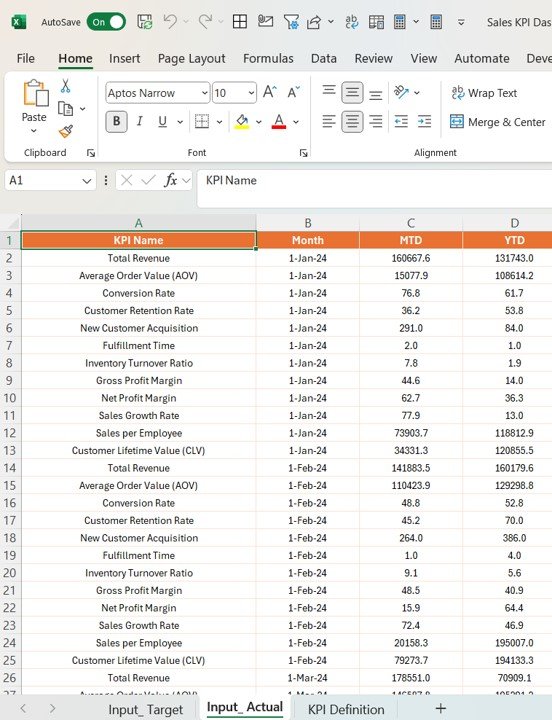
2️⃣ Input Sales Data: Enter data such as sales revenue, deal size, conversion rates, and lead progress.
3️⃣ Monitor & Track KPIs: Use the dashboard to monitor real-time sales performance across various KPIs.
4️⃣ Analyze & Optimize: Use the insights from the dashboard to optimize your sales strategy, improve forecasting, and enhance team performance.
After downloading and unzipping this file, ensure that macros are enabled before use. Refer to our below tutorial link for step-by-step instructions on enabling macros in Excel.
Who Can Benefit from the Sales KPI Dashboard in Power BI?
🔹 Sales Managers & Directors
🔹 Business Owners & Entrepreneurs
🔹 Marketing Teams & Lead Generation Specialists
🔹 Sales Representatives & Account Managers
🔹 Data Analysts & Business Intelligence Professionals
🔹 Anyone Seeking to Optimize Sales Performance
Track, analyze, and optimize your sales performance with the Sales KPI Dashboard in Power BI. Monitor key performance metrics, improve conversion rates, and drive revenue growth with this essential tool for sales teams and businesses.
Click here to read the Detailed blog post
Visit our YouTube channel to learn step-by-step video tutorials
Youtube.com/@PKAnExcelExpert














Reviews
There are no reviews yet.