

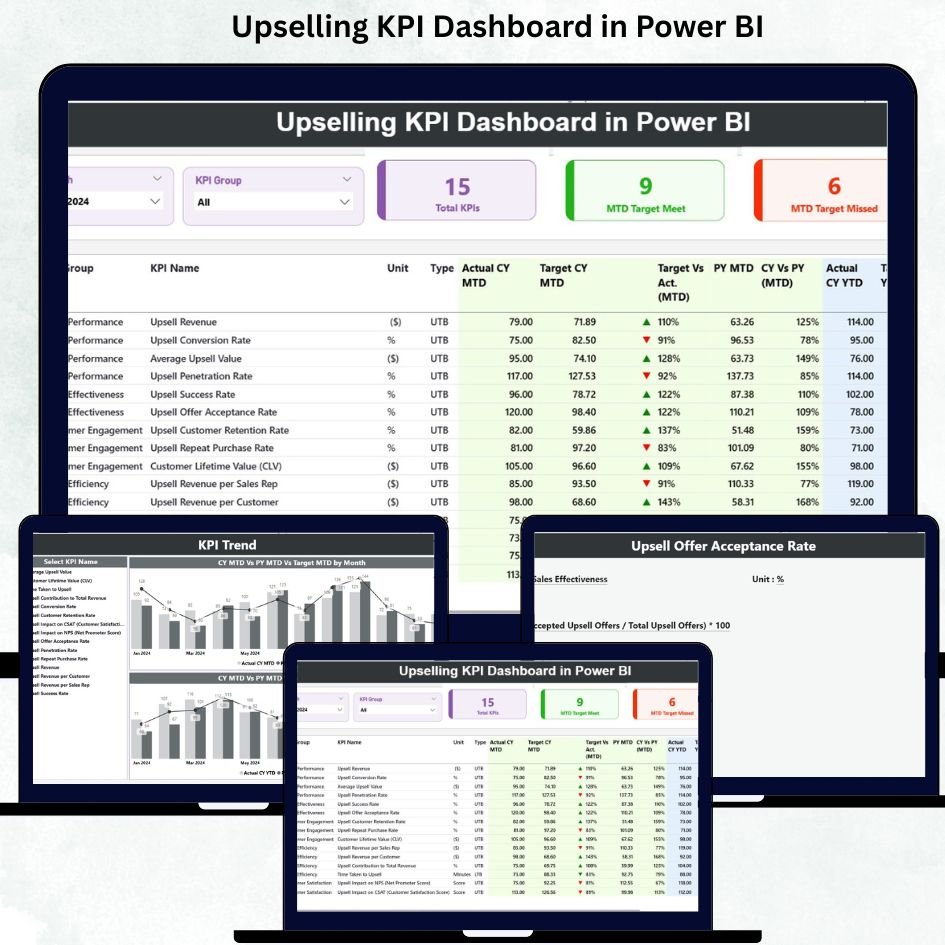
Running a sales team without real-time insights can feel like driving a car with no dashboard 🚗. You move forward, but you never know how fast you are going, when to stop, or which direction to turn. That’s why Upselling KPI Dashboard in Power BI is a game-changer for businesses looking to boost upsell revenue efficiently and effectively.
This ready-to-use Power BI dashboard connects with Excel data and provides a visual, interactive way to monitor every critical upselling KPI in real time. No more scattered spreadsheets, lost opportunities, or hidden trends. With this dashboard, decision-makers, sales managers, and business owners can track monthly and yearly performance, compare against targets, analyze trends, and take action immediately.
Key Features of Upselling KPI Dashboard in Power BI
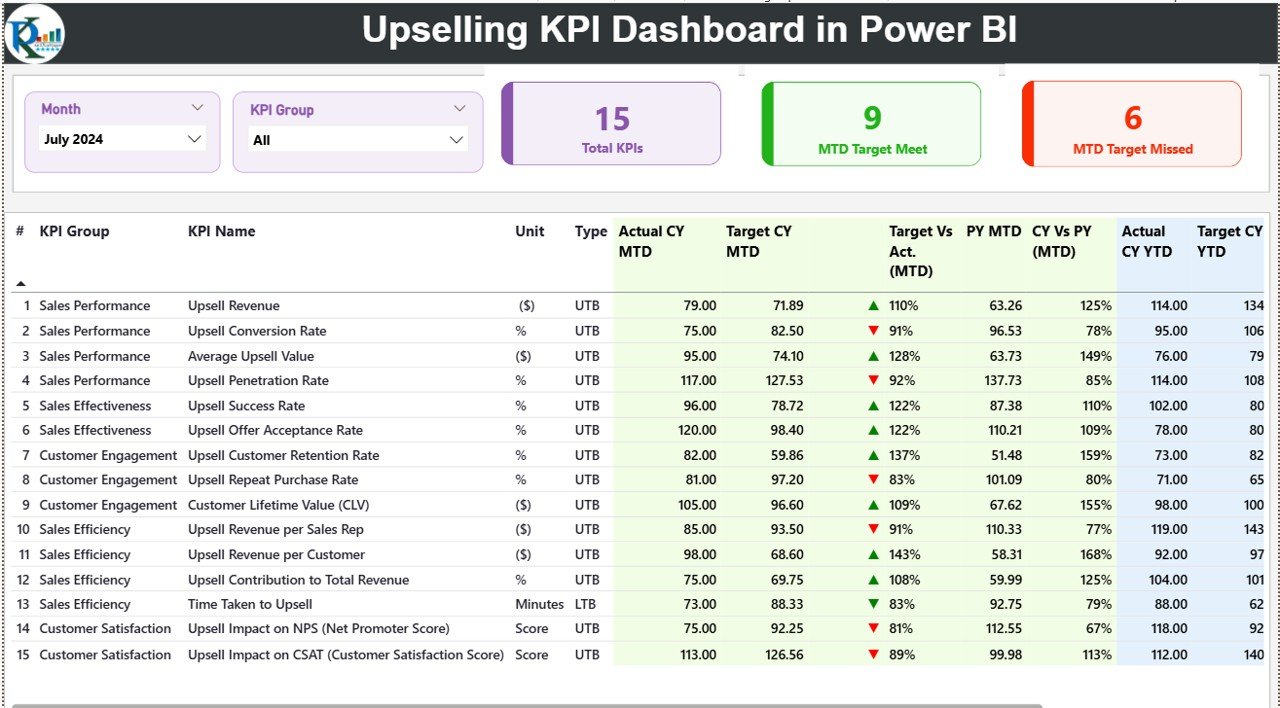
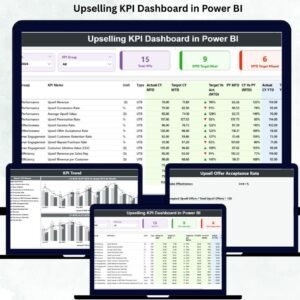
Interactive Summary Page 📊 – Get a complete snapshot of MTD and YTD upsell performance with KPI cards, detailed tables, and slicers to filter by month or KPI group.
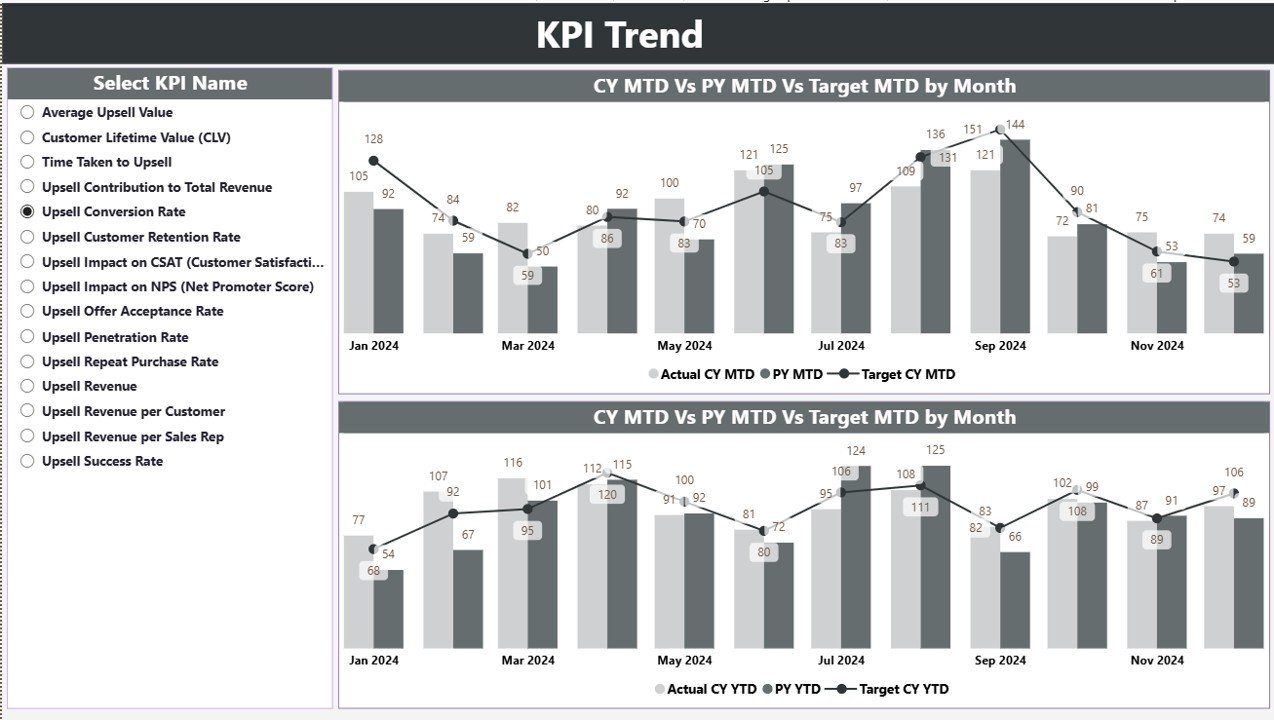
Trend Analysis Page 📈 – Visualize actual vs target vs previous year numbers with combo charts and identify patterns that help you improve upselling strategies.
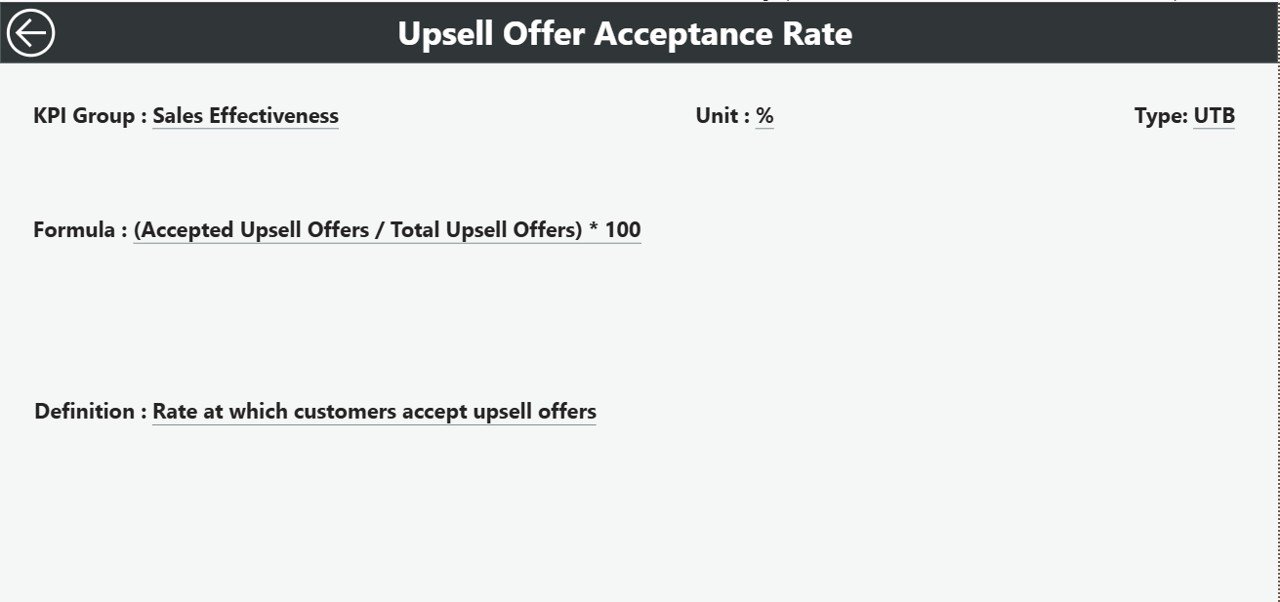
KPI Definition Drill-Through 🔍 – Access detailed KPI formulas, definitions, and categories for complete clarity without searching through documents.
Excel-Based Input 💻 – Easily update Actual, Target, and KPI Definition sheets to refresh the dashboard instantly.
Real-Time Reporting ⚡ – Automatic updates when you refresh your Excel data, reducing manual reporting effort.
Accurate Comparisons ✅ – Compare current performance with targets and last year’s performance effortlessly.
Easy Drill-Downs 🕵️♂️ – Identify underperforming KPIs and address gaps quickly.
Enhanced Decision-Making 💡 – Make informed, strategic decisions for pricing, coaching, and resource allocation.
What’s Inside the Upselling KPI Dashboard
Summary Page – Your main hub showing MTD/YTD numbers, KPI cards, and detailed tables.
KPI Trend Page – Combo charts highlighting upsell trends with interactive slicers.
KPI Definition Page – Hidden drill-through page with KPI formulas, units, types, and definitions.
Excel Sheets – Input_Actual, Input_Target, and KPI Definition sheets to manage data efficiently.
How to Use the Upselling KPI Dashboard
Update Your Data Monthly 📅 – Enter Actual and Target numbers in Excel sheets.
Refresh the Dashboard 🔄 – Instantly see updated performance metrics.
Analyze Trends 📊 – Use slicers to focus on specific KPIs, months, or categories.
Drill Through Details 🕵️ – Click any KPI to understand its formula and definition.
Act Fast ⚡ – Identify low-performing areas and strategize improvements quickly.
Who Can Benefit from This Upselling KPI Dashboard
Sales Leaders & Managers – Monitor team performance, set realistic targets, and improve revenue.
Business Owners – Gain complete visibility into upsell strategies and outcomes.
Analysts & Operations Teams – Easily track, report, and analyze upselling KPIs without manual effort.
Teams Using Excel & Power BI – Seamless integration with familiar tools for quick adoption.
Click here to read the Detailed blog post
Visit our YouTube channel to learn step-by-step video tutorials
















Reviews
There are no reviews yet.