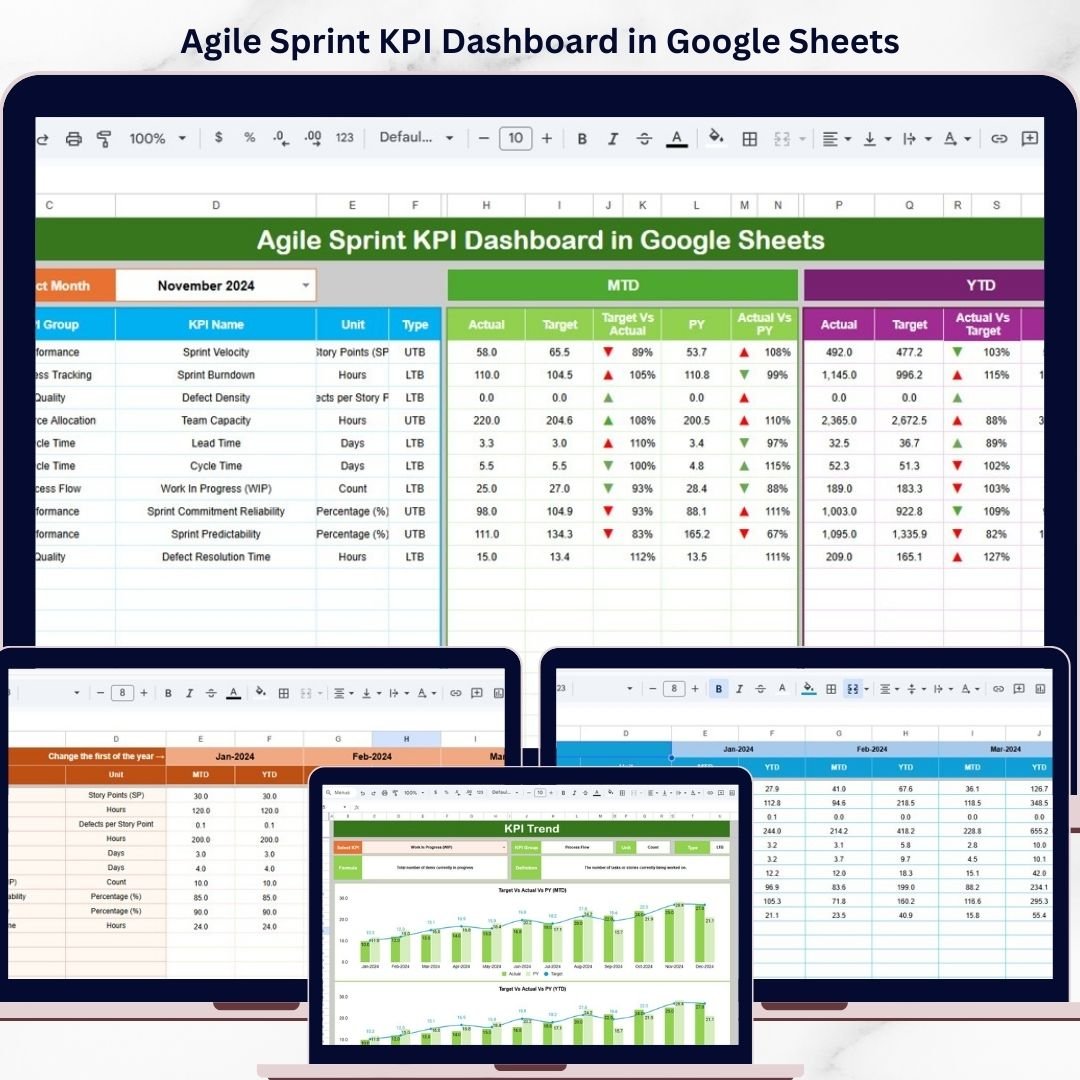
Want to track sprint performance like a pro without paying for expensive tools? The Agile Sprint KPI Dashboard in Google Sheets is the smart, ready-to-use solution your team needs to monitor Agile progress, improve delivery speed, and make better sprint decisions. In today’s fast-moving software development environment, Agile teams need accurate insights into sprint velocity, task completion, bug resolution, team productivity, and target achievement. However, when this information is spread across multiple spreadsheets, tracking performance becomes slow, messy, and frustrating. That is why this dashboard is designed to centralize all your important sprint KPIs in one interactive Google Sheets solution. It helps Scrum teams, project managers, and Agile leaders move from manual reporting to faster, data-driven performance tracking. If you want a simple yet powerful way to monitor sprint health and improve results, this dashboard is built for you.
Key Feature of Agile Sprint KPI Dashboard in Google Sheets
📊 6 Well-Structured Worksheets – This dashboard comes with six organized sheets: Dashboard, KPI Trend, Actual Number, Target, Previous Year, and KPI Definition.
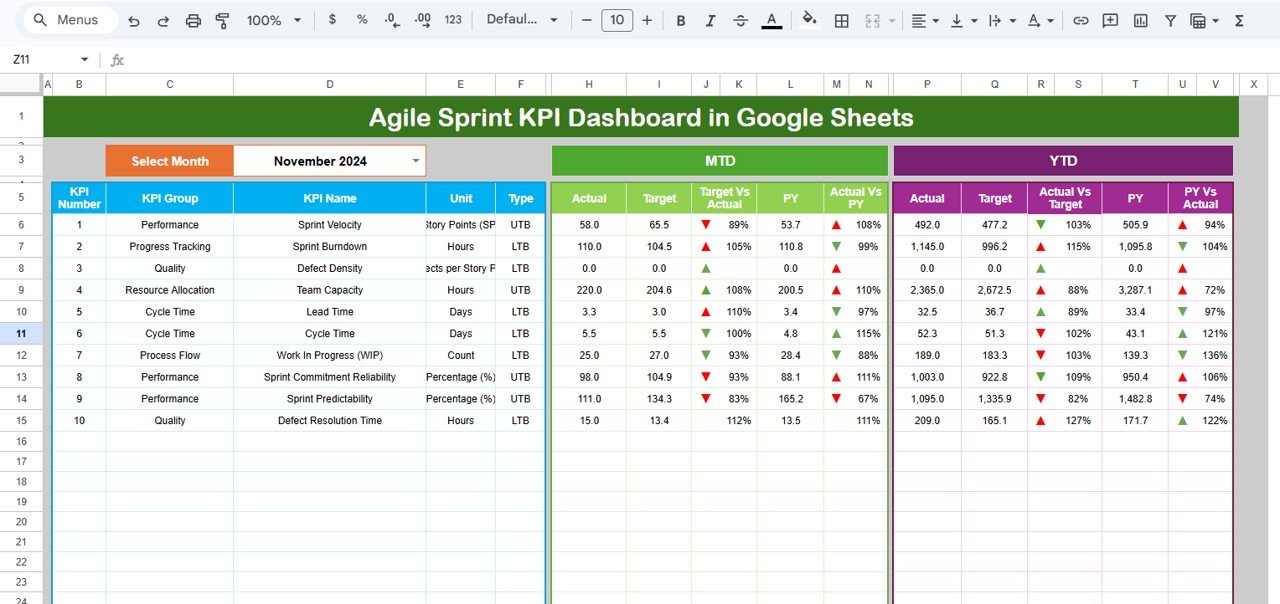
🎯 Interactive Dashboard Sheet – The main dashboard sheet gives you a complete performance snapshot with a Month selector in Cell D3 for dynamic updates.
📈 MTD and YTD KPI Tracking – Monitor Actual, Target, Previous Year, Target vs Actual %, and Previous Year vs Actual % for both Month-to-Date and Year-to-Date analysis.
🔺 Conditional Formatting Indicators – Quickly understand KPI performance with visual arrows and formatting that highlight progress and gaps.
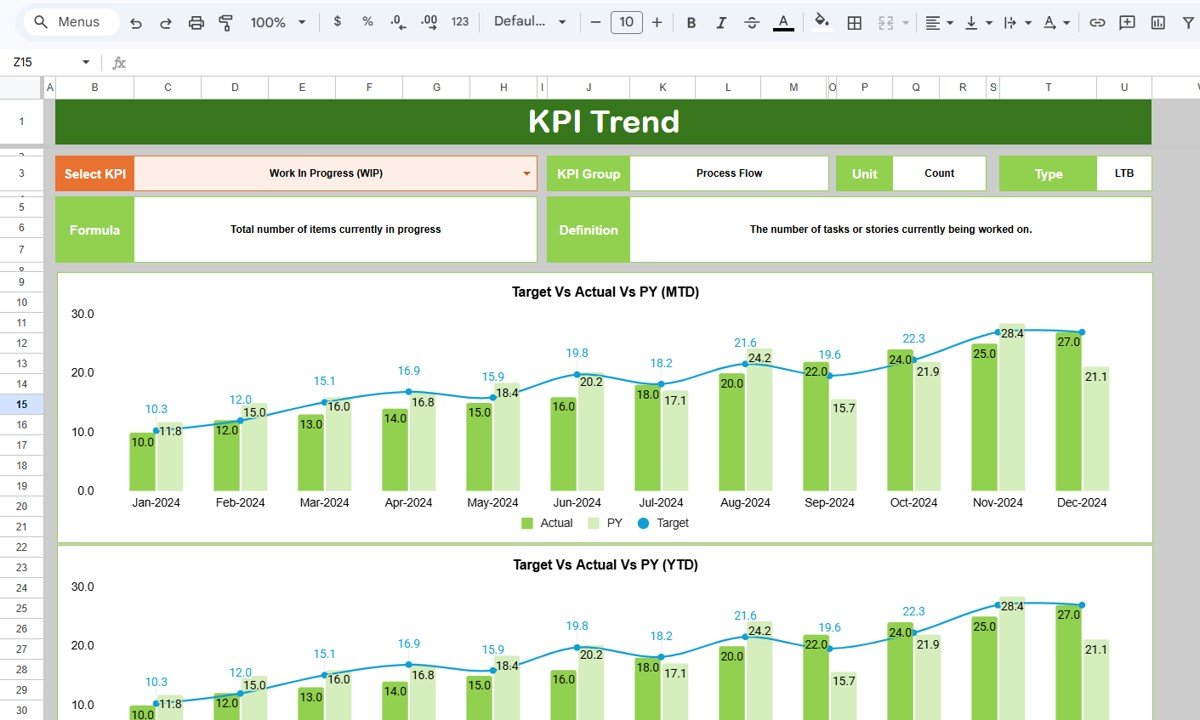
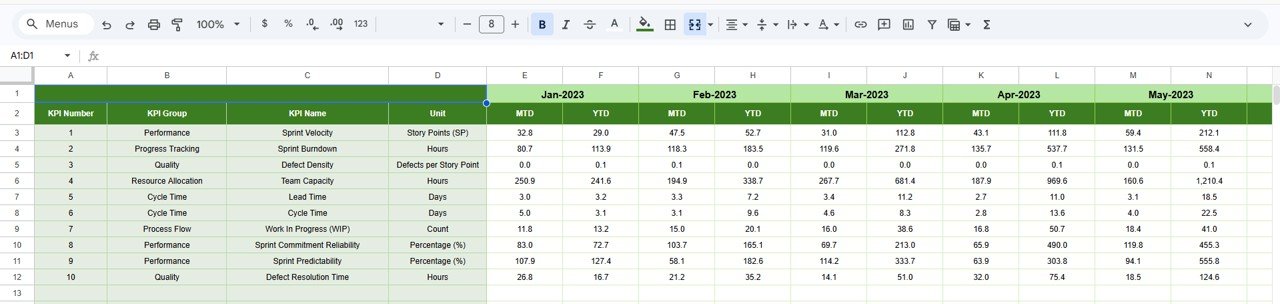
📉 KPI Trend Analysis Sheet – Analyze the behavior of individual KPIs over time using a KPI selection dropdown in Cell C3.
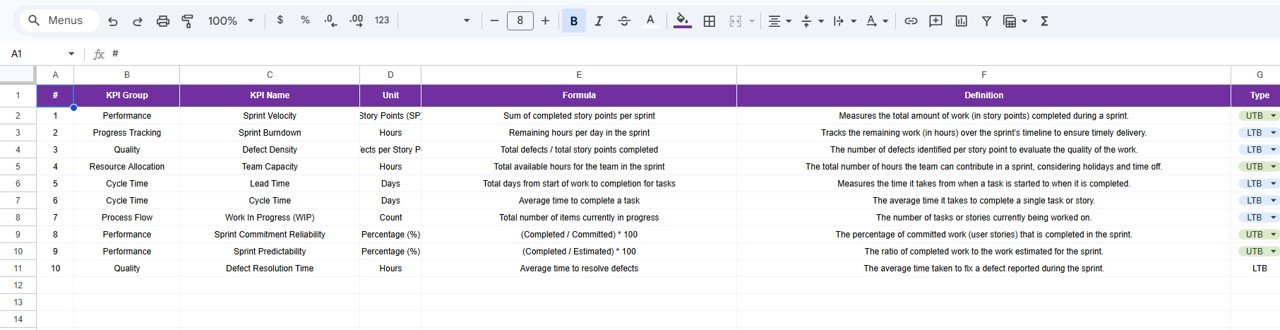
📘 Detailed KPI Information – Instantly view KPI Group, KPI Unit, KPI Type, KPI Formula, and KPI Definition for selected KPIs.
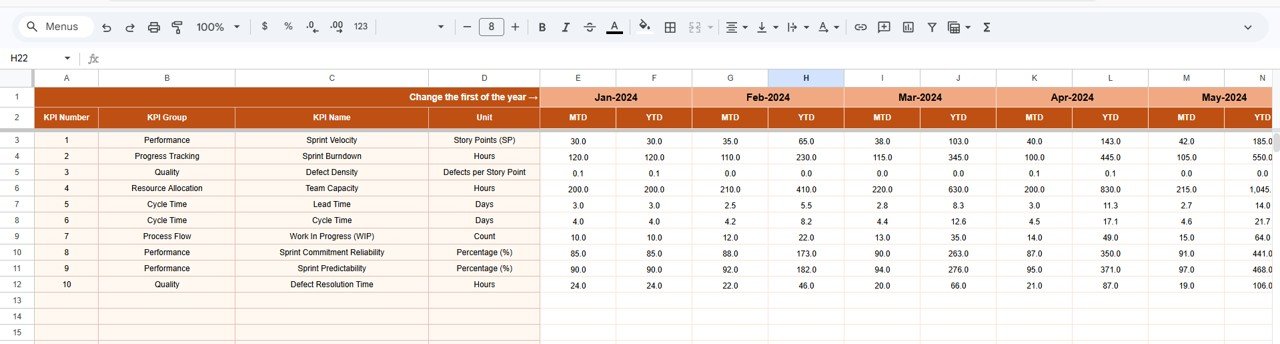
✏️ Actual Number Input Sheet – Enter MTD and YTD values easily while managing the month selection in Cell E1 for accurate reporting.
🎯 Target and Previous Year Comparison Sheets – Track current performance against targets and historical values to uncover trends and improvement areas.
⚙️ Fully Editable in Google Sheets – Customize KPI names, formulas, targets, and layouts based on your Agile team’s requirements.
💡 Simple Yet Powerful Reporting Tool – Get clear Agile insights without needing advanced software or expensive reporting platforms.
What’s Inside the Agile Sprint KPI Dashboard in Google Sheets
Inside this digital product, you get a complete KPI tracking system designed specifically for Agile sprint management. It is structured to help teams monitor current sprint performance, compare results with targets, and review improvement trends over time.
The dashboard includes 6 worksheets, each with a dedicated purpose.
The Dashboard Sheet serves as the main reporting page where all KPI insights are presented in a clean and interactive format. It allows users to select the month and instantly view updated MTD and YTD performance metrics.
The KPI Trend Sheet helps users analyze one KPI at a time. It displays the KPI group, unit, type, formula, and definition while showing the trend behavior of that KPI over time.
The Actual Number Sheet is used to input current MTD and YTD values. This makes it easy to update performance data regularly.
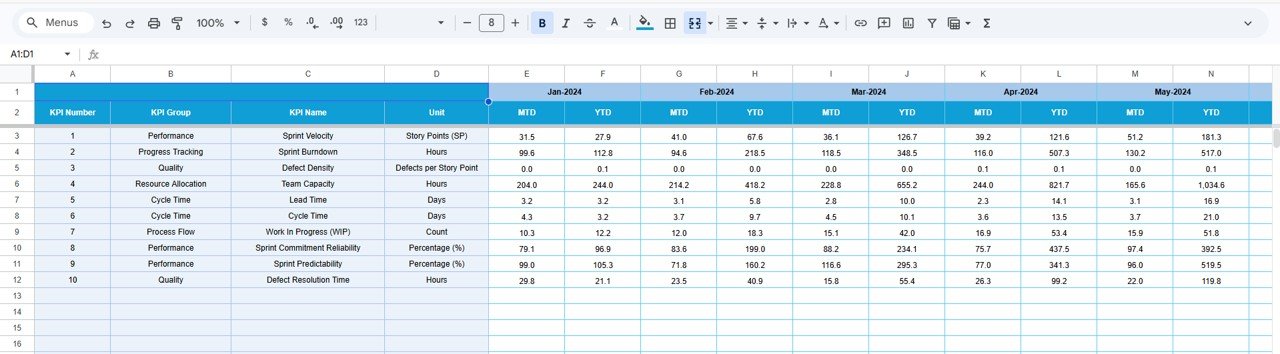
The Target Sheet stores KPI target values so your team can compare goals versus actual achievement.
The Previous Year Sheet provides historical data for better year-over-year comparison.
The KPI Definition Sheet clearly explains each KPI, its formula, and its purpose, ensuring better understanding across the team.
As a result, you get one centralized, easy-to-manage Google Sheets dashboard for Agile KPI reporting.
How to Use the Agile Sprint KPI Dashboard in Google Sheets
🚀 Start by entering your actual sprint KPI values into the Actual Number Sheet. Make sure to set the first month of the year in Cell E1 to ensure proper calculations.
🎯 Add your performance targets into the Target Sheet so the dashboard can compare actual values against expected goals.
📉 Fill the Previous Year Sheet with historical data to support year-over-year analysis and trend reviews.
📘 Define each KPI clearly in the KPI Definition Sheet, including KPI Name, Group, Unit, Formula, Definition, and KPI Type.
📊 Move to the Dashboard Sheet and use the Month selector in Cell D3 to choose the reporting period. The dashboard will update dynamically to show current MTD and YTD insights.
📈 Open the KPI Trend Sheet and use the KPI dropdown in Cell C3 to analyze specific KPI trends and performance behavior in more detail.
💡 Use this dashboard in sprint reviews, team meetings, management reporting, and planning sessions to improve performance and delivery quality.
Who Can Benefit from This Agile Sprint KPI Dashboard in Google Sheets
👨💻 Agile Teams that want better sprint visibility and KPI tracking
📋 Scrum Masters who need a simple tool to monitor sprint health and team progress
🧠 Project Managers who want data-driven insights for faster decision-making
🚀 Product Managers who need to track delivery efficiency and target achievement
📊 PMO Teams that want centralized Agile reporting in one place
🏢 Software Development Companies looking for a cost-effective KPI dashboard solution
🔍 Team Leads who want to identify bottlenecks and improvement opportunities quickly
💡 Startups and Growing Teams that need a flexible and editable Google Sheets dashboard
This dashboard is more than a spreadsheet. It is a practical performance tool that helps Agile teams stay focused, measure progress, and improve results sprint after sprint. If you want a smart, professional, and easy-to-use KPI reporting system, this dashboard is a great choice for your workflow.
Click hare to read the Detailed blog post
Read the complete blog post to explore the dashboard structure, KPI logic, advantages, and best practices in full detail.


