Boost your manufacturing efficiency with the Ball Bearing Production Dashboard in Excel 🚀. In today’s competitive industrial environment, managing production data, tracking costs, and ensuring timely delivery can be extremely challenging.
However, this powerful and ready-to-use Excel dashboard simplifies everything. It transforms complex production data into clear visuals, actionable insights, and structured reports—all in one place.
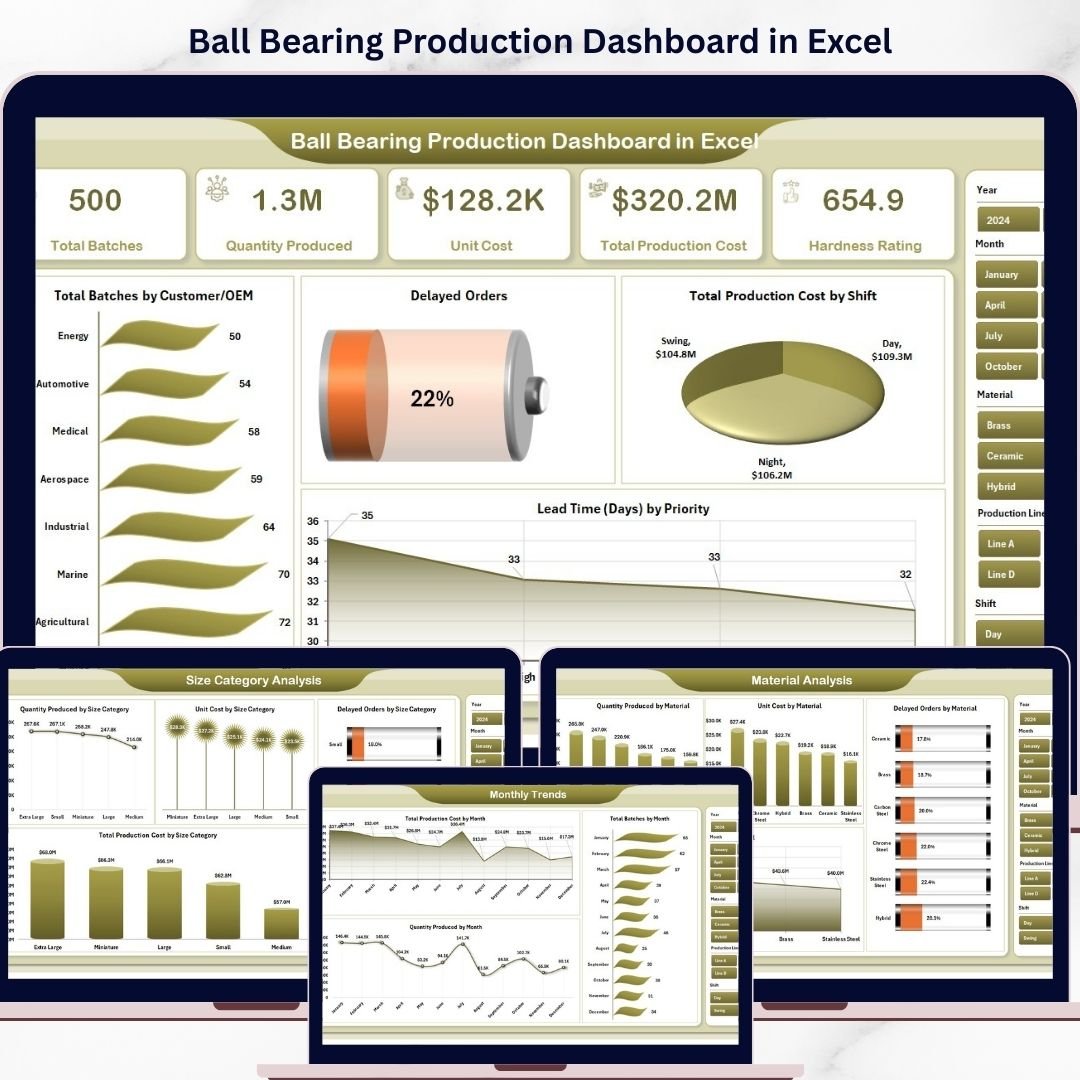
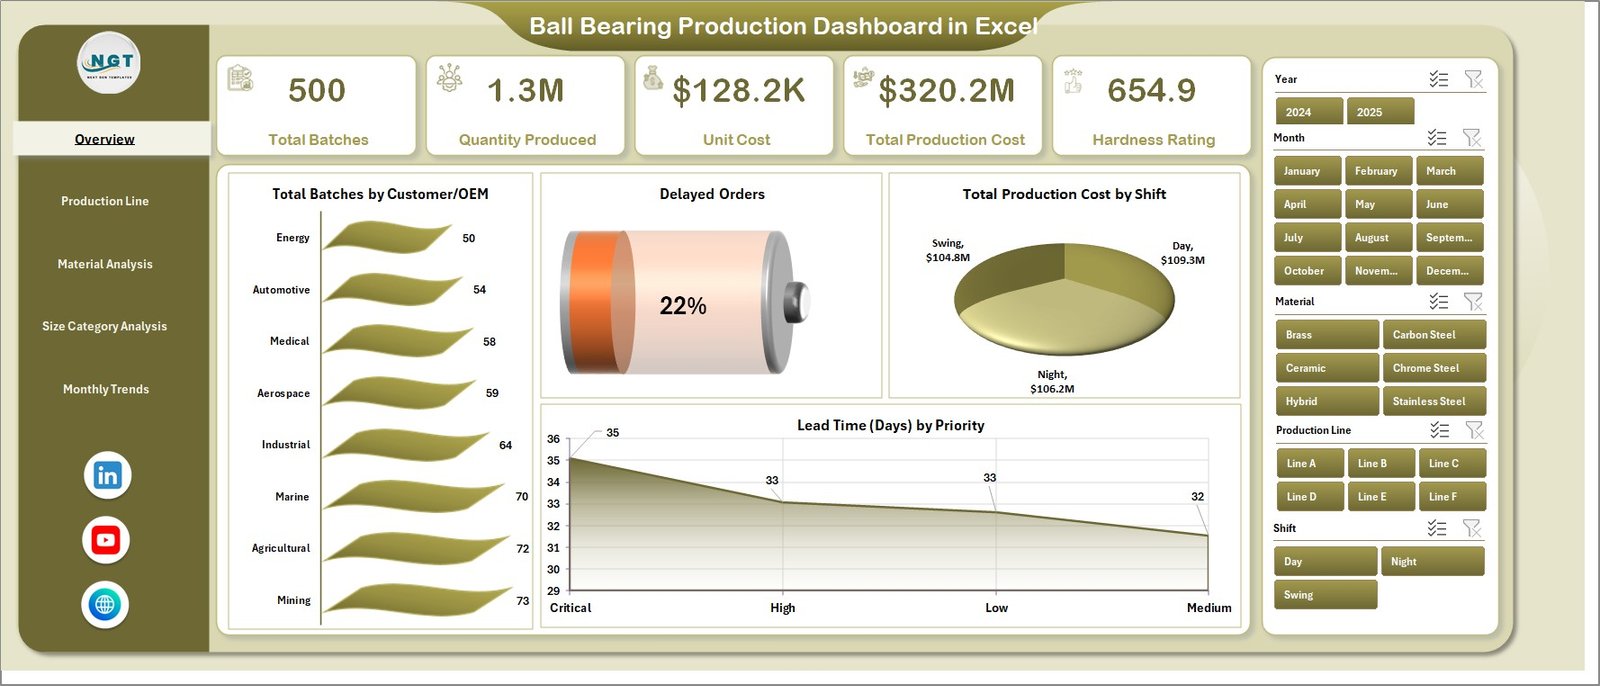
With this dashboard, you can monitor production volume, unit costs, delayed orders, lead time, and material usage effortlessly. As a result, you can make faster, smarter, and data-driven decisions to optimize your operations.
🚀 Key Feature of Ball Bearing Production Dashboard in Excel
✅ 📊 Interactive Excel Dashboard
Visualize production data using dynamic charts and slicers.
✅ 📈 Complete Production KPI Tracking
Track quantity, costs, delays, and efficiency in one place.
✅ 📅 Multi-Page Analytical Dashboard
Explore insights across 5 structured pages for deeper analysis.
✅ 🔍 Smart Filtering with Slicers
Filter data instantly for customized analysis.
✅ ⚙️ Production Line Insights
Analyze performance across different production lines.
✅ 🧪 Material & Size Analysis
Understand material usage and optimize size-based production.
✅ 📂 Organized Data Structure
Separate Data and Support sheets for efficient management.
📦 What’s Inside the Ball Bearing Production Dashboard in Excel
This dashboard includes 5 powerful analytical pages:
📊 Overview Page – Snapshot of production performance with KPI cards
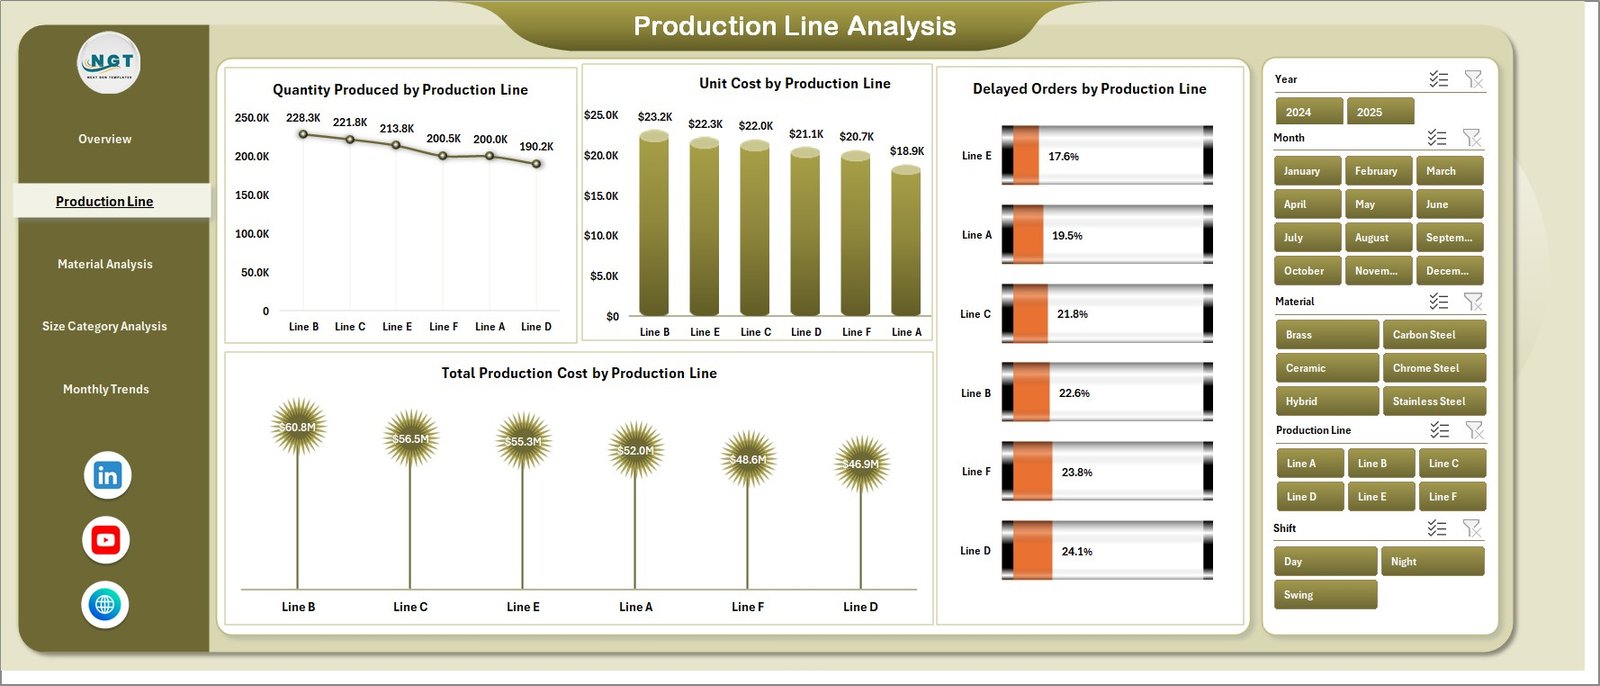
⚙️ Production Line Analysis – Evaluate output and efficiency by production line
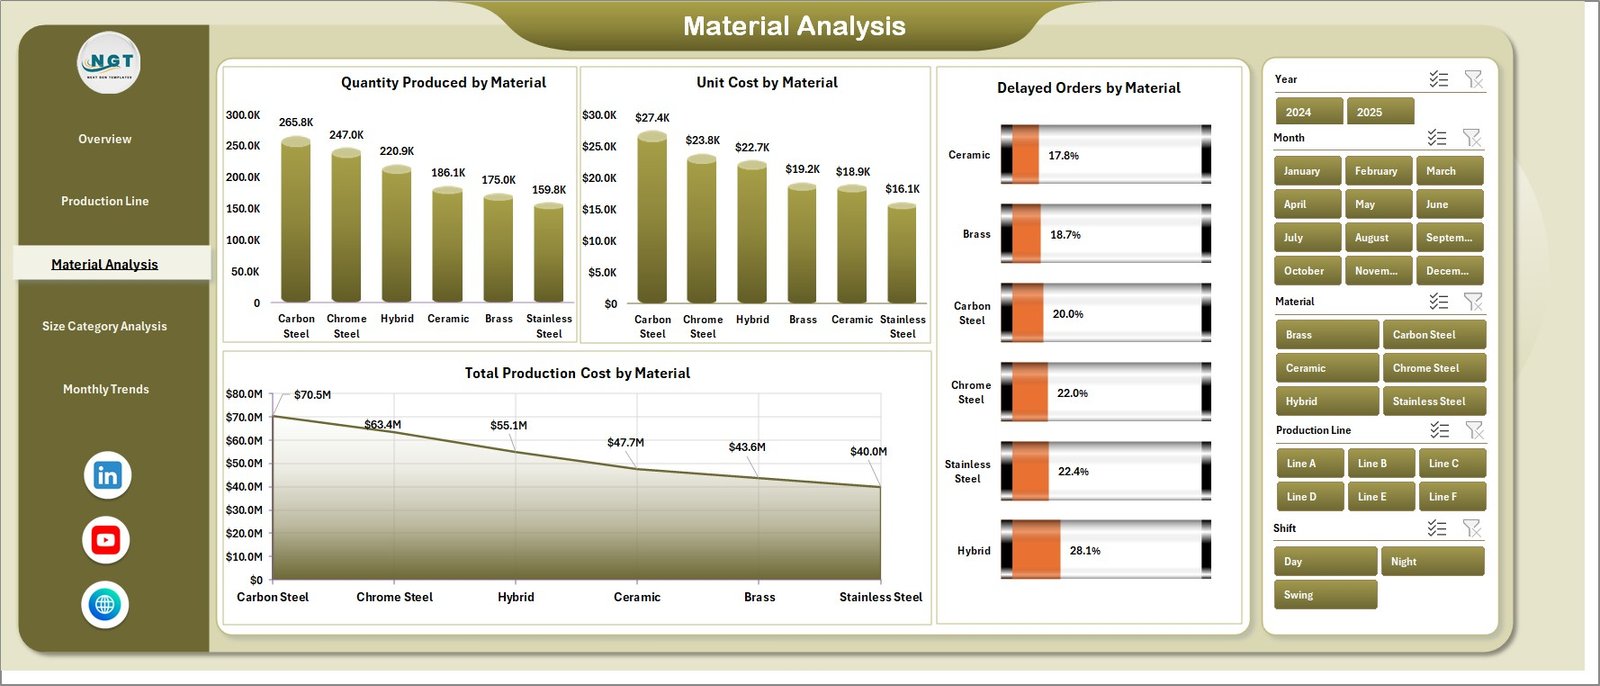
🧪 Material Analysis – Analyze material usage and cost impact
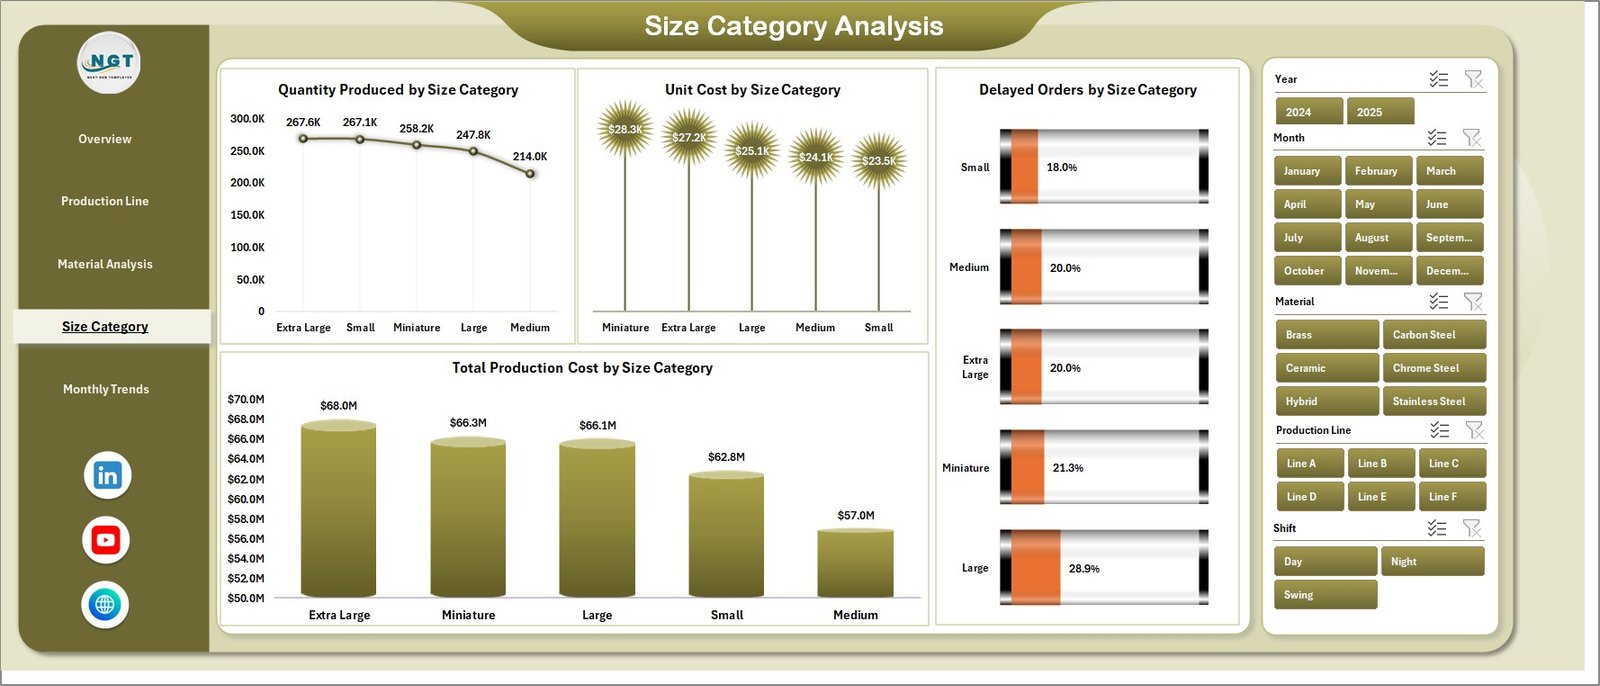
📏 Size Category Analysis – Compare performance across product sizes
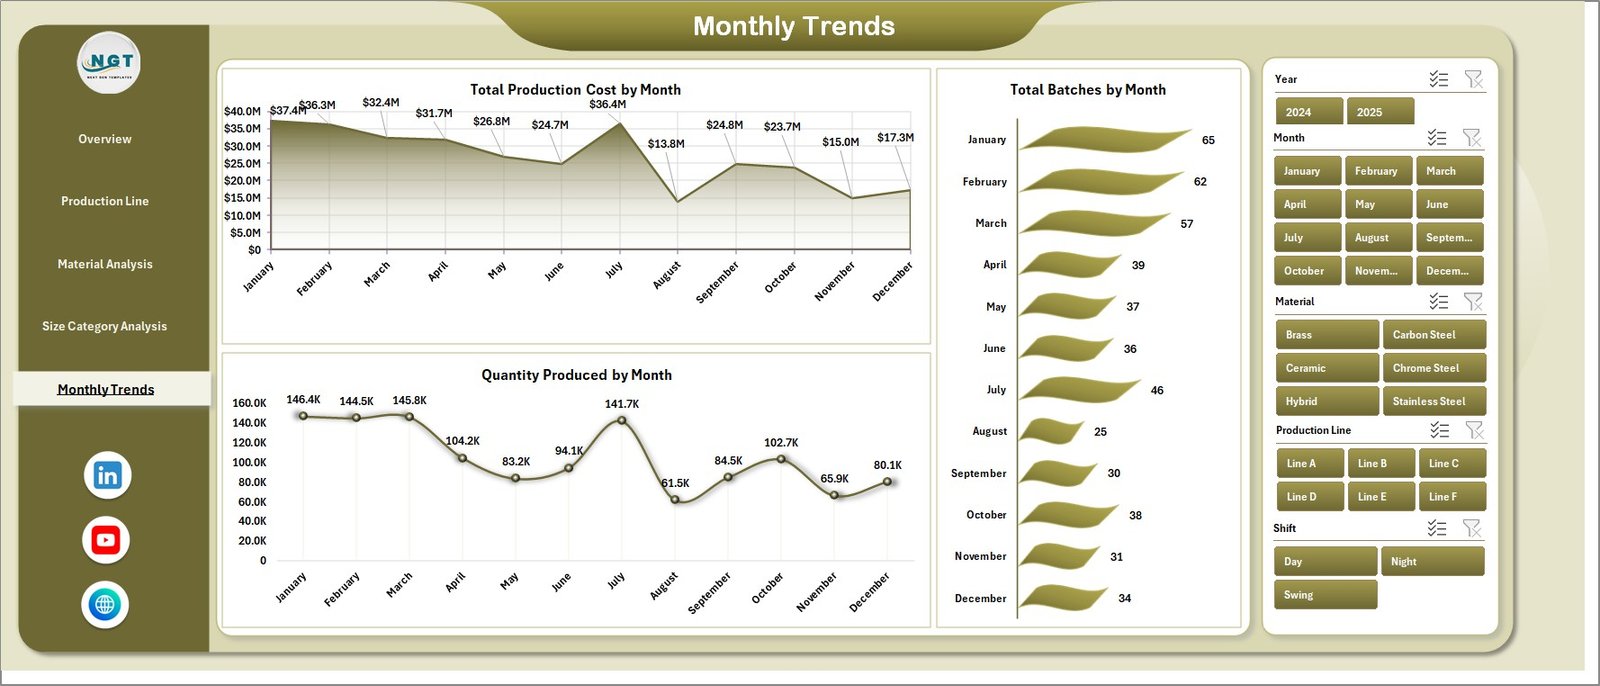
📅 Month Analysis – Track production trends over time
📂 Additional Sheets:
-
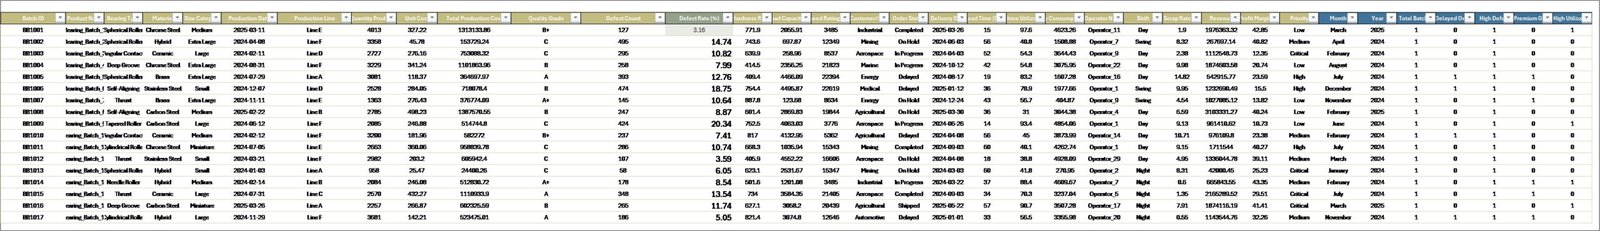
Data Sheet – Stores all raw production data
-
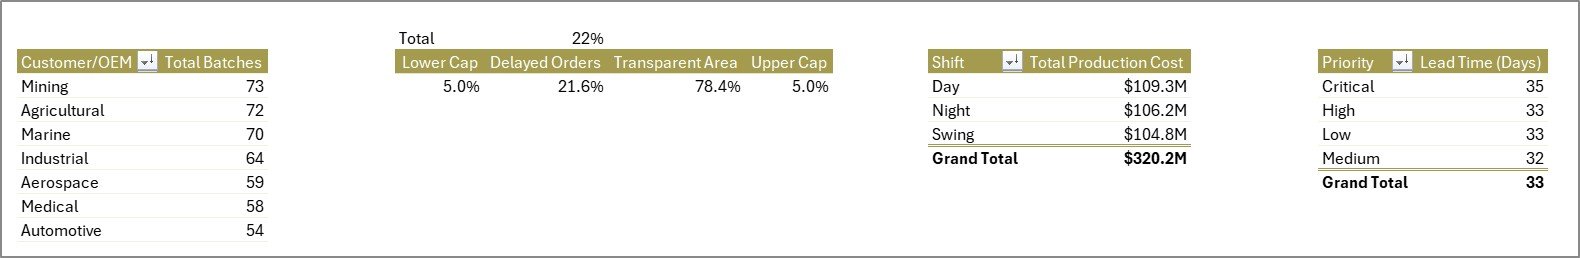
Support Sheet – Handles backend calculations and logic
Everything is designed to give you a complete 360° production performance view.
⚙️ How to Use the Ball Bearing Production Dashboard in Excel
Getting started is simple:
👉 Enter production data in the Data Sheet
👉 Refresh pivot tables and charts
👉 Use slicers to filter by customer, production line, or material
👉 Analyze KPI cards and charts
👉 Identify trends and take action
Within minutes, you can transform raw production data into powerful operational insights 📊.
👨🏭 Who Can Benefit from This Ball Bearing Production Dashboard in Excel
This dashboard is perfect for:
🏭 Manufacturing Managers – Monitor production performance
⚙️ Production Supervisors – Track efficiency and delays
📊 Operations Teams – Optimize workflows
🧪 Quality Analysts – Analyze production quality
🚚 Supply Chain Managers – Improve planning and delivery
📈 Business Analysts – Generate actionable insights
Anyone involved in manufacturing and production management will benefit from this tool.
🔗 Click hare to read the Detailed blog post
Explore the complete guide with detailed features, benefits, and best practices.
👉 Visit our YouTube channel to learn step-by-step video tutorials:
https://youtube.com/@PKAnExcelExpert