Incubators and Accelerators KPI Dashboard and accelerators play a crucial role in fostering innovation and supporting early-stage businesses. These programs provide mentorship, funding opportunities, training resources, networking support, and infrastructure that help startups grow and scale successfully. However, managing multiple startup programs simultaneously can become complex, especially when incubators track dozens of startups, mentor sessions, funding milestones, and growth indicators.
Because incubators often support hundreds of startups every year, organizations must monitor performance carefully. They need to track how many startups join programs, how much funding startups raise, how mentorship impacts growth, and how many startups successfully graduate from programs.
Unfortunately, many incubators still rely on manual reports, spreadsheets, and disconnected tracking systems. As a result, program managers struggle to analyze startup progress, measure program impact, and demonstrate results to stakeholders.
This is where the Incubators and Accelerators KPI Dashboard in Power BI becomes an essential solution.
The Incubators and Accelerators KPI Dashboard in Power BI is a powerful business intelligence tool designed to help startup ecosystem organizations monitor key performance indicators in a centralized and interactive environment. By leveraging the advanced data visualization capabilities of Microsoft Power BI, this dashboard converts complex program data into intuitive charts, KPI cards, and performance indicators.
Instead of reviewing multiple reports manually, incubator managers can track startup performance, mentorship activities, funding outcomes, and program success metrics through a single dashboard.
The dashboard collects data from structured Excel sheets and transforms it into meaningful analytics. With dynamic slicers and interactive visuals, users can analyze program performance based on month, KPI group, startup category, or performance indicator.
This dashboard is particularly useful for organizations that must report program impact to government agencies, investors, venture capital partners, universities, and corporate innovation programs.
Because the dashboard includes both MTD (Month-to-Date) and YTD (Year-to-Date) comparisons, managers can evaluate both short-term performance and long-term trends.
The system also compares current performance with previous year results, allowing organizations to understand growth patterns and program effectiveness.
The dashboard contains three analytical pages that work together to provide complete KPI visibility. These include the Summary Page, KPI Trend Page, and KPI Definition Page.
Whether you manage a startup incubator, accelerator program, university innovation hub, venture development initiative, or corporate startup program, this dashboard provides a comprehensive analytics platform to monitor performance.
By transforming raw startup ecosystem data into visual insights, the Incubators and Accelerators KPI Dashboard in Power BI enables organizations to improve program management, strengthen stakeholder reporting, and maximize startup success outcomes.
🚀 Key Feature of Incubators and Accelerators KPI Dashboard in Power BI
📊 Interactive Startup Ecosystem Dashboard
Monitor incubator and accelerator program performance through dynamic Power BI visuals.
🚀 Startup Program KPI Tracking
Track key metrics such as startup growth, funding raised, and mentorship engagement.
📈 Startup Performance Monitoring
Evaluate startup progress using measurable performance indicators.
💰 Funding Performance Analysis
Analyze funding raised by startups and investment readiness indicators.
👨🏫 Mentorship Engagement Insights
Monitor mentorship sessions and mentor participation.
📅 MTD and YTD KPI Comparison
Track both short-term and long-term performance metrics.
📊 Historical Performance Analysis
Compare current year KPIs with previous year results.
🎛 Interactive Slicers & Filters
Analyze KPIs by month or KPI category.
📈 KPI Trend Analysis
Visualize KPI performance trends through dynamic charts.
⚙️ Excel-Based Data Source
Easily update KPI data through Excel input sheets.
📊 What’s Inside the Incubators and Accelerators KPI Dashboard in Power BI
The dashboard includes three interactive analytical pages designed to monitor startup ecosystem performance.
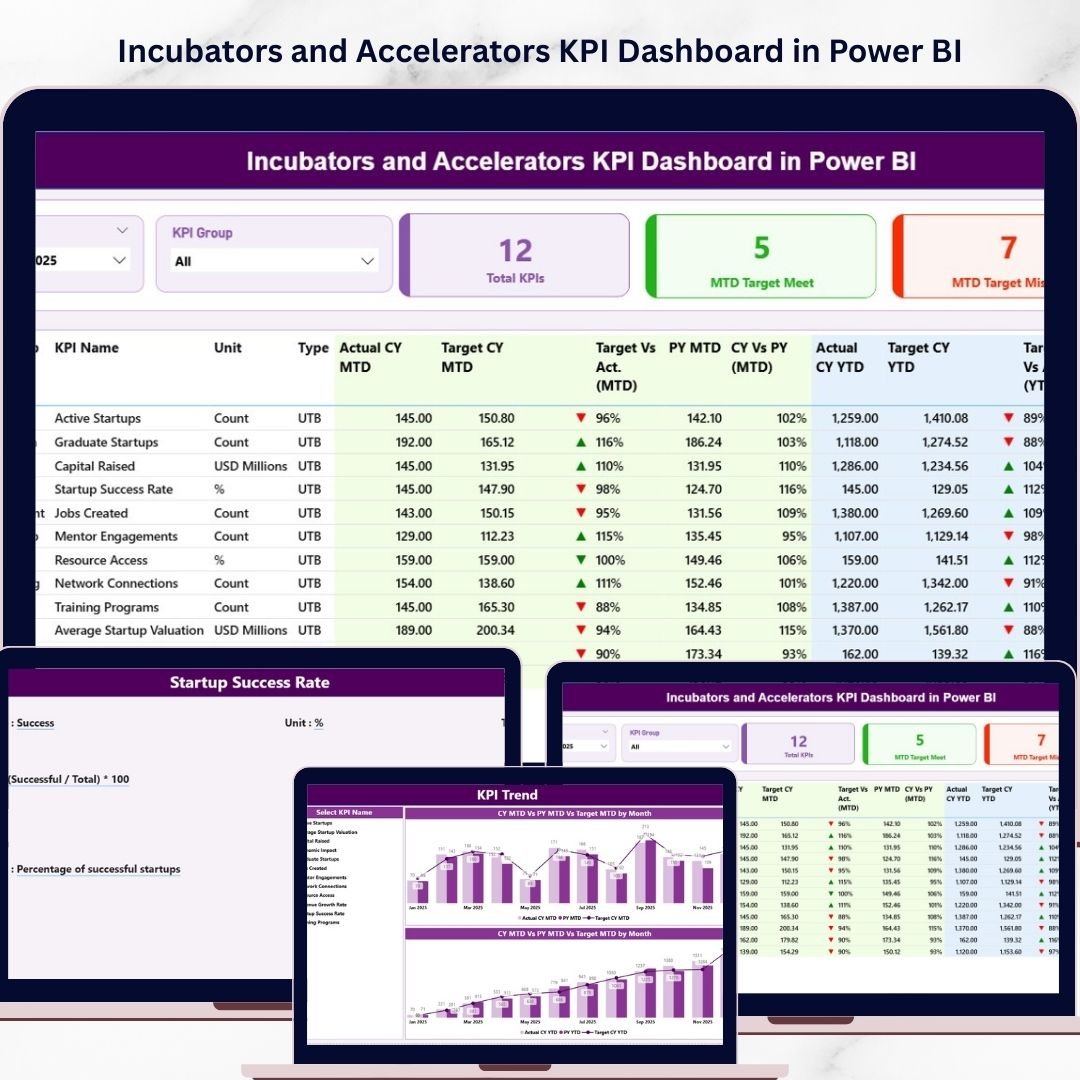
📊 Summary Page – Complete KPI Performance Overview
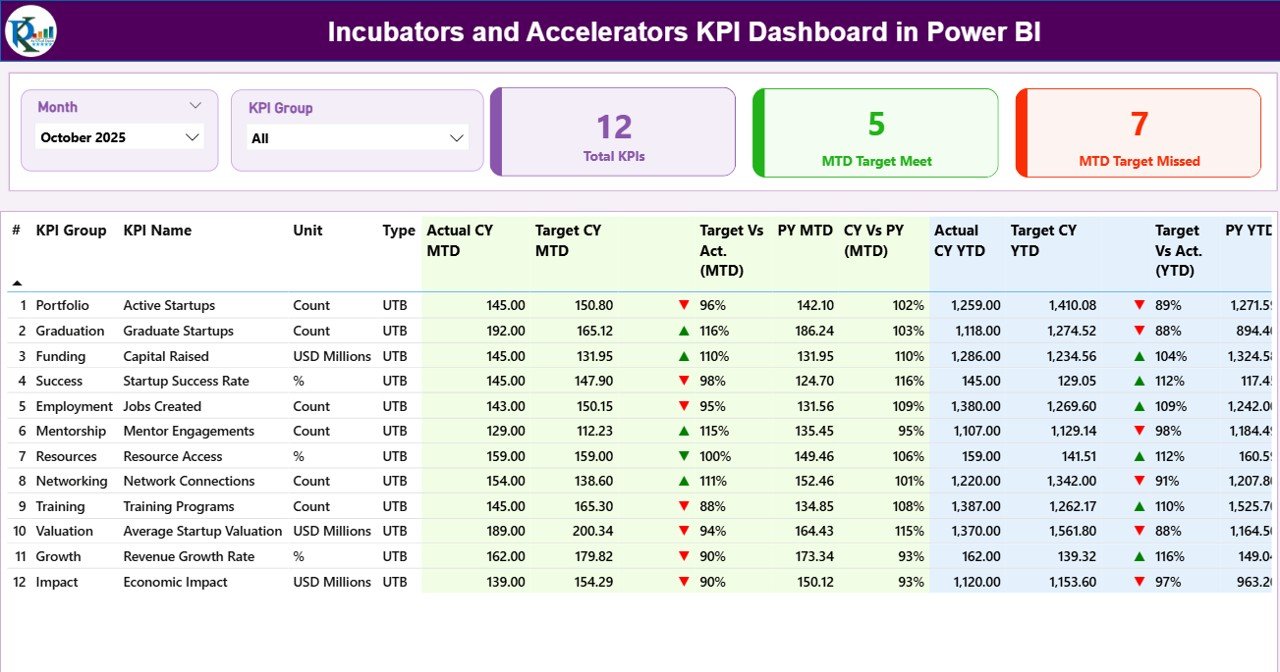
The Summary Page serves as the main dashboard view.
At the top of the page, users can filter performance using:
• Month Slicer
• KPI Group Slicer
These slicers allow program managers to analyze KPI performance for specific periods or categories.
KPI Performance Cards
The dashboard displays three key performance cards:
• Total KPIs Count – Total number of KPIs tracked
• MTD Target Meet Count – KPIs that achieved their targets
• MTD Target Missed Count – KPIs that failed to meet targets
These cards provide an instant overview of program performance.
Detailed KPI Table
The dashboard also includes a detailed KPI table showing:
• KPI Number
• KPI Group
• KPI Name
• Unit of Measurement
• KPI Type (UTB or LTB)
• Actual CY MTD
• Target CY MTD
• Target vs Actual (MTD)
• Previous Year MTD
• Current Year vs Previous Year (MTD)
• Actual CY YTD
• Target CY YTD
• Target vs Actual (YTD)
• Previous Year YTD
• Current Year vs Previous Year (YTD)
This table allows incubators to analyze performance at a granular level.
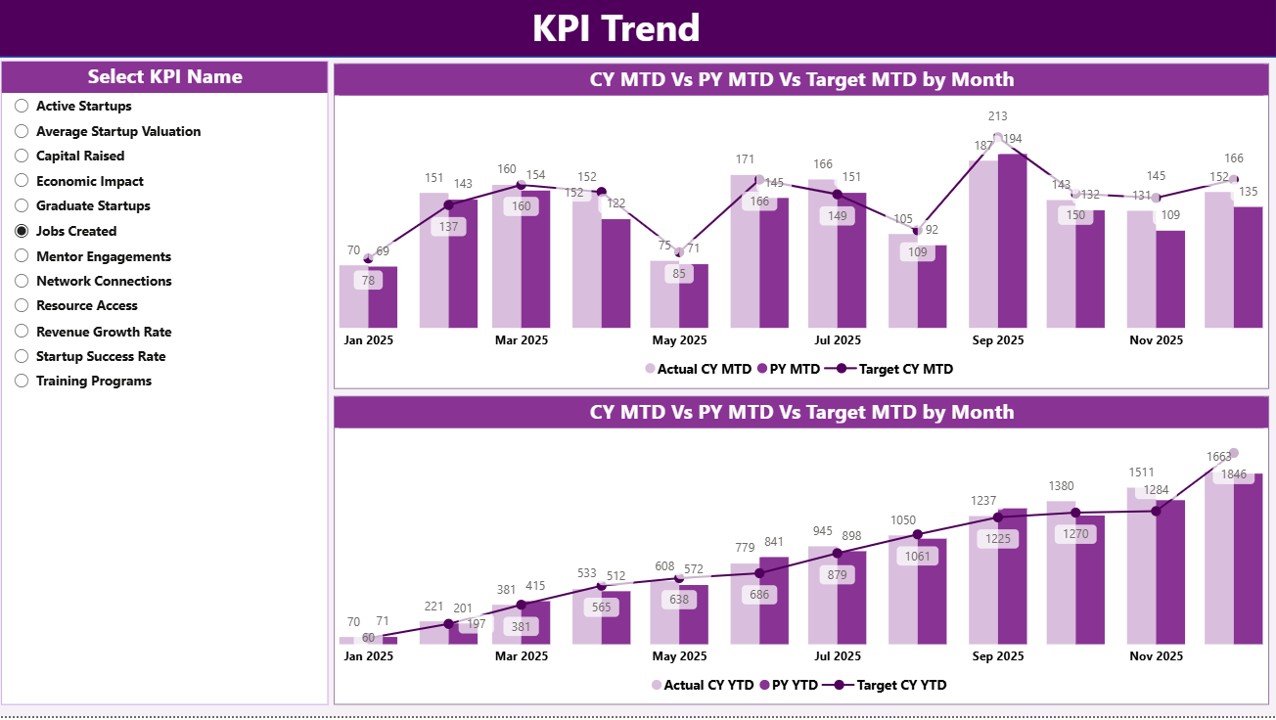
📈 KPI Trend Page – Performance Trend Analysis
The KPI Trend Page helps program managers analyze KPI performance trends over time.
This page includes:
• Two combo charts
• KPI selection slicer
KPI Selection Slicer
Users can select a specific KPI from the slicer. The charts update automatically.
MTD Trend Chart
The chart compares:
• Current Year Actual
• Previous Year Actual
• Target Values
YTD Trend Chart
The second chart analyzes long-term performance trends by comparing:
• Current Year YTD
• Previous Year YTD
• Target YTD
This page helps incubators identify performance gaps and growth trends.
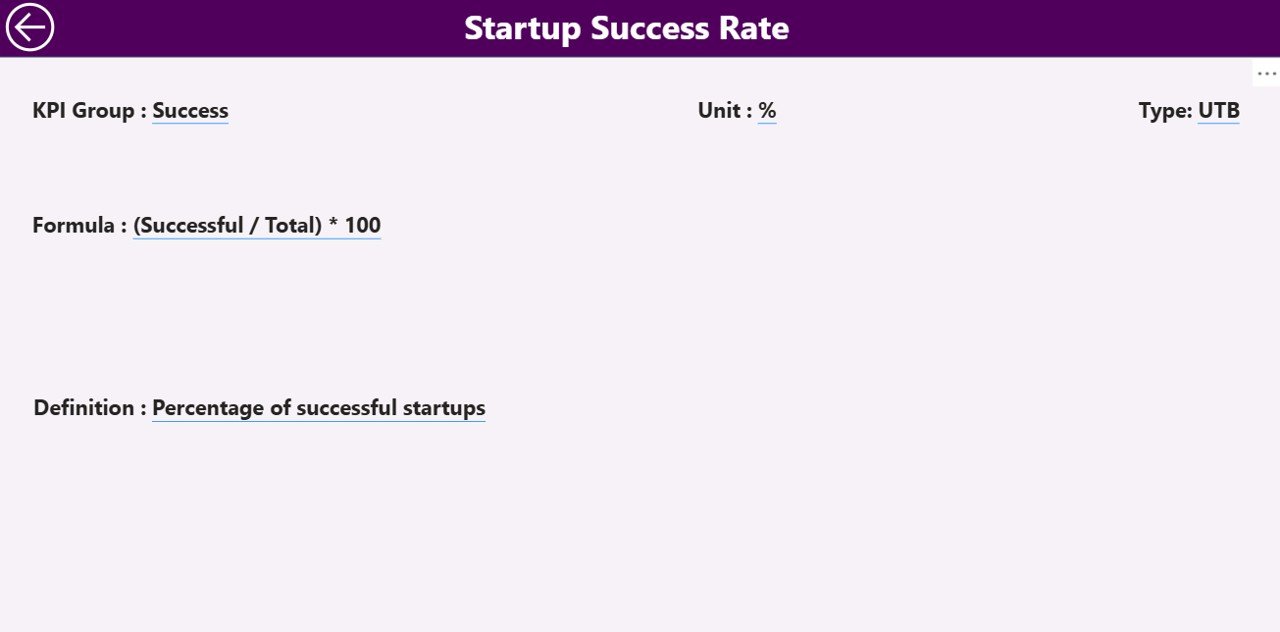
📘 KPI Definition Page – Detailed KPI Reference
The KPI Definition Page provides detailed explanations of each KPI.
It includes:
• KPI Formula
• KPI Definition
• KPI Unit
• KPI Group
• KPI Type (UTB or LTB)
Users can access this page through drill-through functionality.
Simply right-click a KPI on the Summary Page to view its detailed definition.
A Back Button allows users to return to the main dashboard.
⚙️ How to Use the Incubators and Accelerators KPI Dashboard
Using the dashboard is straightforward.
1️⃣ Enter KPI performance data into the Excel data source.
2️⃣ Update the Actual and Target KPI values for each month.
3️⃣ Refresh the Power BI dashboard.
4️⃣ Use slicers to analyze performance dynamically.
5️⃣ Monitor KPI trends and performance indicators.
Within seconds, organizations can convert raw startup program data into actionable insights.
👥 Who Can Benefit from This Dashboard
This dashboard is valuable for organizations involved in startup ecosystem development.
🚀 Startup Incubators
🏢 Startup Accelerators
🎓 University Innovation Centers
💼 Venture Capital Programs
🏛 Government Innovation Agencies
📊 Corporate Innovation Labs
These organizations gain better program monitoring, improved performance reporting, and stronger startup ecosystem insights.
### Click hare to read the Detailed blog post
Visit our YouTube channel to learn step-by-step video tutorials
https://youtube.com/@PKAnExcelExpert