Corruption continues to challenge governments, regulatory agencies, and investigative organizations worldwide. Fraud, bribery, misuse of public funds, and unethical activities can damage financial systems, reduce transparency, and weaken public trust. Therefore, organizations must continuously monitor corruption cases, track investigation progress, and evaluate financial recovery.
However, when corruption investigation data is stored across multiple spreadsheets, it becomes difficult to analyze patterns, measure investigation efficiency, and monitor financial impact. Decision-makers often struggle to identify which cases require urgent attention or which regions face higher corruption risks.
To solve this problem, we created the Anti-Corruption Units Dashboard in Excel — a powerful and ready-to-use Excel analytics solution designed to help organizations monitor corruption cases, evaluate investigation performance, and track financial recovery using interactive charts and KPI indicators.
This Excel dashboard converts complex corruption investigation data into clear and easy-to-understand visual insights. As a result, investigators, compliance teams, regulatory agencies, and policymakers can quickly identify corruption patterns, track investigation progress, and strengthen governance.
Because the dashboard is fully built in Excel, it is easy to use, easy to customize, and requires no advanced technical skills.
🔎 Key Features of Anti-Corruption Units Dashboard in Excel
📊 Comprehensive Investigation Monitoring
Track corruption cases, financial impact, recovery amounts, and case resolution status in one centralized dashboard.
📈 Interactive KPI Cards
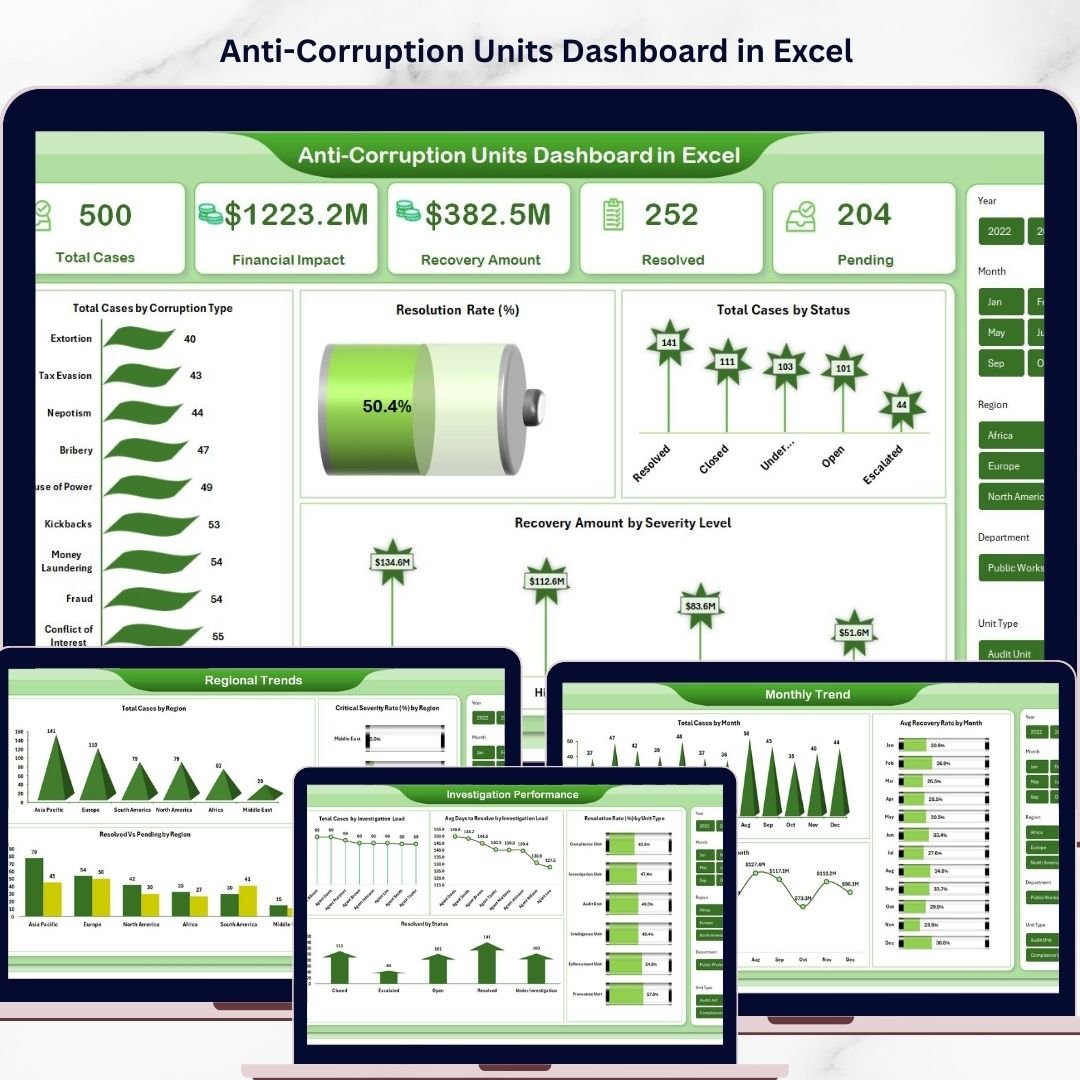
Instantly monitor key indicators such as Total Cases, Financial Impact, Recovery Amount, Resolved Cases, and Pending Cases.
🌍 Regional Corruption Insights
Identify high-risk corruption areas using region-based analysis and severity tracking.
🕵️ Investigation Performance Tracking
Evaluate investigation teams using metrics such as average days to resolve cases and resolution rates by unit type.
📅 Monthly Corruption Trend Analysis
Monitor how corruption cases, financial losses, and recovery rates change over time.
⚡ Fully Interactive Excel Dashboard
All charts update automatically when new data is added, allowing users to analyze corruption patterns quickly.
📂 What’s Inside the Anti-Corruption Units Dashboard in Excel
This ready-to-use dashboard includes multiple analytical sheets that help organizations analyze corruption investigations from different perspectives.
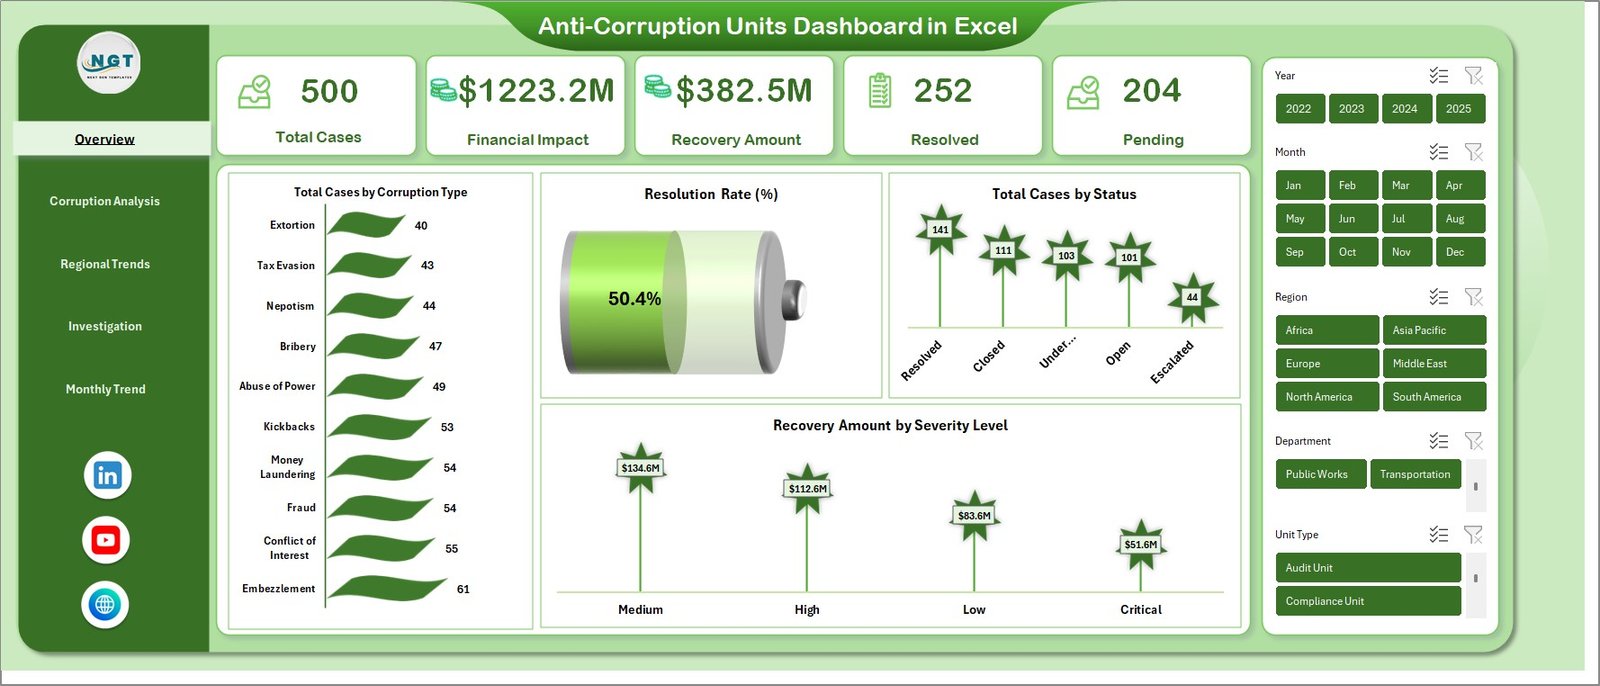
📊 Overview Sheet
The main dashboard page that provides a high-level summary of corruption investigations.
Key metrics displayed include:
Total Cases
Financial Impact
Recovery Amount
Resolved Cases
Pending Cases
The overview page also contains important analytical charts such as:
Total Cases by Corruption Type
Resolution Rate (%)
Total Cases by Status
Recovery Amount by Severity Level
📊 Corruption Analysis Sheet
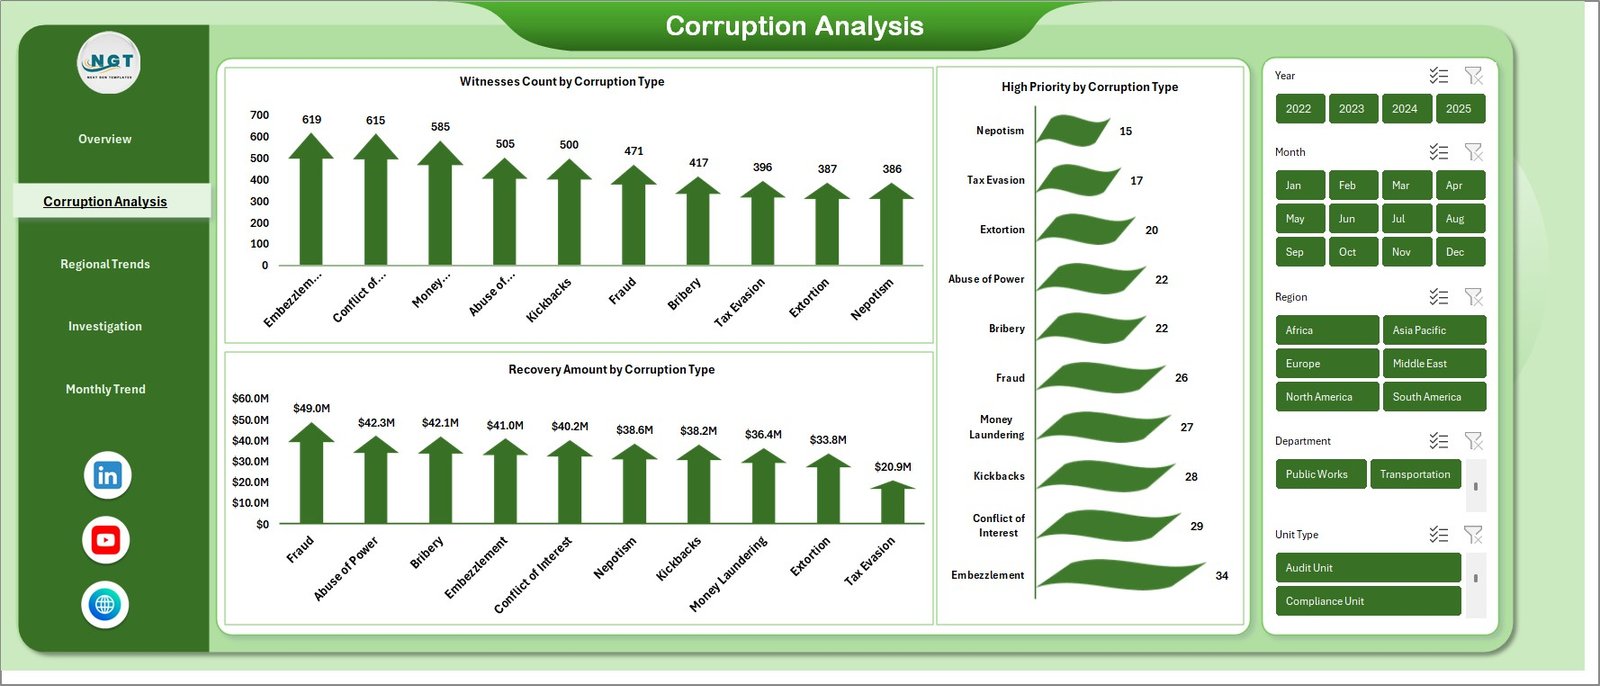
This sheet focuses on analyzing corruption categories and investigation details. It includes charts such as:
Witnesses Count by Corruption Type
High Priority Cases by Corruption Type
Recovery Amount by Corruption Type
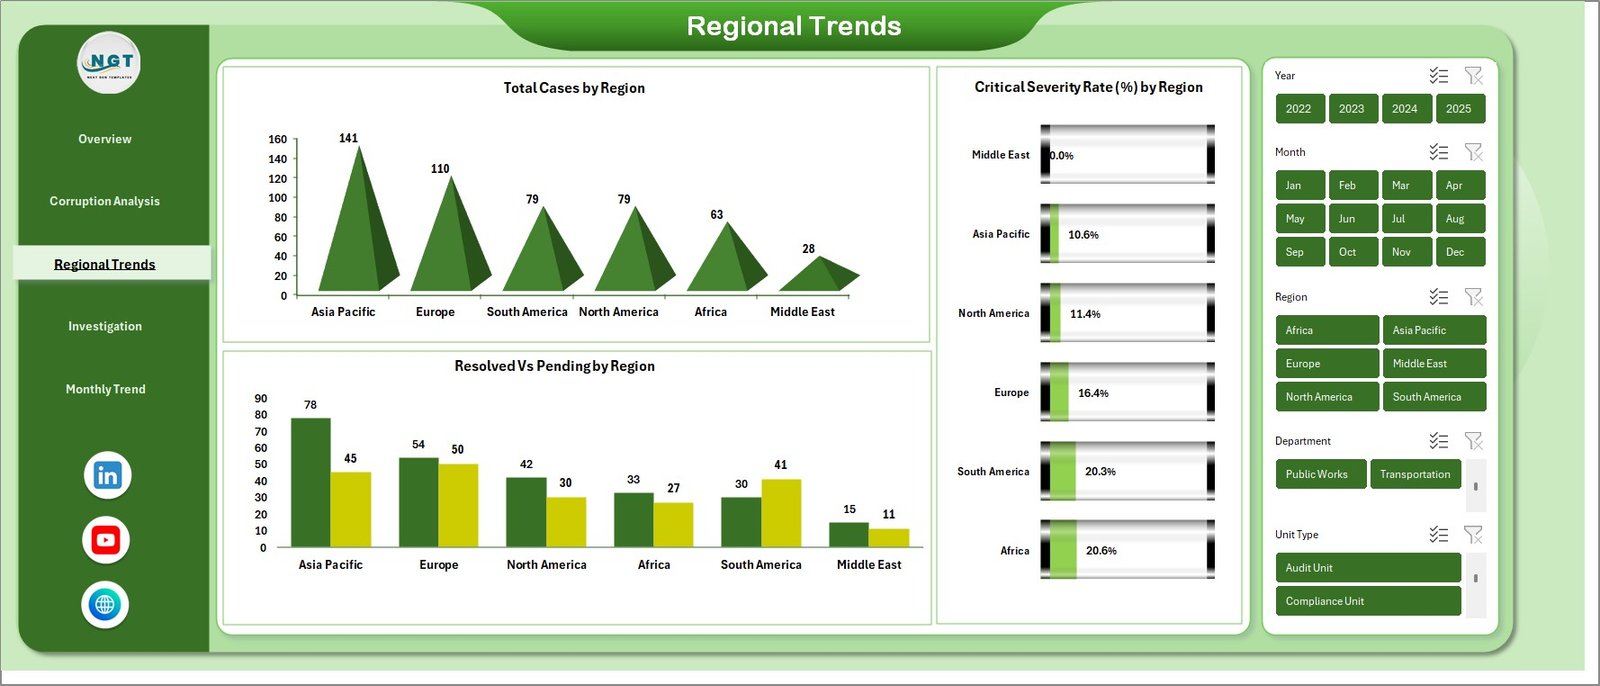
📊 Regional Trends Sheet
This sheet analyzes corruption activity across different geographic regions and includes charts like:
Total Cases by Region
Resolved vs Pending Cases by Region
Critical Severity Rate (%) by Region
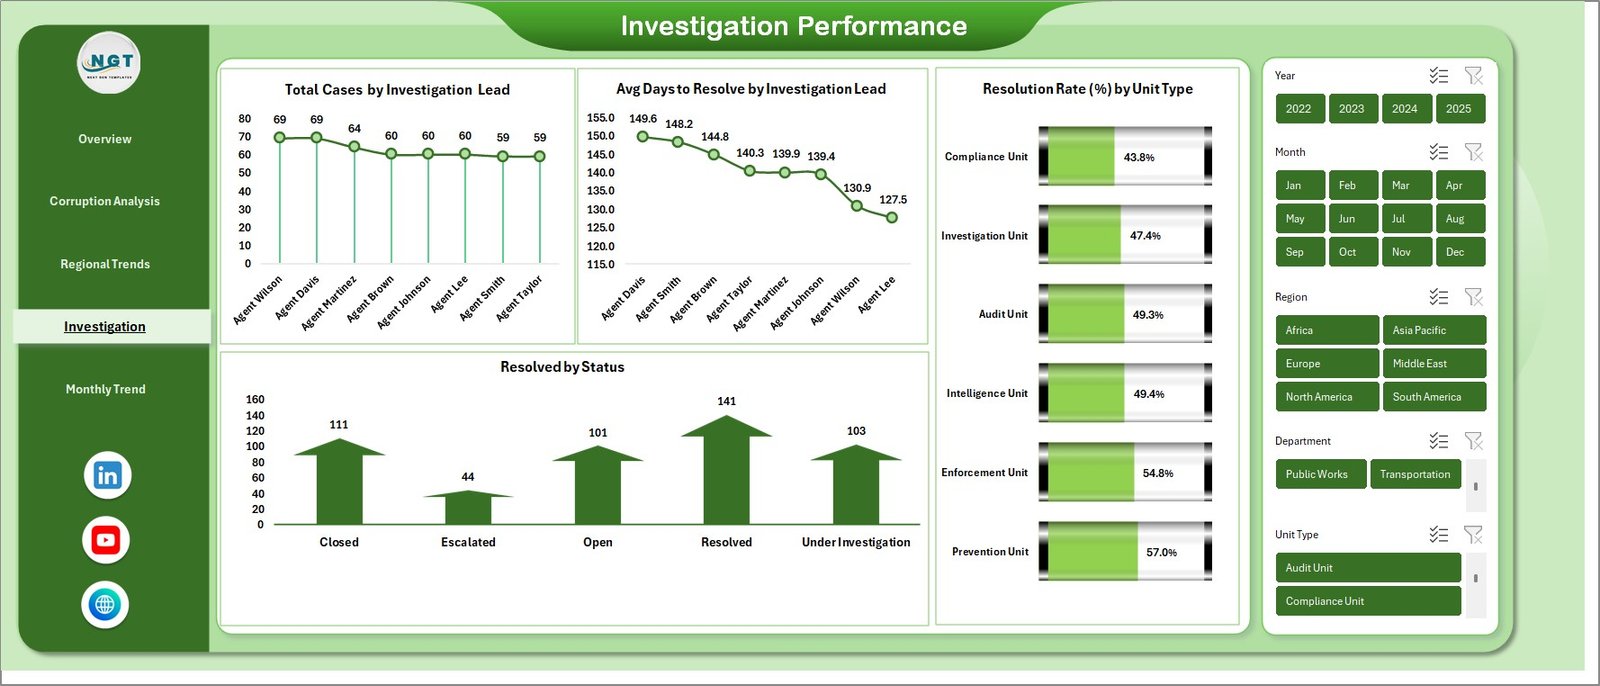
📊 Investigation Performance Sheet
This page evaluates investigator efficiency and team performance using metrics such as:
Total Cases by Investigation Lead
Average Days to Resolve Cases
Resolved Cases by Status
Resolution Rate (%) by Unit Type
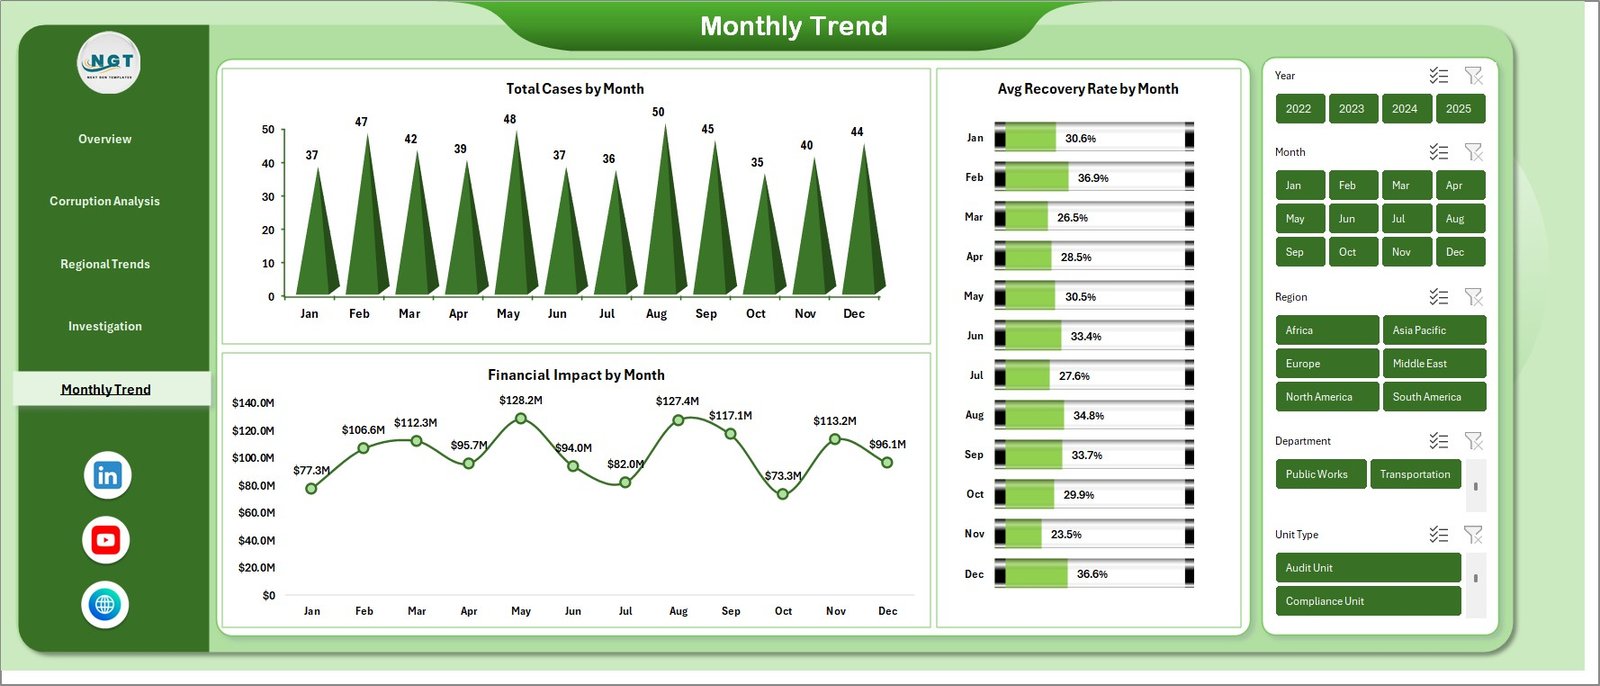
📊 Monthly Trends Sheet
This sheet helps organizations monitor corruption activities over time. Charts included:
Total Cases by Month
Financial Impact by Month
Average Recovery Rate by Month
⚙️ How to Use the Anti-Corruption Units Dashboard in Excel
Using this dashboard is simple and efficient.
1️⃣ Enter corruption case data in the provided Excel data sheet.
2️⃣ Update investigation details such as corruption type, region, severity level, and case status.
3️⃣ Refresh the dashboard charts.
4️⃣ Instantly analyze corruption trends, financial impact, and investigation performance.
Because the dashboard is interactive, all visualizations automatically update when new data is added.
👥 Who Can Benefit from This Anti-Corruption Units Dashboard
This dashboard is useful for many organizations that deal with corruption monitoring and investigations.
🏛 Government Anti-Corruption Agencies – Monitor corruption investigations and improve governance.
📊 Compliance Departments – Track unethical activities and ensure regulatory compliance.
🏦 Financial Regulators – Monitor financial crimes and analyze corruption risks.
🔍 Internal Audit Teams – Identify fraud patterns and improve accountability.
🕵️ Investigation Units – Track case progress and measure investigation performance.
Because the dashboard provides clear visual insights, organizations can strengthen transparency, improve decision-making, and recover financial losses more effectively.
Click here to read the Detailed blog post
Watch the step-by-step video tutorial: