Executive coaching has become a strategic priority for organizations that want to build strong leadership, improve management capabilities, and drive sustainable business growth. However, many companies struggle to measure the effectiveness of executive coaching programs because leadership development data is often scattered across multiple reports and spreadsheets.
The Executive Coaching KPI Dashboard in Power BI solves this challenge by providing a powerful and interactive business intelligence solution that transforms raw coaching data into meaningful insights.
This ready-to-use Power BI dashboard allows organizations to monitor leadership development progress, analyze coaching performance, compare targets versus actual results, and evaluate trends over time. With dynamic filters, KPI indicators, and visual analytics, decision-makers can quickly understand how coaching initiatives are performing.
Instead of manually reviewing large datasets, executives and HR teams can instantly monitor performance using interactive visuals and automated calculations. This dashboard helps organizations gain better visibility into coaching effectiveness and make data-driven decisions that improve leadership performance.
Whether you are an executive coach, HR leader, consulting firm, or corporate strategist, the Executive Coaching KPI Dashboard in Power BI helps you monitor coaching performance with clarity, accuracy, and powerful analytics.
🚀 Key Feature of Executive Coaching KPI Dashboard in Power BI
The Executive Coaching KPI Dashboard in Power BI offers advanced analytical capabilities that make leadership performance tracking simple and efficient.
📊 Interactive KPI Summary Dashboard
Monitor all coaching KPIs in a centralized dashboard using KPI cards, performance tables, and dynamic filters.
📅 Flexible Month Filtering
Analyze performance for specific time periods using an interactive Month slicer.
📂 KPI Group Filtering
Easily filter KPI performance by KPI category to focus on specific coaching metrics.
🎯 Target vs Actual KPI Comparison
Evaluate whether coaching KPIs are meeting expected targets using performance comparison metrics.
📈 Current vs Previous Year Analysis
Compare current leadership performance against previous year results to track improvement.
📉 MTD and YTD Performance Tracking
Monitor both Month-to-Date and Year-to-Date KPI metrics for deeper performance analysis.
📊 Visual KPI Performance Indicators
Green ▲ and Red ▼ icons instantly highlight whether KPIs meet or miss targets.
📉 Dynamic KPI Trend Charts
Combo charts show performance trends for Actual, Target, and Previous Year values.
📚 Detailed KPI Definitions Page
Access KPI formulas, definitions, measurement units, and KPI types for complete transparency.
📂 What’s Inside the Executive Coaching KPI Dashboard in Power BI
The dashboard includes three powerful analytical pages that provide complete visibility into coaching performance.
1️⃣ Summary Page
The Summary Page acts as the main performance monitoring dashboard.
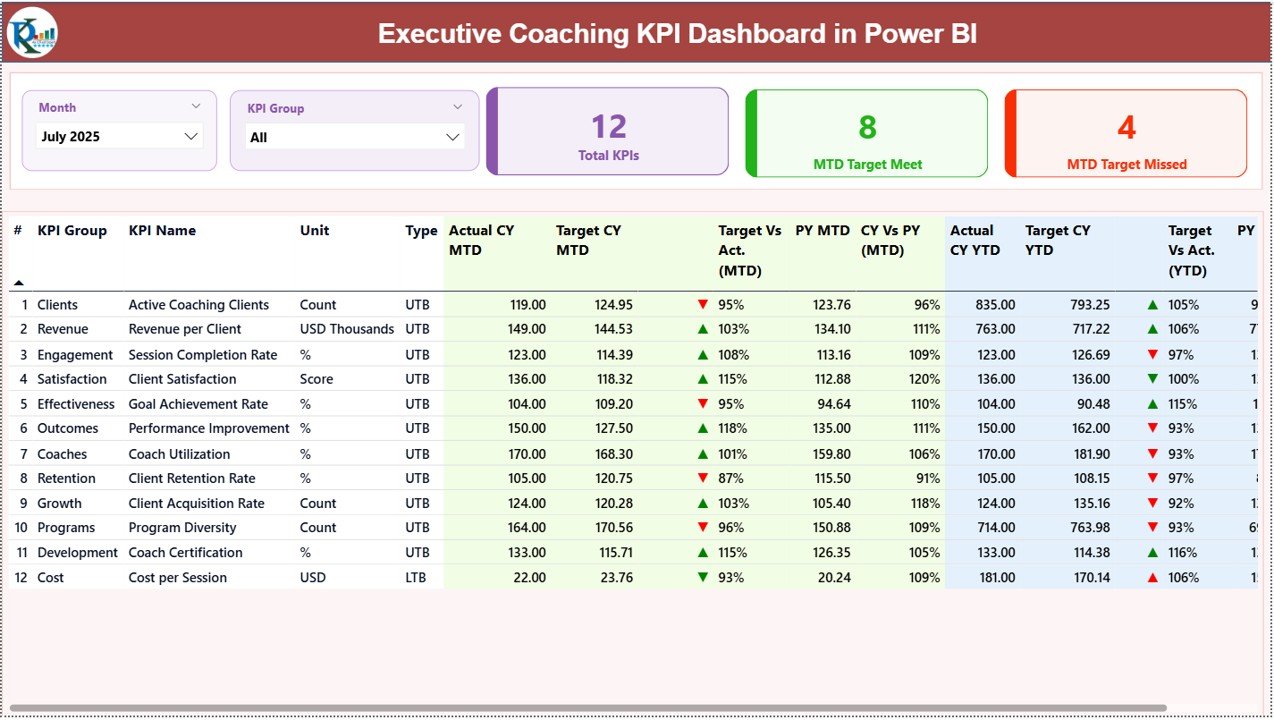
It includes two powerful slicers:
• Month slicer
• KPI Group slicer
These filters allow users to instantly analyze specific time periods and KPI categories.
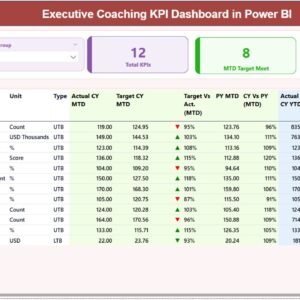
The page also contains three KPI cards that display:
• Total KPIs Count
• MTD Target Meet Count
• MTD Target Missed Count
Below the KPI cards, a detailed KPI performance table displays key metrics such as:
• Actual CY MTD
• Target CY MTD
• Previous Year MTD
• Target vs Actual comparison
• Current Year vs Previous Year comparison
Additionally, the dashboard includes YTD metrics such as:
• Actual CY YTD
• Target CY YTD
• PY YTD
• Target vs Actual YTD comparison
• CY vs PY YTD comparison
This layout allows managers to quickly evaluate short-term and long-term KPI performance.
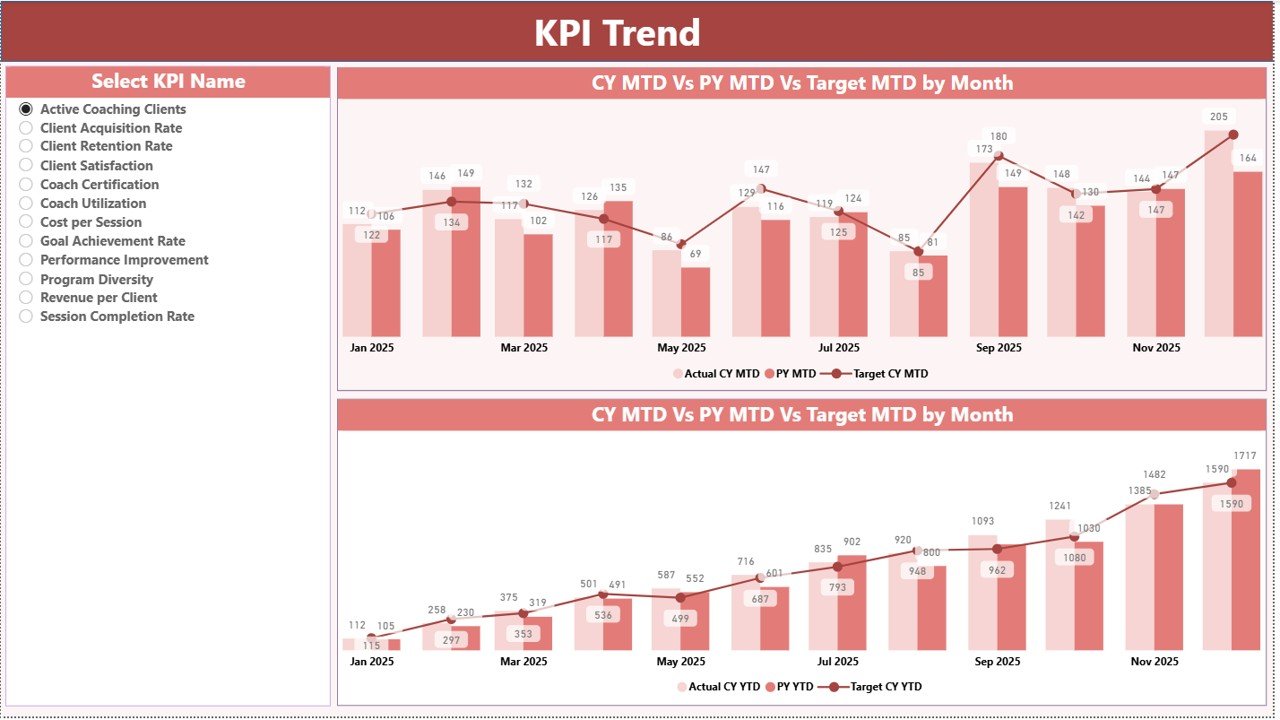
2️⃣ KPI Trend Page
The KPI Trend Page provides deeper insights into KPI performance over time.
Users can select a KPI from the KPI Name slicer, and the dashboard automatically updates the trend charts.
Two combo charts visualize KPI performance trends for:
• Month-To-Date (MTD)
• Year-To-Date (YTD)
These charts display:
• Current Year Actual values
• Previous Year Actual values
• Target values
This allows managers to analyze performance fluctuations and identify improvement opportunities.
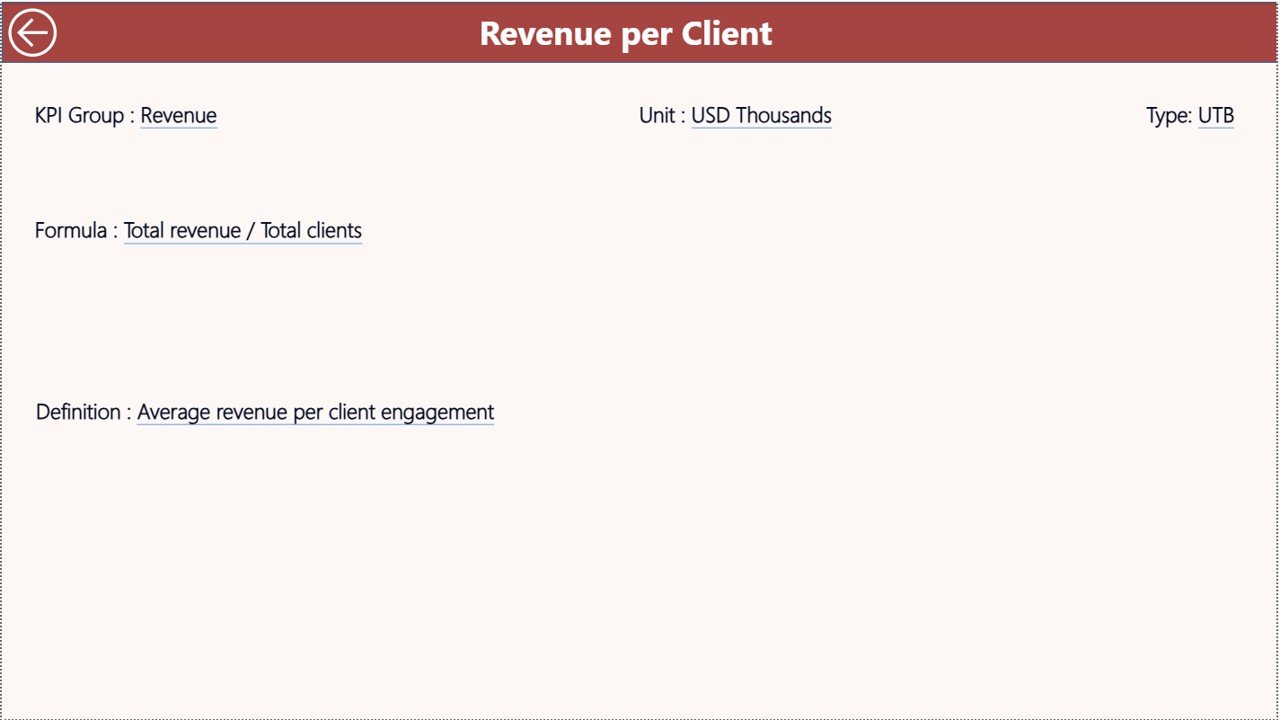
3️⃣ KPI Definition Page
The KPI Definition Page provides detailed information about each KPI.
This page contains information such as:
• KPI formula
• KPI definition
• KPI measurement unit
• KPI category
This page functions as a drill-through page, meaning users can access it directly from the summary dashboard.
A convenient Back button allows users to return to the main page easily.
⚙️ How to Use the Executive Coaching KPI Dashboard in Power BI
Using the dashboard is simple and requires only basic Power BI knowledge.
First, users need to input KPI data in the Excel data source file.
The dashboard connects to three Excel sheets:
• Input Actual Sheet – Stores actual KPI values for MTD and YTD.
• Input Target Sheet – Stores KPI target numbers.
• KPI Definition Sheet – Contains KPI details such as formula, definition, and type.
Once the data is updated, users simply refresh the Power BI dashboard to update all visuals automatically.
Managers can then use the dashboard slicers to filter KPIs, analyze trends, and evaluate coaching program performance.
👥 Who Can Benefit from This Executive Coaching KPI Dashboard
The Executive Coaching KPI Dashboard in Power BI is ideal for organizations that want to measure leadership development performance.
👨💼 Executive Coaches – Track leadership development progress and coaching outcomes.
🏢 Corporate Leadership Teams – Monitor coaching effectiveness and leadership growth.
📊 HR & Talent Development Teams – Evaluate the success of coaching programs.
📈 Consulting Firms – Deliver professional coaching analytics dashboards to clients.
🎓 Leadership Development Programs – Measure participant performance and engagement.
💼 Business Executives – Gain real-time insights into coaching ROI and leadership performance.
This dashboard helps organizations track coaching effectiveness, improve leadership development strategies, and drive better business results.
Click here to read the Detailed blog post
Visit our YouTube channel to learn step-by-step video tutorials
https://youtube.com/@PKAnExcelExpert