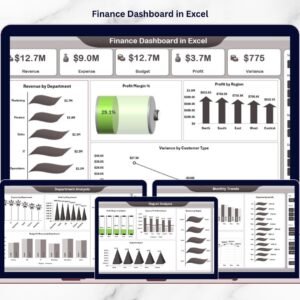
Managing finances should not feel complicated or time-consuming. Yet many businesses still struggle with scattered spreadsheets, manual calculations, and delayed financial reporting. When financial data is not centralized, decision-makers cannot clearly understand profitability, expenses, or budget performance.The Finance Dashboard in Excel is designed to solve this challenge by transforming complex financial data into clear, interactive, and actionable insights. This ready-to-use Excel dashboard helps organizations monitor revenue, expenses, budgets, profits, and performance trends from a single powerful interface.
Instead of preparing multiple financial reports every month, you can instantly analyze financial health using automated calculations, pivot charts, and dynamic analysis pages. Whether you are a finance professional, business owner, accountant, or analyst, this dashboard helps you make faster and smarter financial decisions.
Built entirely in Microsoft Excel, the dashboard requires no advanced technical setup. Simply update your data and watch the visuals refresh automatically.
🚀 Key Feature of Finance Dashboard in Excel
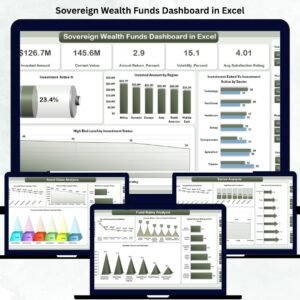
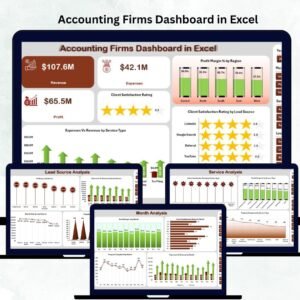
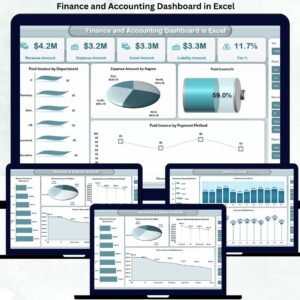
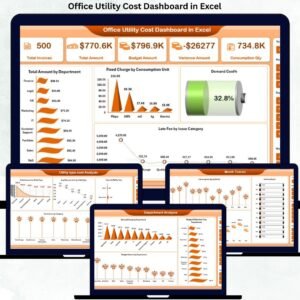
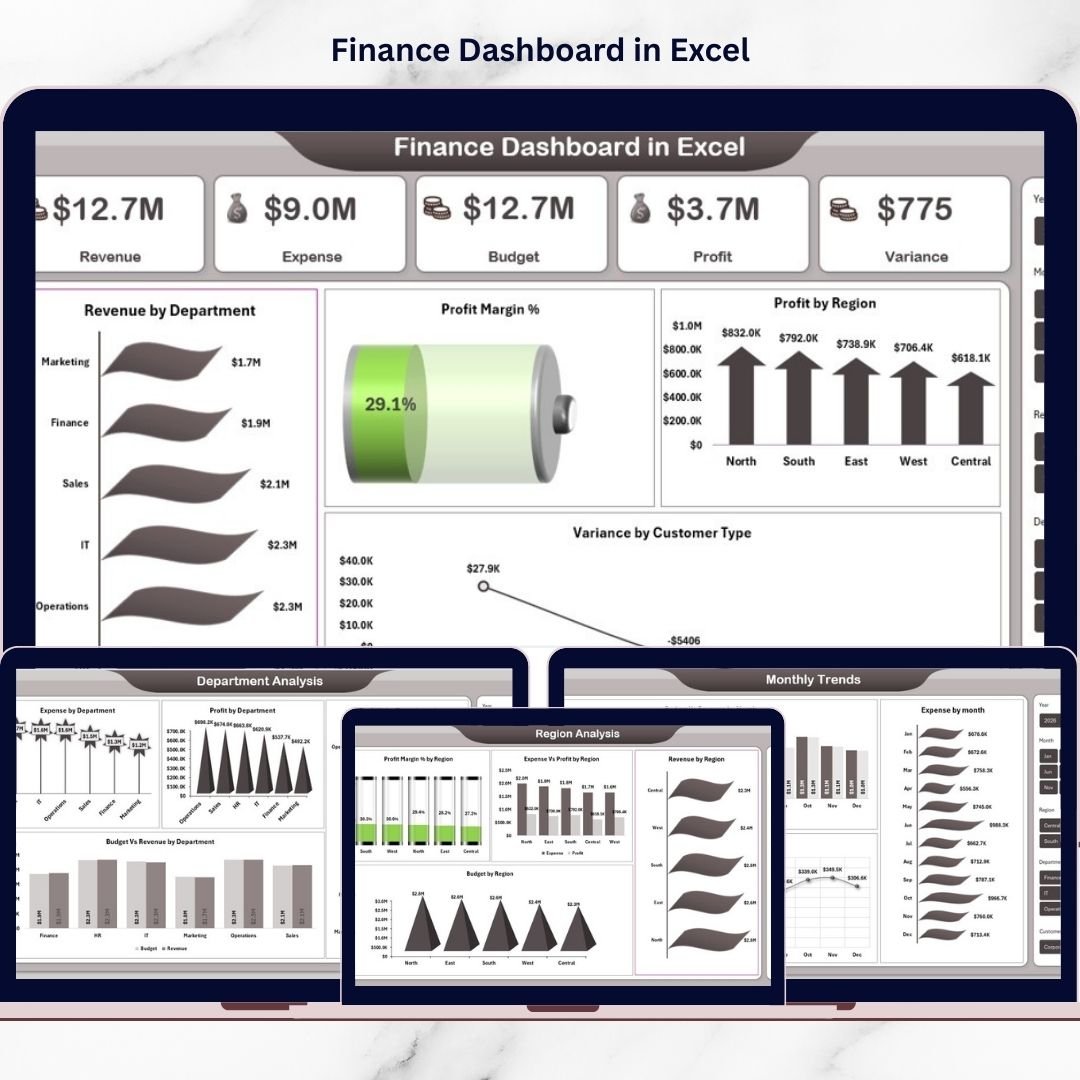
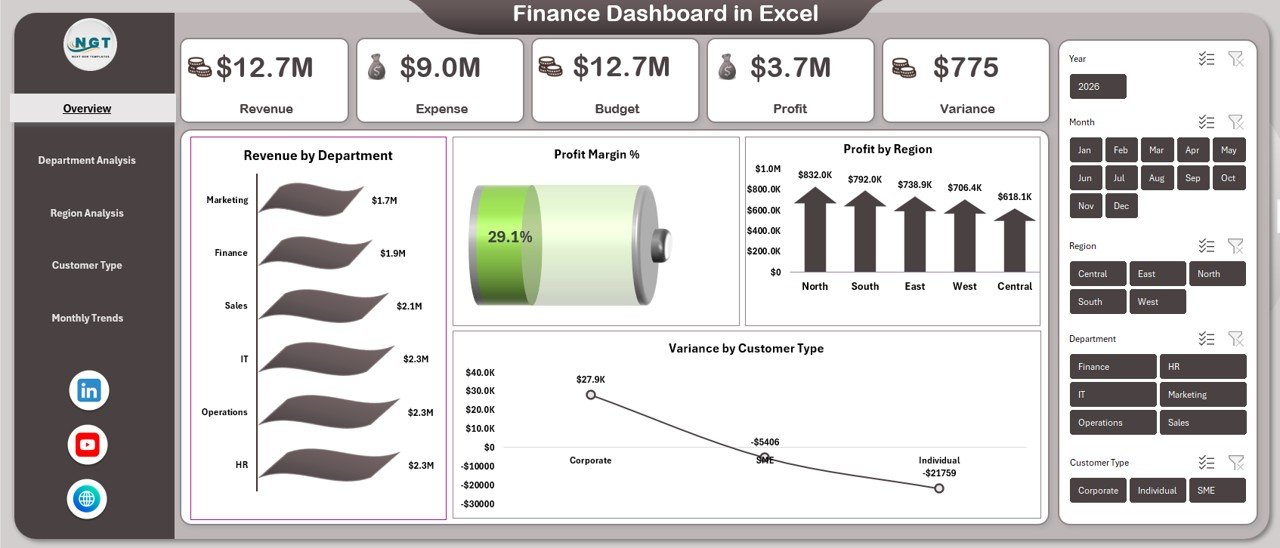
✨ Interactive financial overview displaying revenue, expense, budget, profit, and variance KPIs
📊 Multiple analytical pages for deep financial performance evaluation
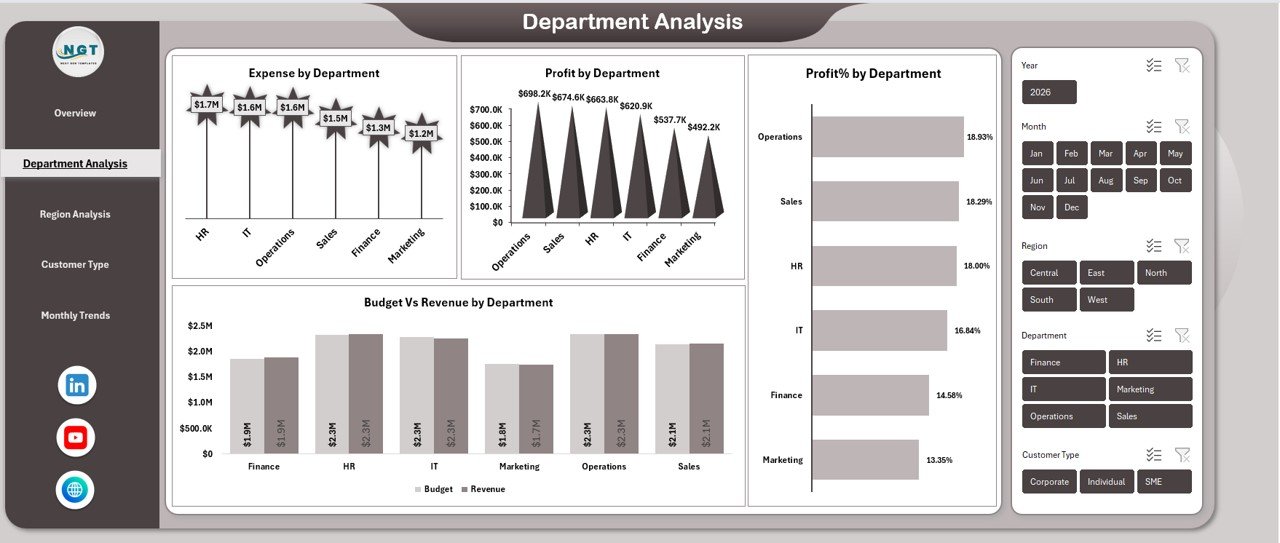
📍 Department-wise financial analysis for cost and profit tracking
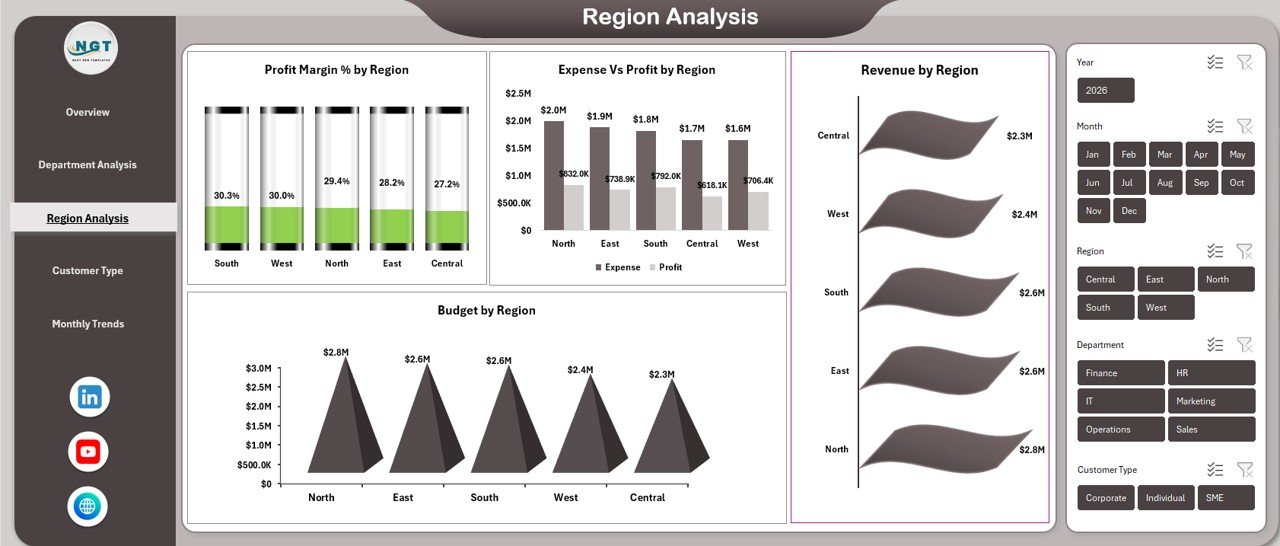
🌎 Region-based performance comparison for strategic planning
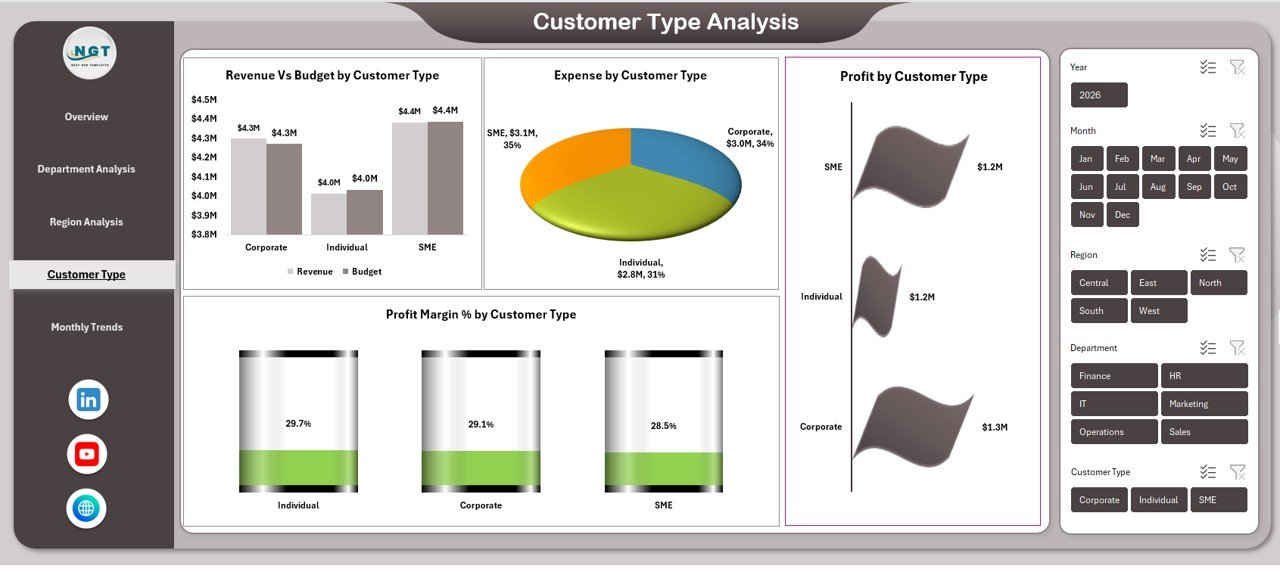
👥 Customer type profitability insights for better decision-making
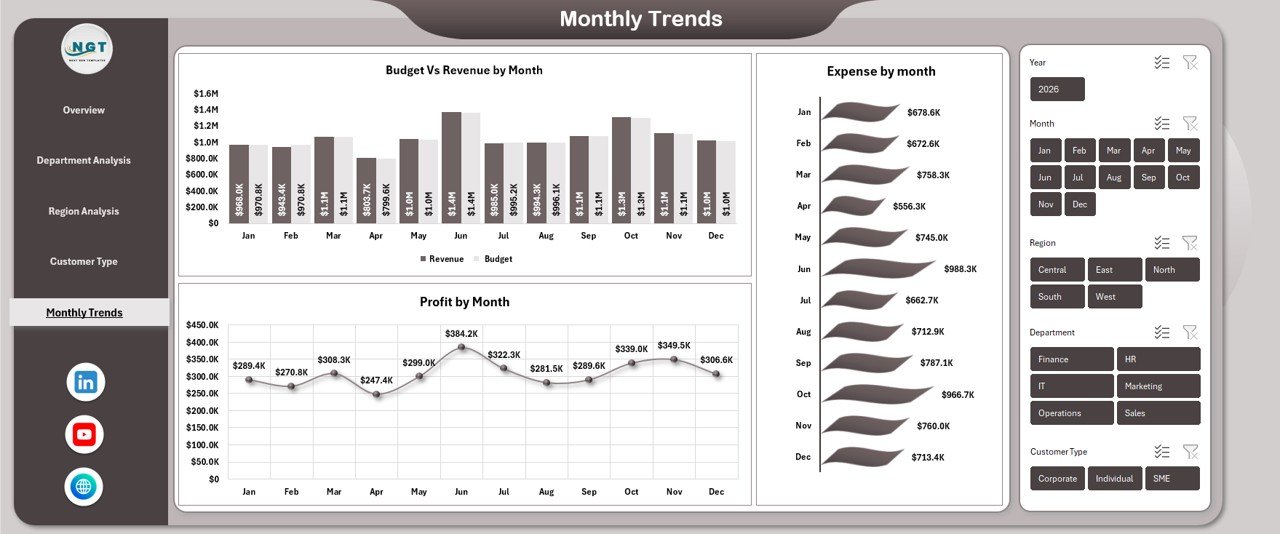
📈 Monthly trend analysis to monitor growth patterns
⚡ Pivot-table driven automation for quick reporting
🎯 Dynamic charts designed for executive-level presentations
🔍 Easy filtering and analysis using Excel slicers
💼 Fully customizable structure suitable for any industry
📦 What’s Inside the Finance Dashboard in Excel
This ready-to-use Excel template includes structured analytical sheets designed for complete financial visibility:
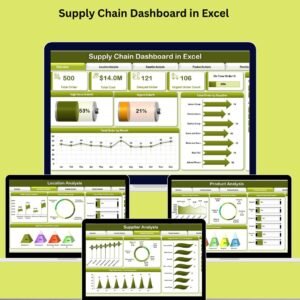
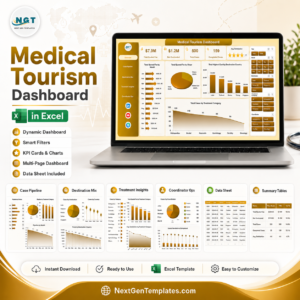
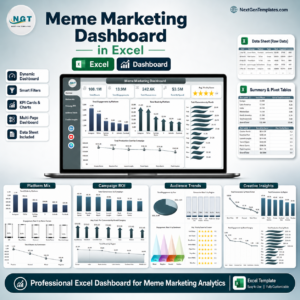
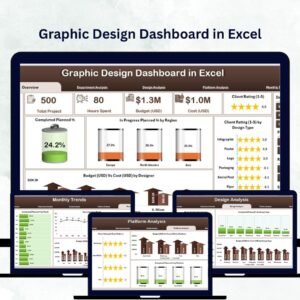
✅ Overview Dashboard – High-level financial performance summary with key KPIs and charts.
✅ Department Analysis Sheet – Tracks departmental expenses, profits, and efficiency.
✅ Region Analysis Sheet – Compares financial results across locations.
✅ Customer Type Analysis – Identifies the most profitable customer segments.
✅ Monthly Trends Sheet – Displays financial performance over time for forecasting insights.
Each sheet uses pivot tables and pivot charts, ensuring accurate and fast analysis without manual effort.
⚙️ How to Use the Finance Dashboard in Excel
Using the dashboard is simple and beginner-friendly:
1️⃣ Enter or paste your financial data into the data sheet.
2️⃣ Refresh pivot tables with one click.
3️⃣ Use slicers to filter departments, regions, or periods.
4️⃣ Instantly analyze KPIs and charts.
5️⃣ Present insights directly to management teams.
No advanced Excel skills are required. The dashboard is structured to help users start analyzing immediately.
👨💼 Who Can Benefit from This Finance Dashboard in Excel
💰 Finance Teams – Monitor profitability and budget performance efficiently.
📊 Business Owners – Track overall financial health instantly.
🧾 Accountants – Simplify reporting and financial reviews.
📈 Financial Analysts – Perform trend and variance analysis quickly.
🏢 Department Managers – Evaluate operational cost efficiency.
🚀 Startups & SMEs – Gain enterprise-level financial insights at low cost.
This dashboard supports organizations of all sizes looking to adopt data-driven financial management.
A well-designed finance dashboard converts numbers into meaningful business intelligence. By combining automated calculations, structured KPIs, and interactive visuals, this Excel template enables faster reporting, improved cost control, and better profitability planning.
Instead of reacting to financial problems late, organizations can proactively monitor performance and take timely action.
Click here to read the Detailed blog post
Watch the step-by-step video tutorial: