
Field service businesses live and die by response time, technician efficiency, and customer satisfaction. If you cannot see performance clearly, you cannot improve it.
Still using disconnected spreadsheets to track service calls, revenue, and technician productivity? That’s costing you time and money.
Introducing the Field Service KPI Dashboard in Google Sheets — a ready-to-use, structured performance tracking system designed specifically for field service operations.
This powerful dashboard centralizes technician performance, SLA compliance, revenue tracking, cost control, and operational KPIs — all in one dynamic Google Sheets file.
No complex software. No manual consolidation. Just smart, organized reporting.
🚀 Key Feature of Field Service KPI Dashboard in Google Sheets
📊 6 Structured Worksheets – Organized performance monitoring system with clear data flow.
📅 Dynamic Month Selection (Cell D3) – Instantly switch between months for analysis.
🎯 MTD & YTD Tracking – Monitor both short-term and cumulative performance.
📈 Target vs Actual Comparison – Identify service gaps immediately.
🔄 Previous Year Benchmarking – Measure growth trends and improvement.
📉 Conditional Formatting Arrows – Visual up/down indicators for quick interpretation.
🧑🔧 Technician Productivity Insights – Monitor utilization and service efficiency.
💰 Revenue & Cost Monitoring – Maintain financial control across operations.
📦 What’s Inside the Field Service KPI Dashboard in Google Sheets
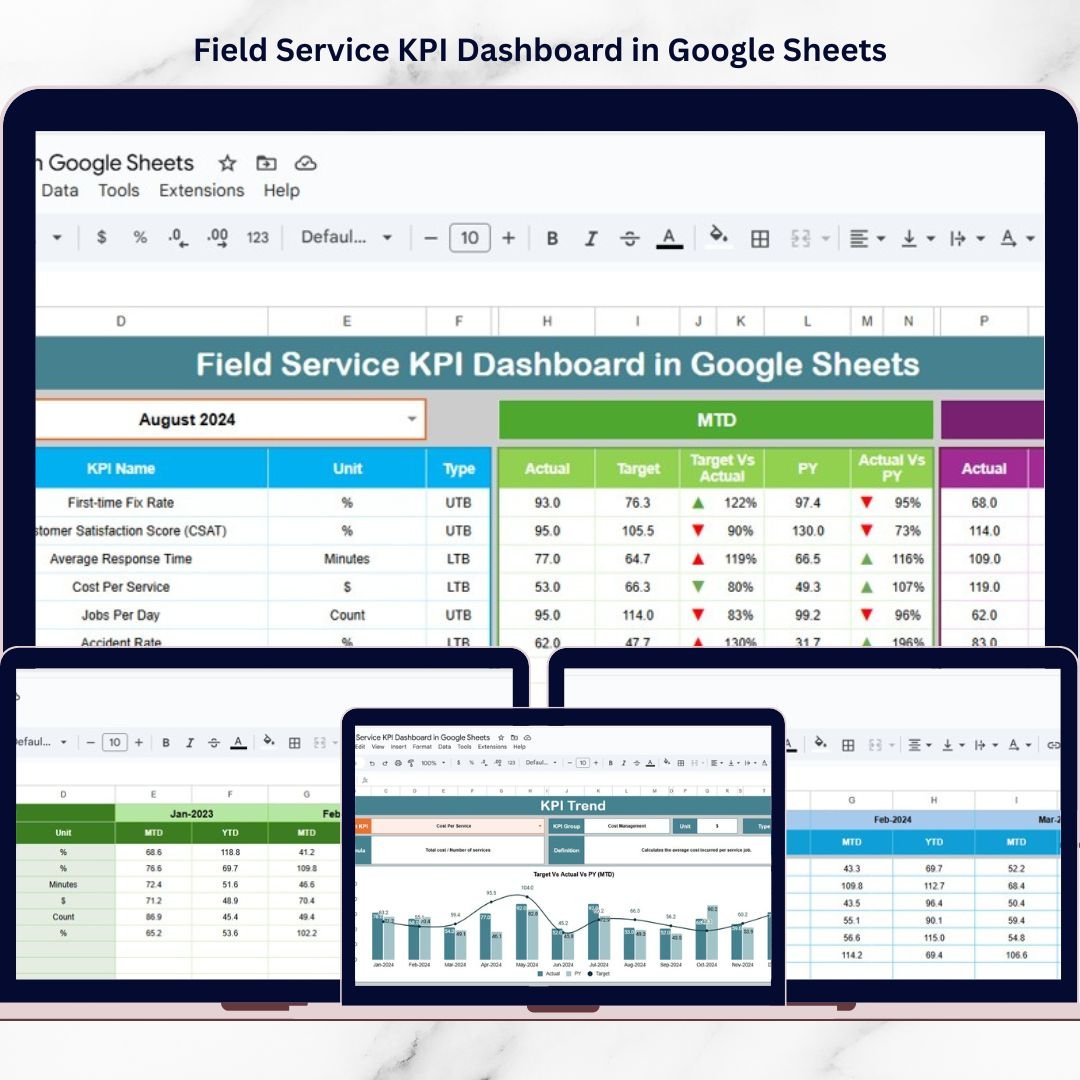
This ready-to-use Google Sheets dashboard includes 6 structured worksheets:
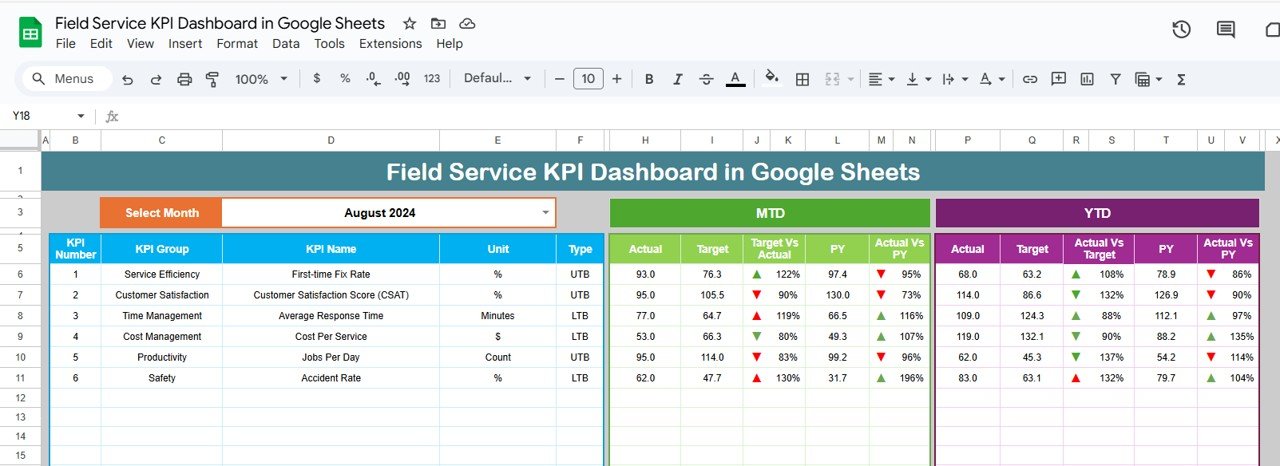
1️⃣ Dashboard Sheet (Main Page)
The central performance monitoring page includes:
Month selection dropdown in Cell D3
MTD vs Target vs Previous Year comparison
YTD vs Target vs Previous Year comparison
Target vs Actual % variance
Previous Year vs Actual % growth
Conditional formatting arrows for performance signals
This page gives managers instant clarity on operational performance.
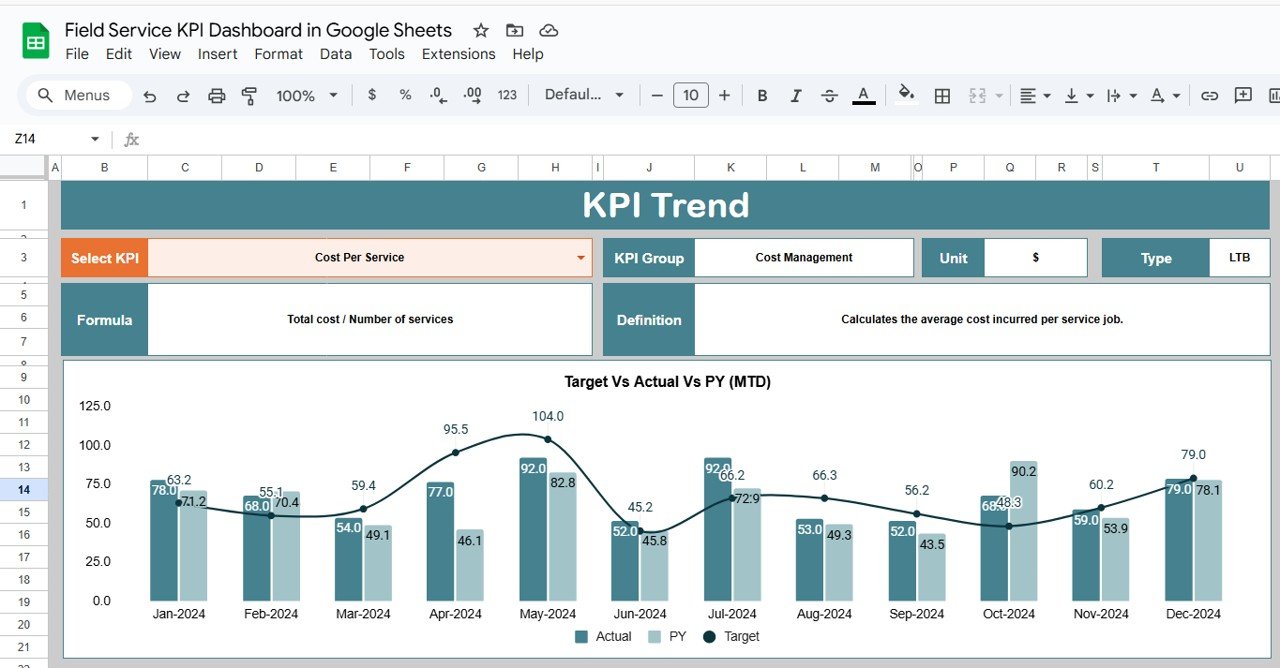
2️⃣ KPI Trend Sheet
Deep KPI analysis page where you can:
Select KPI from dropdown
View KPI Group
Check KPI Unit
See KPI Type (LTB / UTB)
Review KPI Formula
Read KPI Definition
Analyze monthly trend chart
Perfect for identifying long-term performance patterns.
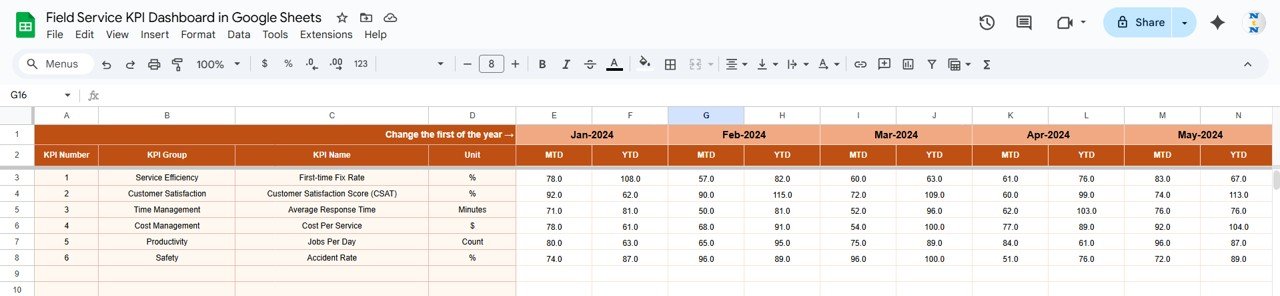
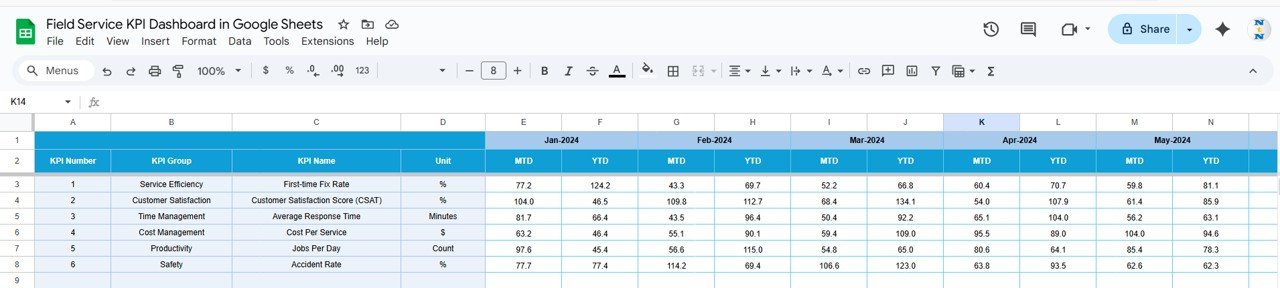
3️⃣ Actual Number Sheet
Structured data entry page where you:
Enter first month in Cell E1
Input MTD values
Allow YTD values to calculate (based on cumulative logic)
Clean structure ensures automatic dashboard updates.
4️⃣ Target Sheet
Define performance benchmarks by entering:
Monthly MTD targets
YTD cumulative targets
Helps align service goals with business strategy.
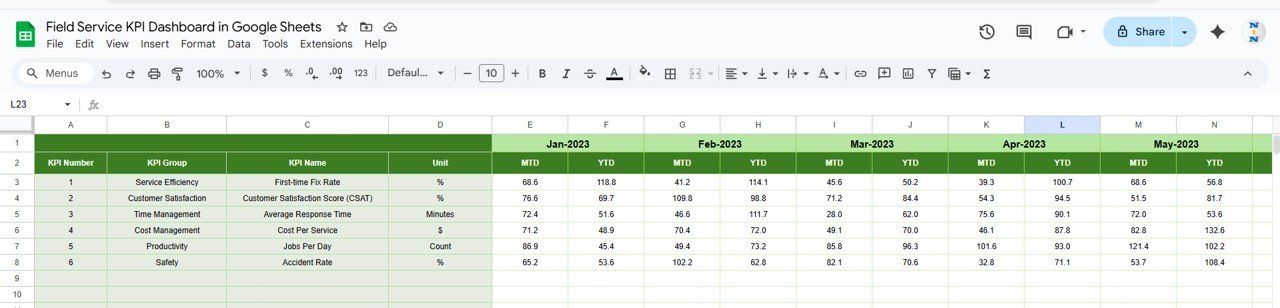
5️⃣ Previous Year Number Sheet
Enter historical data to compare:
Previous Year MTD
Previous Year YTD
Supports year-over-year growth tracking.
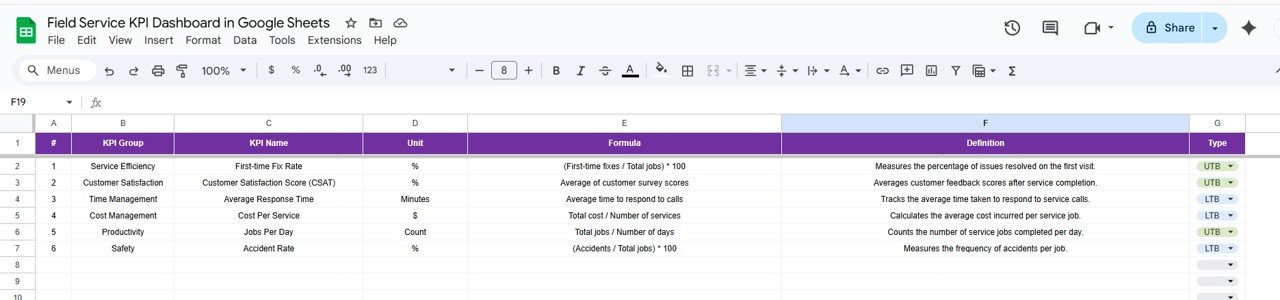
6️⃣ KPI Definition Sheet
Central documentation sheet including:
KPI Name
KPI Group
Unit
Formula
Definition
Type (Lower the Better / Upper the Better)
Ensures reporting consistency and clarity across teams.
🛠 How to Use the Field Service KPI Dashboard in Google Sheets
Using the dashboard is simple:
1️⃣ Enter monthly MTD data in the Actual Sheet.
2️⃣ Update targets in the Target Sheet.
3️⃣ Add previous year data in the PY Sheet.
4️⃣ Select the month from Cell D3 on the Dashboard.
5️⃣ Review KPI arrows and variance percentages.
6️⃣ Use KPI Trend Sheet for detailed analysis.
Because everything updates dynamically, reporting becomes fast and accurate.
👥 Who Can Benefit from This Field Service KPI Dashboard in Google Sheets
✔ Field Service Managers
✔ Facility Management Companies
✔ HVAC Service Providers
✔ IT Support Teams
✔ Telecom Field Operations
✔ Maintenance Service Organizations
✔ Operations & Finance Managers
Whether you manage 10 technicians or 500, this dashboard brings structure to your performance tracking.
Why This Dashboard Is a Game-Changer
Instead of manually compiling reports, you analyze results instantly.
Instead of guessing technician performance, you measure productivity clearly.
Instead of reacting to SLA violations late, you detect issues early.
From response time and first-time fix rate to revenue per job and technician utilization — every KPI becomes visible, measurable, and actionable.
If you want improved service quality, stronger financial control, and faster decision-making, this dashboard delivers exactly that.
Click here to read the Detailed blog post
Watch the step-by-step video tutorial:
Visit our YouTube channel to learn step-by-step video tutorials
👉 YouTube Channel – NeotechNavigators
Compatibility and Requirements
- Works in Google Sheets. You need a free Google account and a web browser.
- You pick the month from a dropdown in cell D3 of the Dashboard sheet. Google explains dropdowns in Create an in-cell dropdown list.
More Questions About This Template
How many sheets does the template have?
Six sheets: Dashboard, KPI Trend, Actual Number, Target, Previous Year Number and KPI Definition.
How do I switch between months?
Select the month from the dropdown in cell D3 of the Dashboard sheet. The MTD and YTD figures, the target and previous year comparisons and the variance percentages update for that month.
Where do I enter my data?
Enter the first month in cell E1 of the Actual Number sheet and add your MTD values. Put your goals in the Target sheet and last year’s figures in the Previous Year Number sheet.
Does it compare results with targets and with last year?
Yes. The Dashboard shows MTD and YTD against target and against the previous year, with percentage variance and conditional formatting arrows that show whether a KPI is up or down.
Is there an Excel or Power BI version?
Yes. See the Field Service KPI Dashboard in Excel and the Field Service KPI Dashboard in Power BI.
Related Service KPI Templates
- Field Service KPI Dashboard in Excel: the same field service KPIs in Excel
- Field Service KPI Dashboard in Power BI: the Power BI edition
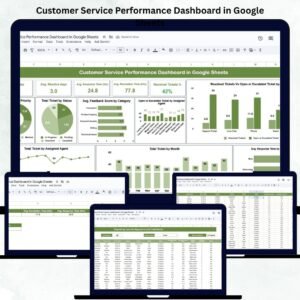
- Customer Service Performance Dashboard in Google Sheets: service metrics for support teams
- IT Services Dashboard in Google Sheets: a dashboard for IT service teams
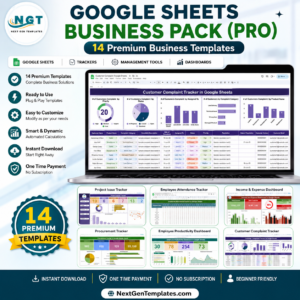
- Google Sheets Business Pack (Pro): 14 business templates in one download
Browse all Google Sheets KPI dashboards.