The paper and pulp industry operates on thin margins, high energy consumption, and strict cost control. One spike in waste. One increase in raw material price. One inefficient shift. And profitability drops fast.
If your reporting still depends on scattered spreadsheets, you are reacting late instead of acting early.
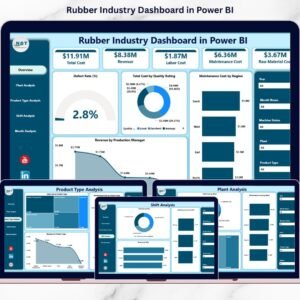
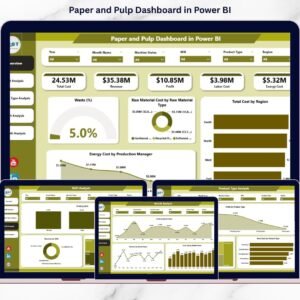
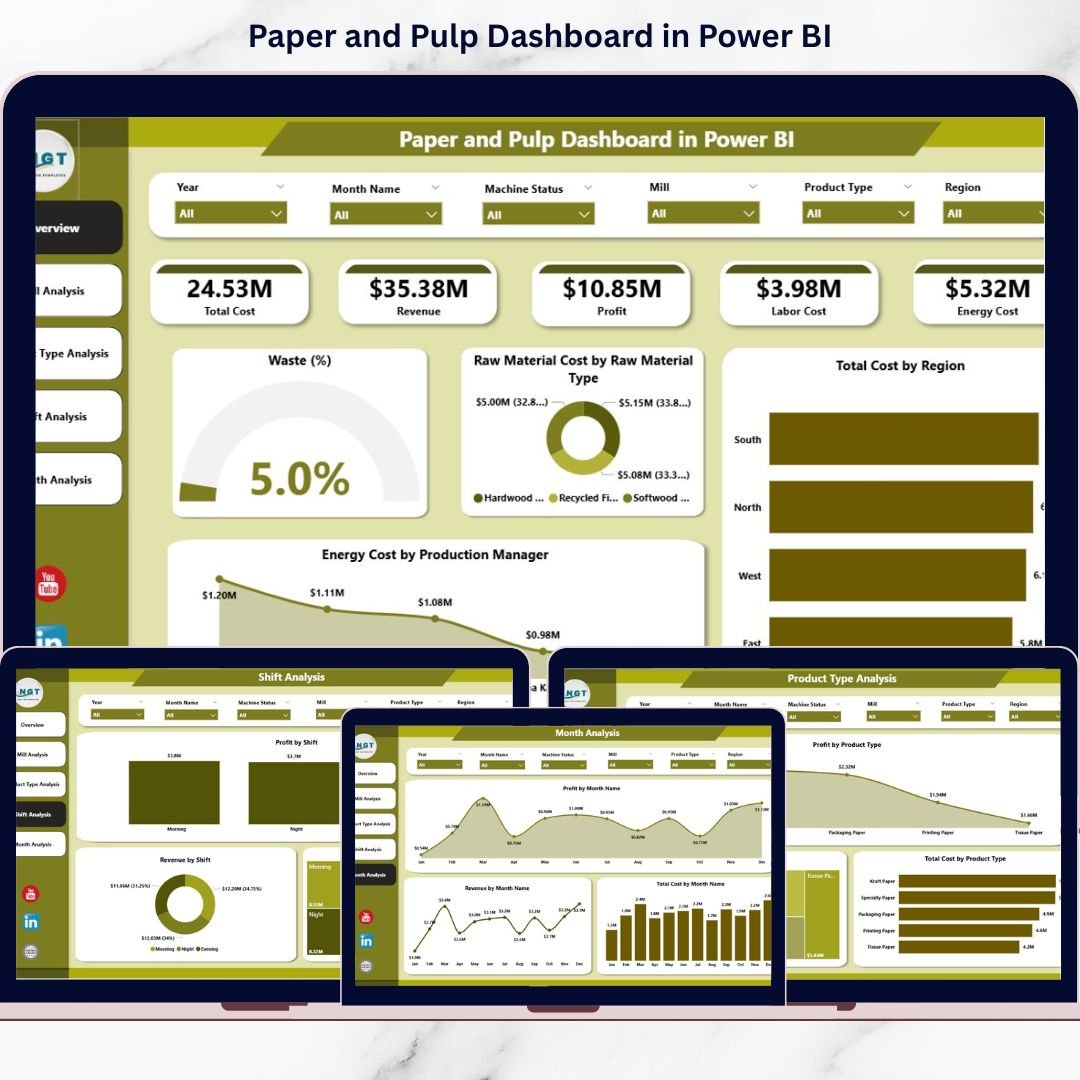
That’s where the Paper and Pulp Dashboard in Power BI becomes a game-changer. 📊🏭
This ready-to-use Power BI solution transforms raw production and financial data into interactive, real-time insights. You can track waste %, raw material cost, energy expenses, regional performance, mill profitability, and shift efficiency — all in one centralized dashboard.
🚀 Key Features of Paper and Pulp Dashboard in Power BI
📊 5 Fully Interactive Dashboard Pages – Overview, Mill, Product Type, Shift, and Month Analysis
📈 Executive KPI Cards – Instant snapshot of cost, waste, and profit
🏭 Mill-Level Profitability Tracking – Compare performance across locations
📦 Product Profit Analysis – Identify high-margin product categories
⚡ Energy & Waste Monitoring – Detect cost leakage early
👨🏭 Shift Performance Insights – Optimize workforce productivity
📅 Monthly Trend Analysis – Forecast cost and profit movements
🎛 Dynamic Slicers & Drill-Down – Filter by Region, Mill, Shift, Product & Month
🔄 Real-Time Data Refresh – Always work with updated information
📦 What’s Inside the Paper and Pulp Dashboard in Power BI
This Power BI Desktop file includes 5 structured analytical pages designed specifically for paper manufacturing operations.
1️⃣ Overview Page – The Executive Command Center
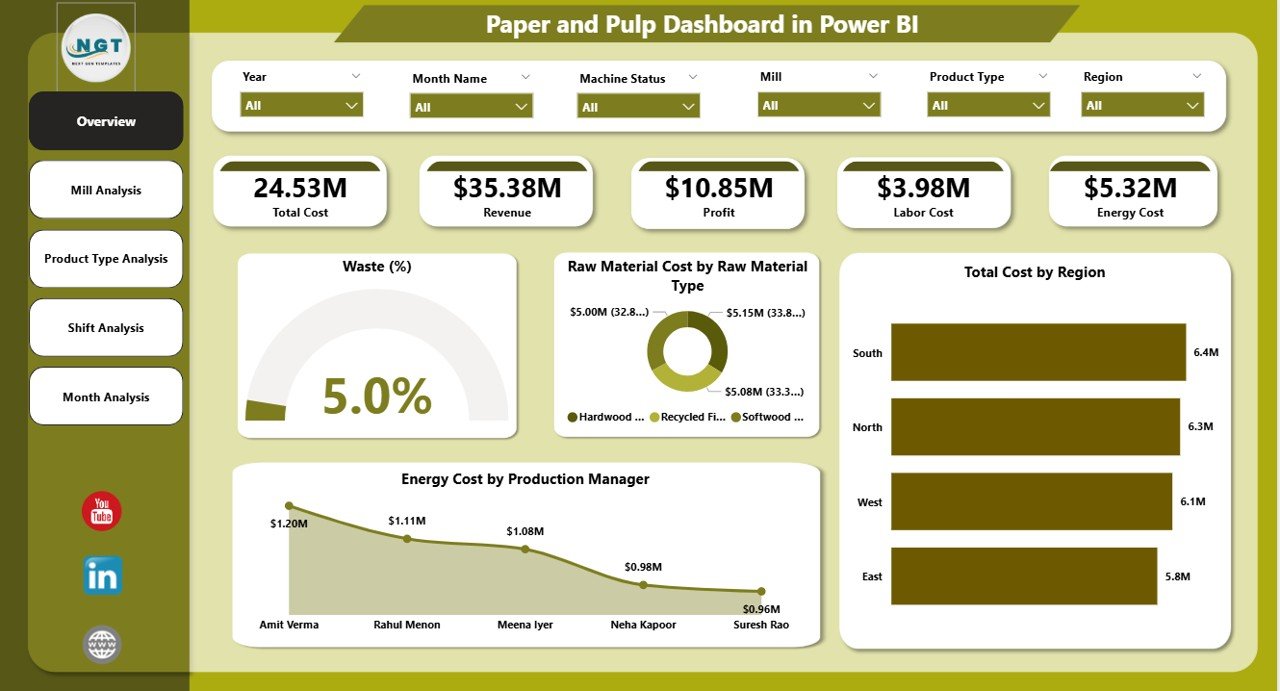
The Overview page delivers a complete operational snapshot.
✔ Interactive Slicers
-
Region
-
Mill
-
Production Manager
-
Product Type
-
Shift
-
Month
✔ KPI Cards
-
Waste %
-
Raw Material Cost by Raw Material Type
-
Total Cost by Region
-
Energy Cost by Production Manager
-
Overall Profit / Revenue Summary
✔ Core Insights
-
Identify high waste levels instantly
-
Detect expensive raw material categories
-
Compare regional cost structures
-
Evaluate energy efficiency across managers
Executives can assess plant health within seconds.
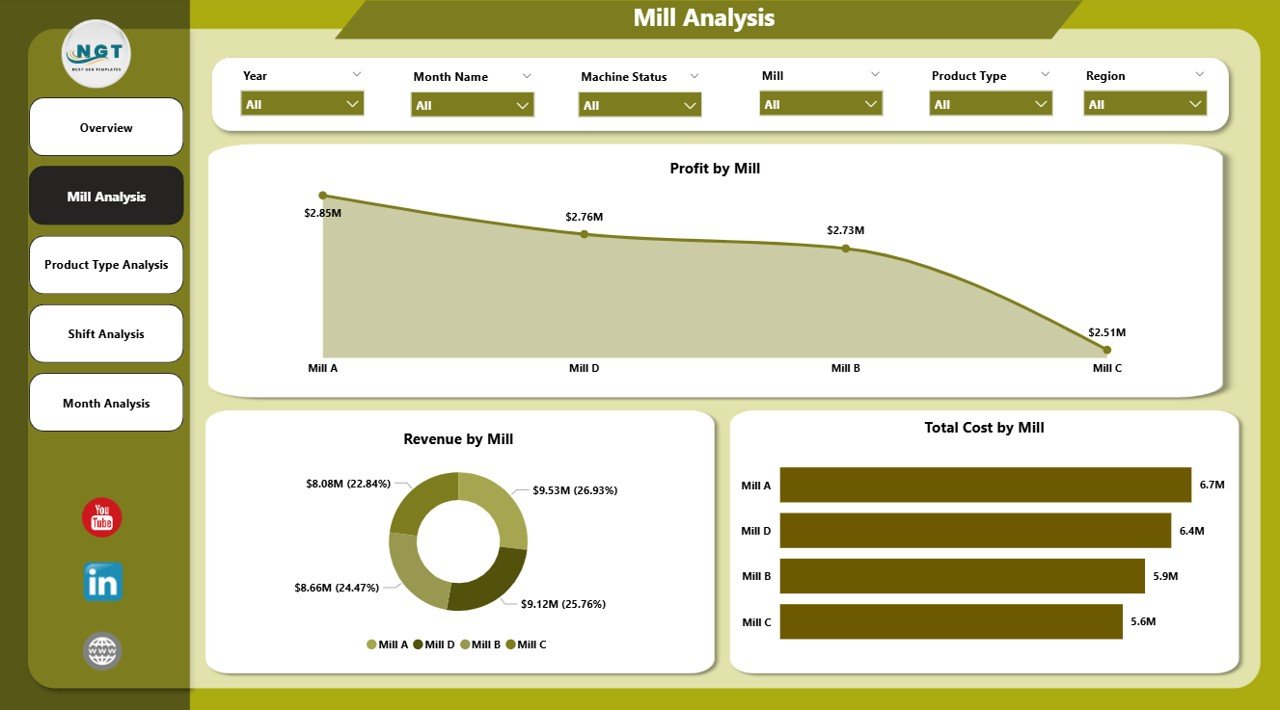
2️⃣ Mill Analysis – Compare Multi-Mill Performance
Not all mills perform equally. This page helps you identify winners and laggards.
✔ Profit by Mill
✔ Revenue by Mill
✔ Total Cost by Mill
Why It Matters:
-
Detect underperforming mills
-
Compare revenue concentration
-
Improve regional allocation strategy
-
Optimize high-cost facilities
Data-backed mill comparison strengthens operational control.
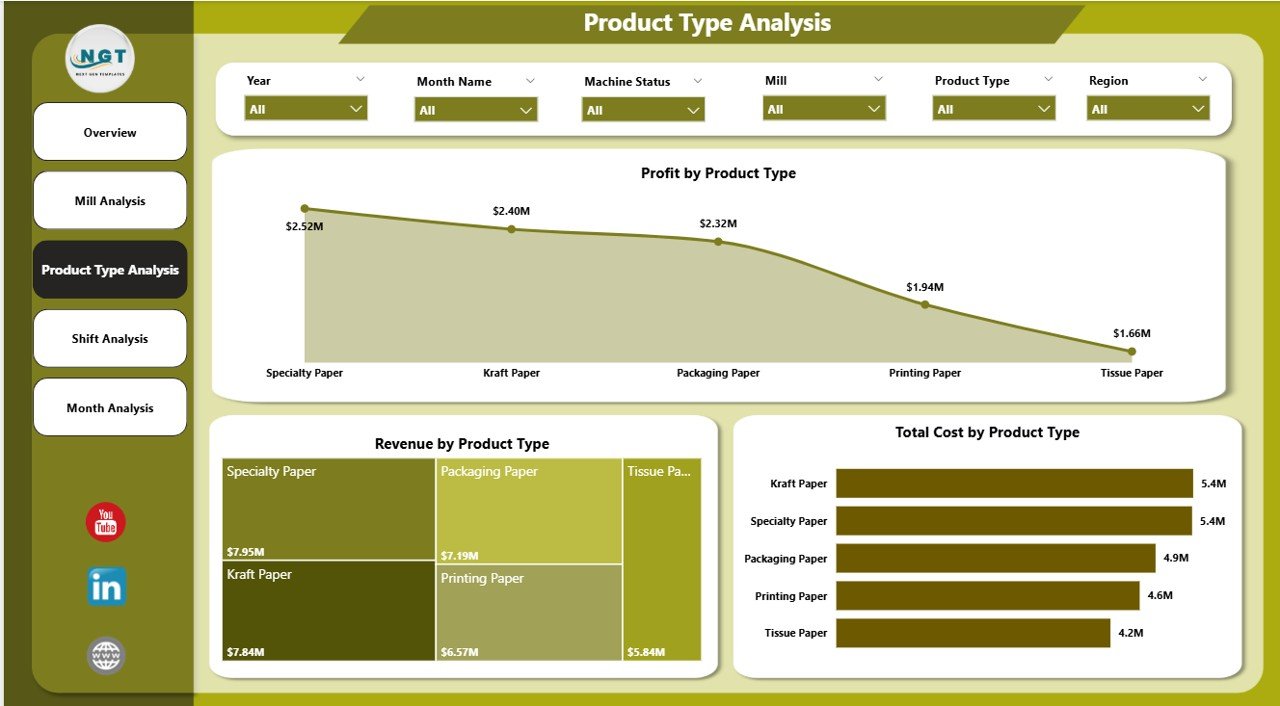
3️⃣ Product Type Analysis – Which Products Drive Margin?
Paper manufacturers produce multiple product categories:
-
Printing Paper
-
Packaging Board
-
Tissue Paper
-
Specialty Paper
✔ Profit by Product Type
✔ Revenue by Product Type
✔ Total Cost by Product Type
Use This Page To:
-
Identify high-margin products
-
Eliminate low-profit lines
-
Improve product mix
-
Align production with demand
Smarter product strategy = stronger profitability.
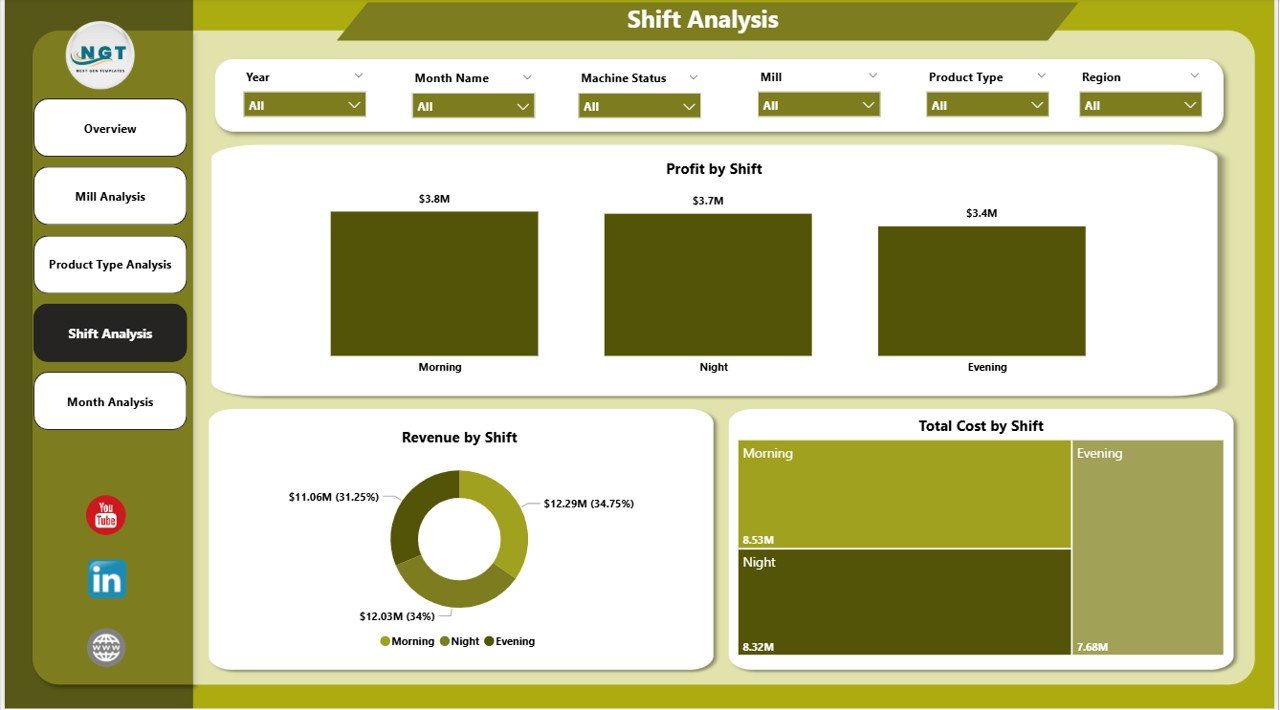
4️⃣ Shift Analysis – Optimize Operational Efficiency
Production shifts often influence cost and performance.
✔ Profit by Shift
✔ Revenue by Shift
✔ Total Cost by Shift
Key Questions Answered:
-
Which shift generates highest revenue?
-
Does night shift increase waste?
-
Is energy usage higher in specific shifts?
This page improves workforce planning and supervision.
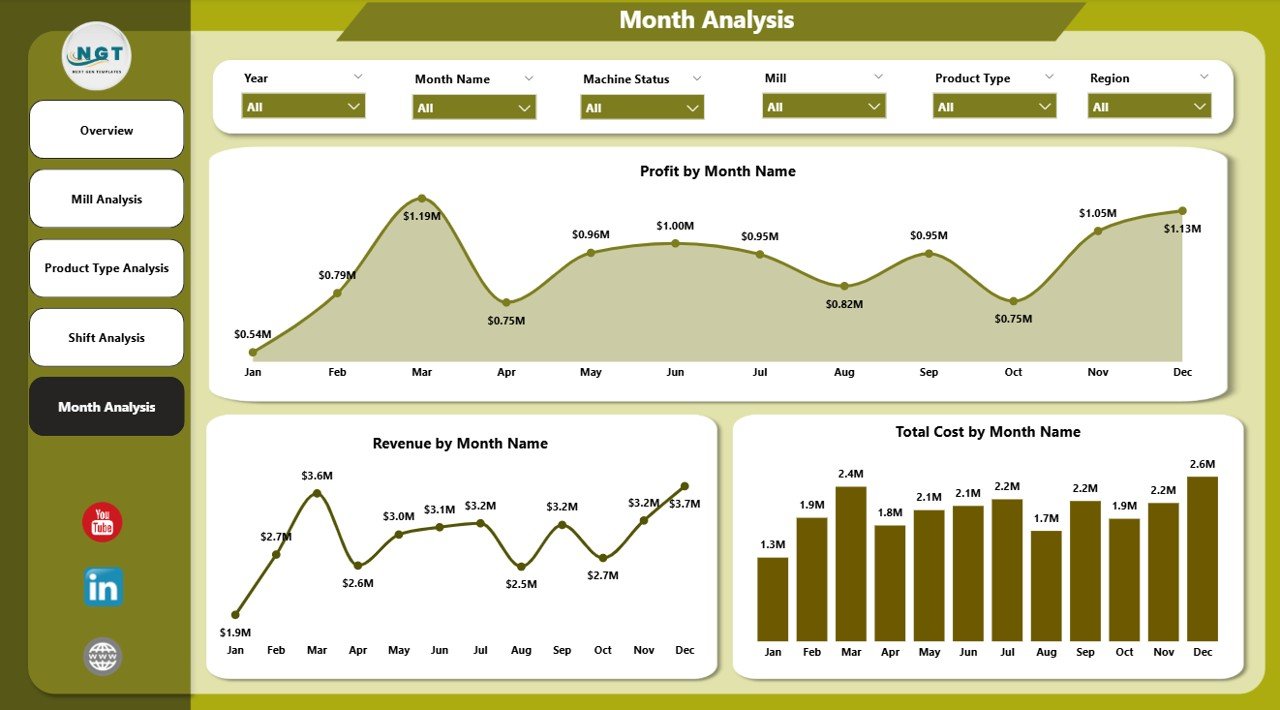
5️⃣ Month Analysis – Track Trends Over Time
Trend monitoring prevents financial surprises.
✔ Profit by Month
✔ Revenue by Month
✔ Total Cost by Month
You Can:
-
Detect seasonal demand shifts
-
Identify rising cost patterns
-
Monitor profit growth
-
Forecast future performance
Monthly trend visibility strengthens financial planning.
📊 Key KPIs You Can Track
Waste %
Raw Material Cost
Energy Cost
Production Volume
Revenue
Profit Margin
Cost per Ton
Regional Revenue Contribution
Shift Efficiency Rate
Mill-Level Profitability
These KPIs directly impact cost control and operational success.
💰 How This Dashboard Improves Profitability
When you monitor:
✔ Waste percentage daily
✔ Raw material price fluctuations
✔ Energy cost by manager
✔ Mill-level margin differences
✔ Product-level profitability
✔ Shift performance gaps
You reduce inefficiencies.
You prevent cost overruns.
You optimize production planning.
You increase margins systematically.
Data clarity leads to disciplined execution.
🔥 Advantages of Paper and Pulp Dashboard in Power BI
✅ Real-Time Operational Visibility
✅ Centralized Multi-Mill Reporting
✅ Improved Cost Control
✅ Better Waste Monitoring
✅ Energy Consumption Tracking
✅ Interactive Filtering & Drill-Down
✅ Faster Executive Reporting
✅ ERP & Excel Integration
✅ Scalable for Large Data Volumes
Power BI makes manufacturing analytics powerful and accessible.
🛠 Best Practices for Maximum Impact
✔ Define clear KPI formulas (Waste %, Cost per Ton, Margin)
✔ Schedule automatic data refresh
✔ Keep visuals clean and focused
✔ Monitor waste daily
✔ Compare cost and revenue together
✔ Conduct monthly performance reviews
✔ Train managers on slicer and drill-down usage
Consistency ensures reliable insights.
👥 Who Can Benefit?
✔ Plant Managers
✔ Production Heads
✔ Finance Managers
✔ Regional Directors
✔ Operations Analysts
✔ Procurement Teams
✔ Business Owners
Whether you operate one mill or multiple facilities, this dashboard centralizes control.
Visit our YouTube channel to learn step-by-step video tutorials