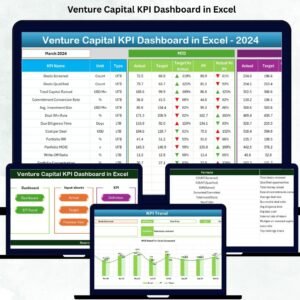
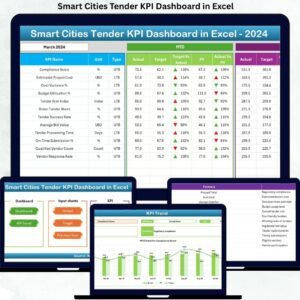
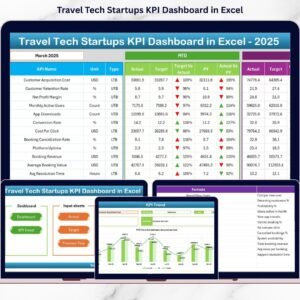
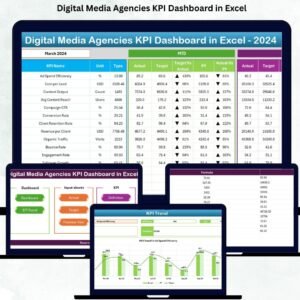
The Shared Services KPI Dashboard in Excel is an essential tool for organizations managing multiple business functions under a shared services model. Whether you’re overseeing finance, IT, HR, or customer service, this dashboard helps you monitor key performance indicators (KPIs) to ensure efficiency, cost-effectiveness, and seamless operations across departments.
With this user-friendly Excel template, you can track and visualize performance metrics in real-time, compare service delivery, and make data-driven decisions to improve overall service quality. From internal processes to service delivery outcomes, this dashboard helps you stay on top of every aspect of shared services management.
Key Features of the Shared Services KPI Dashboard in Excel
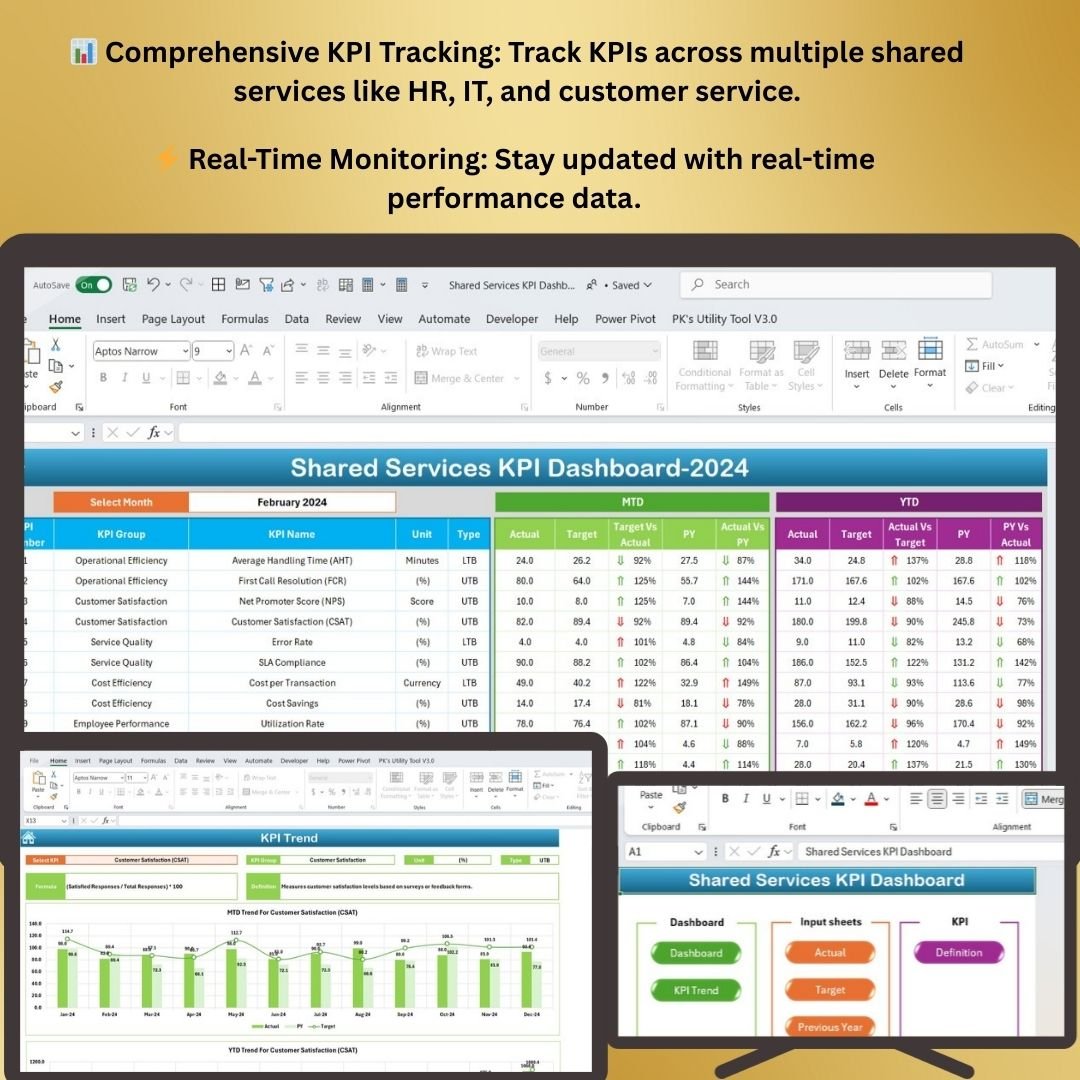
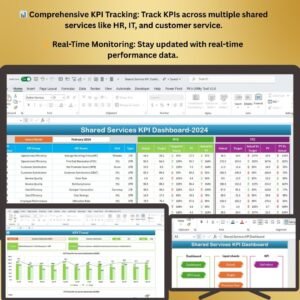
📊 Comprehensive KPI Tracking
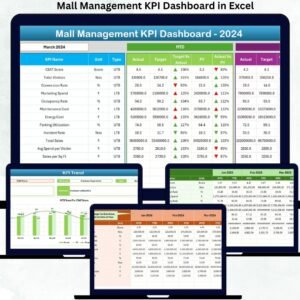
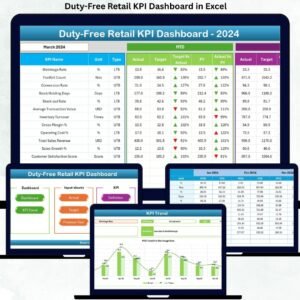
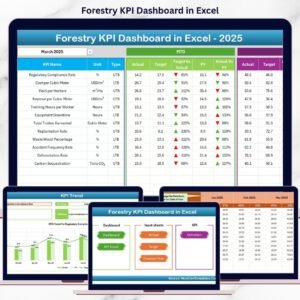
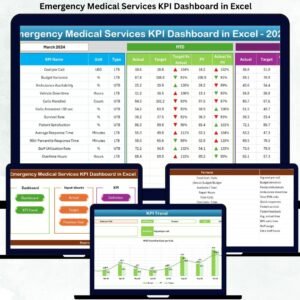
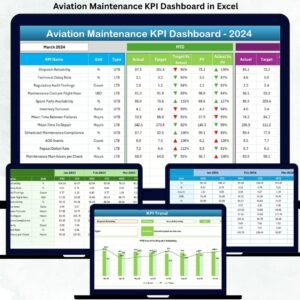
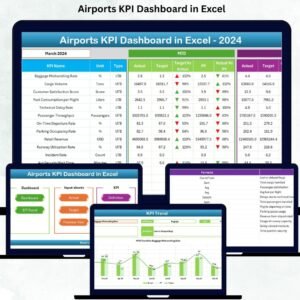
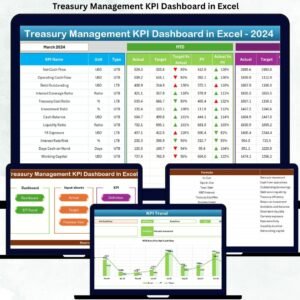
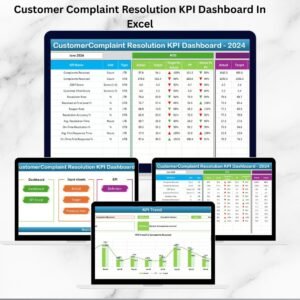
Track critical KPIs for shared services like service level agreements (SLAs), cost per transaction, customer satisfaction, and process efficiency. Ensure you’re meeting key performance standards across all departments.
⚡ Real-Time Performance Monitoring
Monitor shared services performance in real-time. Track key data and compare current results to targets, helping you make informed decisions and optimize service delivery.
📈 Service Delivery & Efficiency Insights
Visualize key metrics such as turnaround time, quality of service, cost efficiency, and customer satisfaction to assess the overall effectiveness of your shared services.
📅 Customizable for Various Services
Tailor the dashboard to track specific KPIs relevant to the different services in your organization, such as IT, HR, customer service, and finance.
🖥️ Interactive Dashboard with Visual Insights
Track and visualize key metrics with interactive charts, graphs, and tables. Quickly spot trends, measure performance, and identify areas for improvement.
Why You’ll Love the Shared Services KPI Dashboard in Excel
✅ Track Key Metrics Across Shared Services
Monitor multiple shared services in one centralized dashboard. Ensure efficient operations, track service delivery, and meet performance targets.
✅ Measure and Improve Service Quality
Track customer satisfaction, SLA compliance, and service delivery speed to measure and enhance the quality of service provided across the organization.
✅ Optimize Resource Allocation
Assess how resources are being used across different services and identify opportunities for optimization, ensuring you’re getting the most value from your shared services.
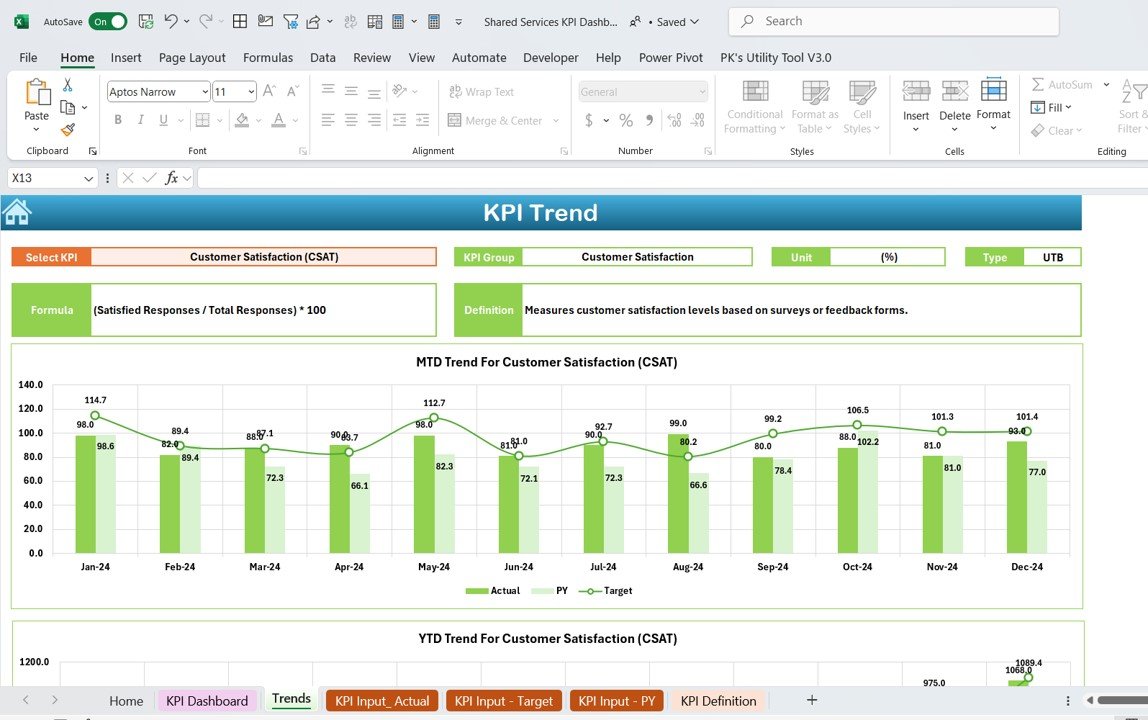
✅ Visualize Performance Trends
Use interactive charts to visualize trends, track KPIs over time, and quickly identify problem areas that need immediate attention.
✅ Simplify Shared Services Management
Consolidate performance data into one dashboard for easy monitoring, saving time and effort in managing multiple business functions under a shared services model.
What’s Inside the Shared Services KPI Dashboard Template?
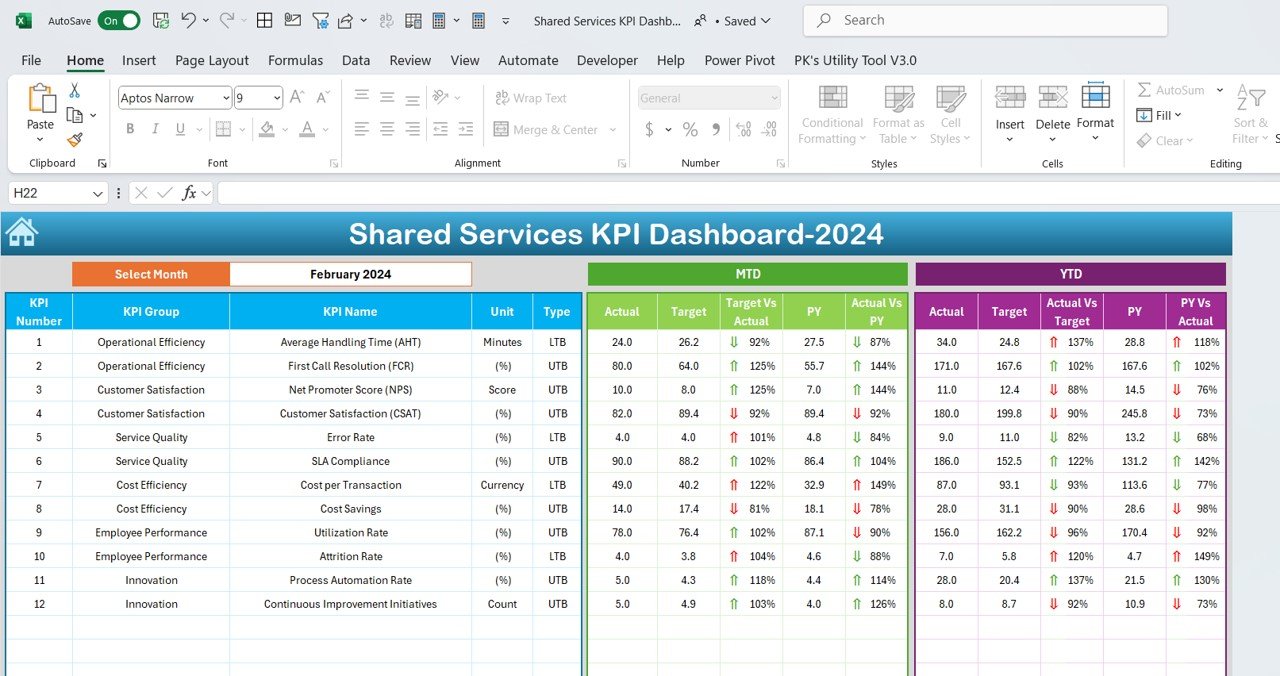
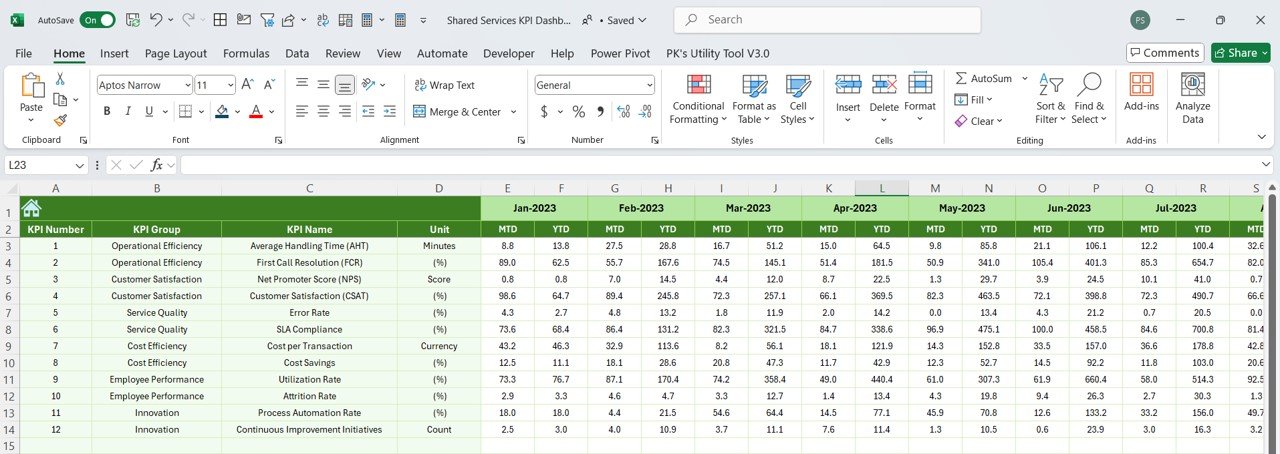
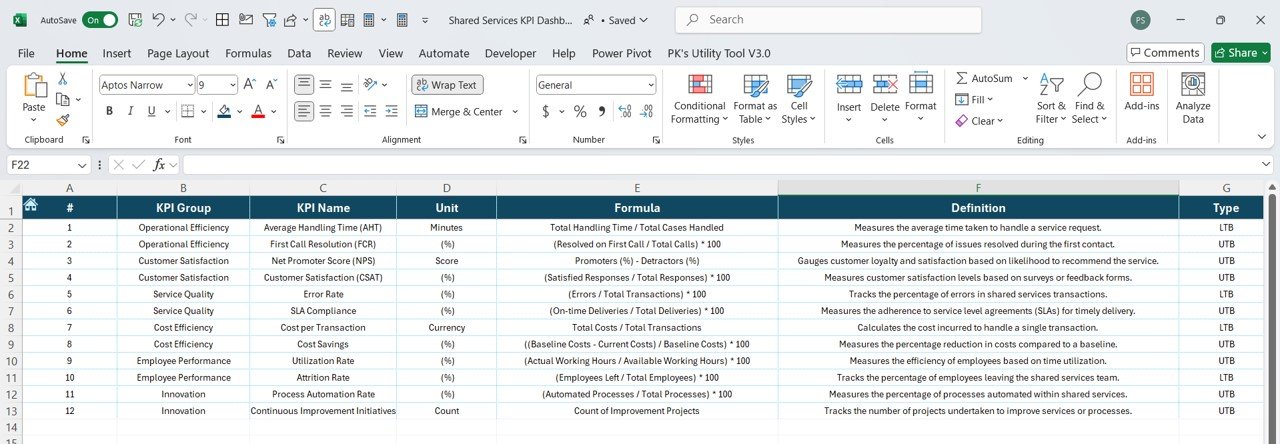
- KPI Tracking: Track key shared services KPIs such as SLA compliance, cost per transaction, customer satisfaction, and process efficiency.
- Service Delivery Insights: Visualize metrics related to service delivery quality, turnaround time, and cost efficiency.
- Customizable Metrics: Tailor the dashboard to focus on the KPIs most relevant to the shared services in your organization.
- Performance Dashboard: A visual representation of your key metrics with interactive charts and graphs.
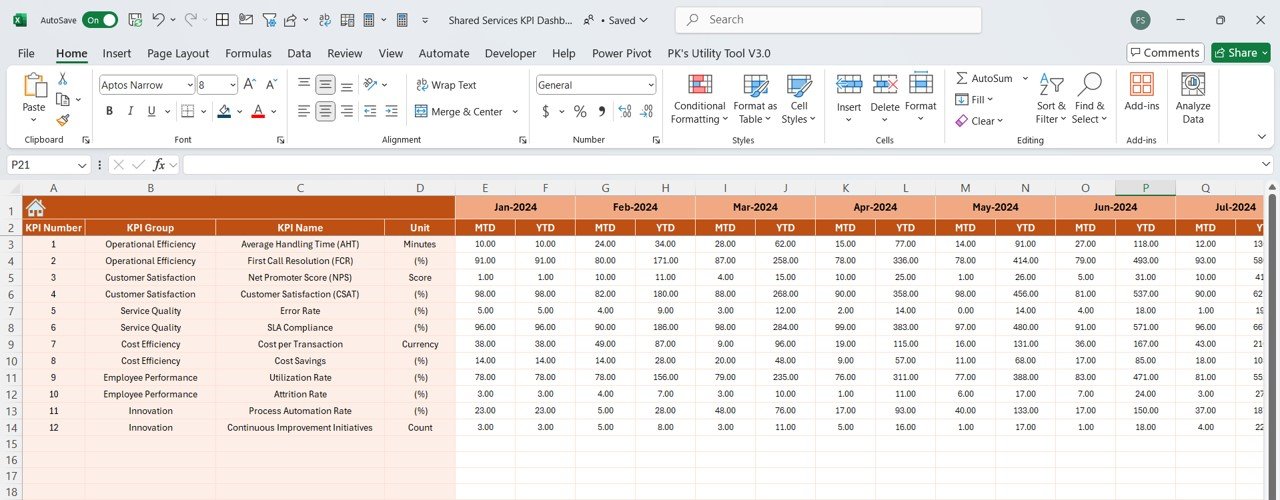
- Real-Time Data Updates: Keep track of performance metrics with real-time data, ensuring your decisions are based on the latest available information.
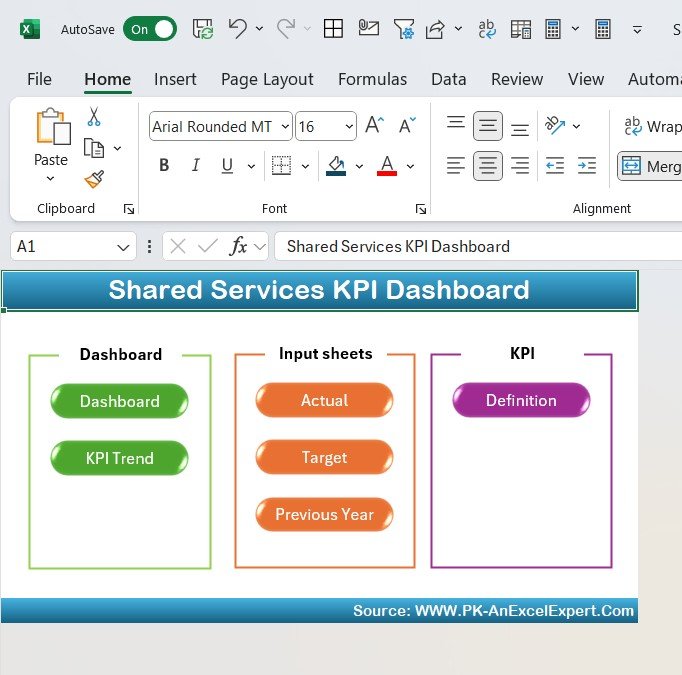
How to Use the Shared Services KPI Dashboard
1️⃣ Download the Template: Instantly access your Shared Services KPI Dashboard.
2️⃣ Input Your Data: Enter relevant performance data, including service delivery metrics, customer satisfaction scores, and cost information.
3️⃣ Monitor Performance: Use the dashboard to track performance in real-time and assess whether you’re meeting your service targets.
4️⃣ Analyze & Optimize: Identify trends, inefficiencies, and areas for improvement to enhance the overall effectiveness of your shared services.
Who Can Benefit from the Shared Services KPI Dashboard?
🔹 Shared Services Managers
🔹 Operations Managers
🔹 HR, IT, Finance, and Customer Service Leaders
🔹 Business Analysts & Consultants
🔹 Organizations with a Shared Services Model
🔹 Anyone Looking to Optimize Shared Services Performance
Track, optimize, and improve your shared services operations with the Shared Services KPI Dashboard in Excel. Stay on top of performance metrics, enhance service delivery, and make data-driven decisions that lead to organizational efficiency.
Click here to read the Detailed blog post
Visit our YouTube channel to learn step-by-step video tutorials
Youtube.com/@PKAnExcelExpert


Reviews
There are no reviews yet.