


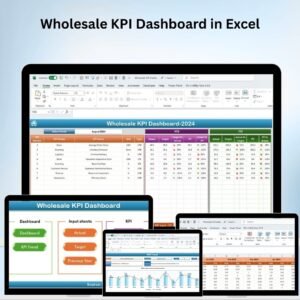
The Wholesale KPI Dashboard in Excel is an essential tool designed for wholesale businesses, distributors, and sales teams to monitor and analyze key performance indicators (KPIs) related to their operations. This Excel-based dashboard provides real-time insights into critical metrics such as sales performance, inventory turnover, order fulfillment, and customer satisfaction, enabling businesses to optimize their operations, drive growth, and improve overall performance.
This customizable dashboard allows users to track important aspects of their wholesale operations, helping them make informed, data-driven decisions to streamline workflows, reduce costs, and enhance profitability.
Key Features of the Wholesale KPI Dashboard in Excel
📊 Comprehensive KPI Tracking
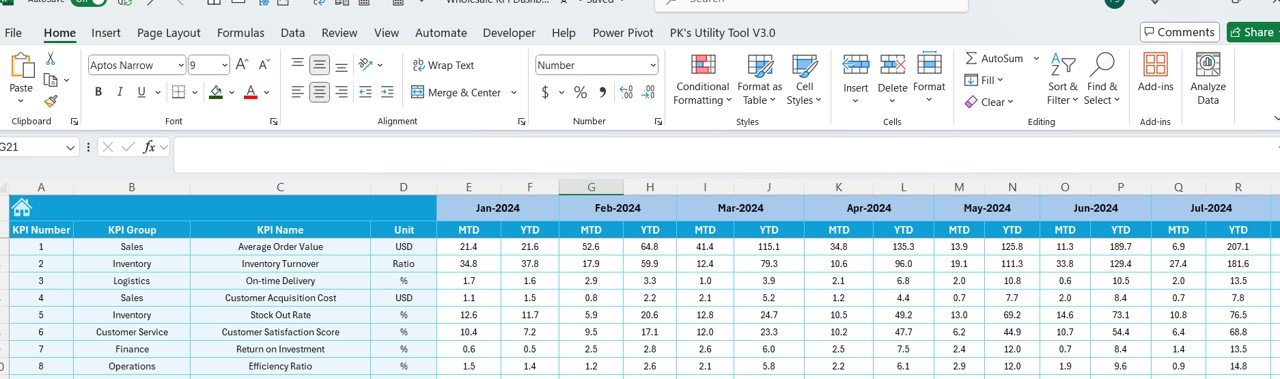
Monitor key performance indicators such as sales volume, sales revenue, order fulfillment rates, and inventory turnover. Track performance in real time to ensure operational efficiency and growth.
📉 Sales Performance Analysis
Analyze sales trends and performance by product, region, or sales representative. Use this data to optimize your sales strategy and improve overall revenue generation.
📦 Inventory Management
Track inventory levels, including stock in hand, re-order levels, and stockouts. This feature ensures that businesses maintain optimal stock levels and avoid costly stockouts or overstock situations.
📈 Order Fulfillment Monitoring
Track the status of orders from receipt to delivery, ensuring timely fulfillment and improving customer satisfaction. Identify delays in the process and take corrective action to improve efficiency.
💡 Customer Satisfaction Metrics
Track customer satisfaction and retention rates using metrics like repeat orders, feedback, and NPS. Use this data to improve customer service and loyalty.
⚙️ Customizable Dashboard
Customize the dashboard to suit your business needs by adding, removing, or modifying KPIs, metrics, and visualizations. The flexibility of this dashboard makes it suitable for a wide range of wholesale operations.
Why You’ll Love the Wholesale KPI Dashboard in Excel

✅ Track Wholesale Performance
Monitor key metrics such as sales, inventory, and order fulfillment in real time to ensure efficient operations and profitability.
✅ Optimize Inventory Management
Stay on top of stock levels, reorder schedules, and minimize overstock or stockouts by effectively managing your inventory with real-time data.
✅ Enhance Sales Strategy
Use sales performance data to identify trends and gaps, optimize sales strategies, and focus on high-performing products and regions.
✅ Improve Customer Satisfaction
Monitor customer satisfaction metrics to ensure that your customers are happy with your service and build long-term loyalty.
✅ Data-Driven Decision Making
Leverage real-time data to make informed decisions that can improve operations, increase efficiency, and drive growth.
What’s Inside the Wholesale KPI Dashboard in Excel?
-
Comprehensive KPI Tracking: Monitor sales, inventory, order fulfillment, and customer satisfaction metrics.
-
Sales Performance Analysis: Track sales trends and performance by product, region, and representative.
-
Inventory Management: Track stock levels, re-order points, and stockouts.
-
Order Fulfillment Monitoring: Monitor order receipt and delivery status for improved efficiency.
-
Customer Satisfaction Metrics: Analyze customer feedback, retention, and NPS.
-
Customizable Dashboard: Tailor the dashboard to reflect the specific KPIs relevant to your wholesale business.
How to Use the Wholesale KPI Dashboard in Excel
1️⃣ Download the Template: Instantly access the Wholesale KPI Dashboard in Excel.
2️⃣ Input Your Data: Enter sales, inventory, and order information into the dashboard for real-time tracking.
3️⃣ Monitor Performance: Track key metrics like sales, inventory, and order fulfillment for ongoing performance monitoring.
4️⃣ Analyze Data: Use the data visualizations to assess trends and identify opportunities for improvement.
5️⃣ Optimize Operations: Use the insights from the dashboard to improve sales strategies, inventory management, and customer satisfaction.
Who Can Benefit from the Wholesale KPI Dashboard in Excel?
🔹 Wholesale Businesses & Distributors
🔹 Sales Teams & Managers
🔹 Inventory & Supply Chain Managers
🔹 Business Owners & Entrepreneurs
🔹 Operations Managers
🔹 Data Analysts & Business Analysts
Optimize your wholesale operations and make data-driven decisions with the Wholesale KPI Dashboard in Excel. Track key metrics, analyze trends, and improve customer satisfaction for greater business success.
Click here to read the Detailed blog post
Visit our YouTube channel to learn step-by-step video tutorials
Youtube.com/@PKAnExcelExpert


Reviews
There are no reviews yet.