

Managing a Language Schools Dashboard today is far more complex than just delivering classes 🗣️📚. You must track enrolments, attendance, course levels, trainers, fees, student progress, and monthly trends—often across multiple cities and languages. When this data stays scattered across Excel files or manual reports, decision-making becomes slow, reactive, and risky.
That is exactly where the Language Schools Dashboard in Power BI becomes a game-changing solution 🚀.
This ready-to-use Power BI dashboard transforms raw academic and operational data into clear, interactive, and actionable insights. Instead of spending hours preparing reports, school owners, administrators, and academic heads can instantly monitor performance, profitability, and learner outcomes from a single dashboard.
Built using Power BI with Excel or database connectivity, this dashboard is scalable, flexible, and easy to maintain. You simply update your data, refresh the dashboard, and gain real-time insights—without complex technical skills.
Whether you run a single language institute or a multi-city language academy, this dashboard helps you improve academic quality, optimize revenue, and make confident data-driven decisions.
🔑 Key Features of Language Schools Dashboard in Power BI
📊 Centralized academic & financial analytics
🌍 City-wise enrolment & performance tracking
🗣️ Language-wise course performance analysis
📚 Course level (Beginner / Intermediate / Advanced) insights
👩🏫 Trainer performance evaluation
🎯 Ongoing completion & attendance monitoring
💰 Course fee & revenue trend analysis
📈 Month-wise performance tracking
🖱️ Interactive slicers & real-time Power BI visuals
📂 What’s Inside the Language Schools Dashboard in Power BI
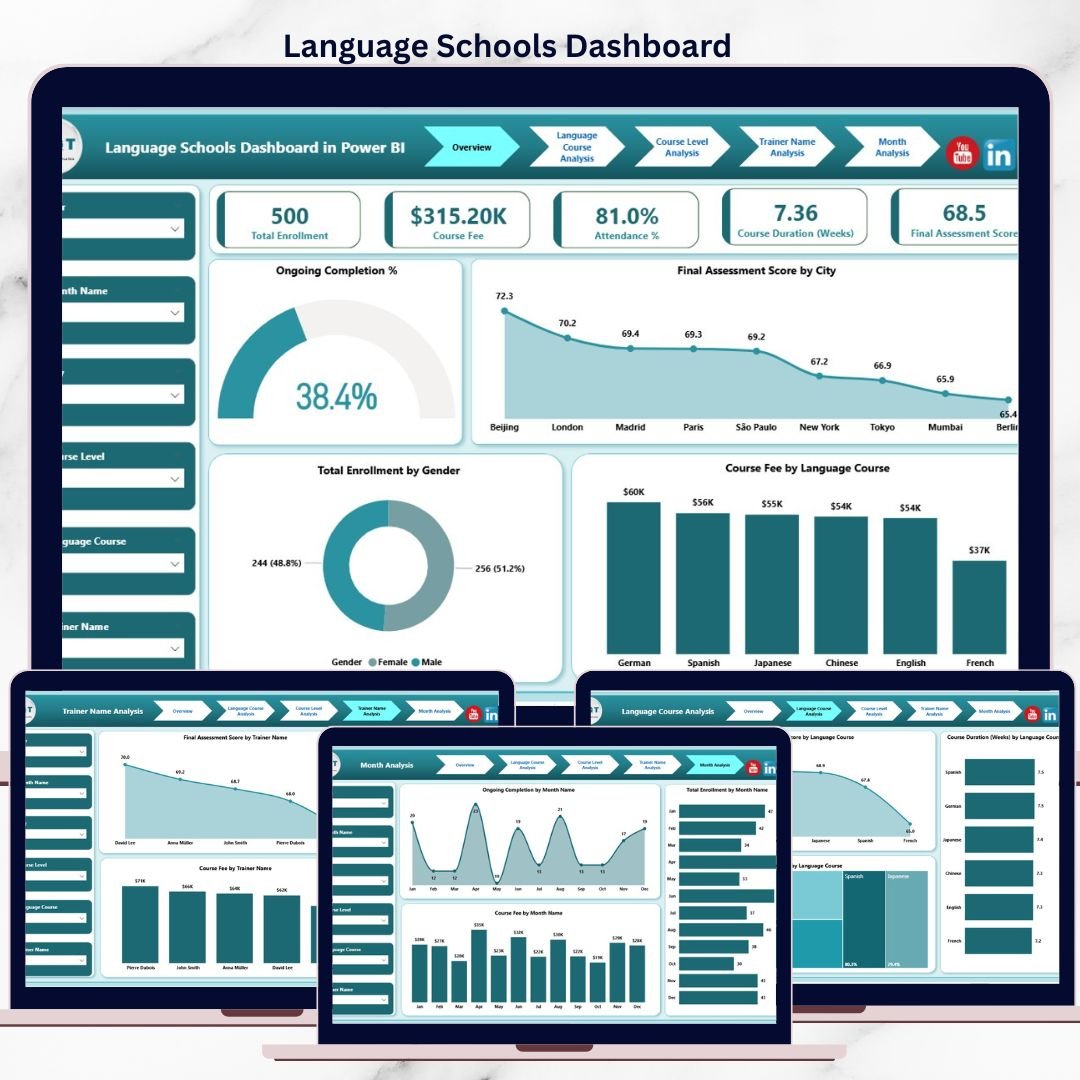
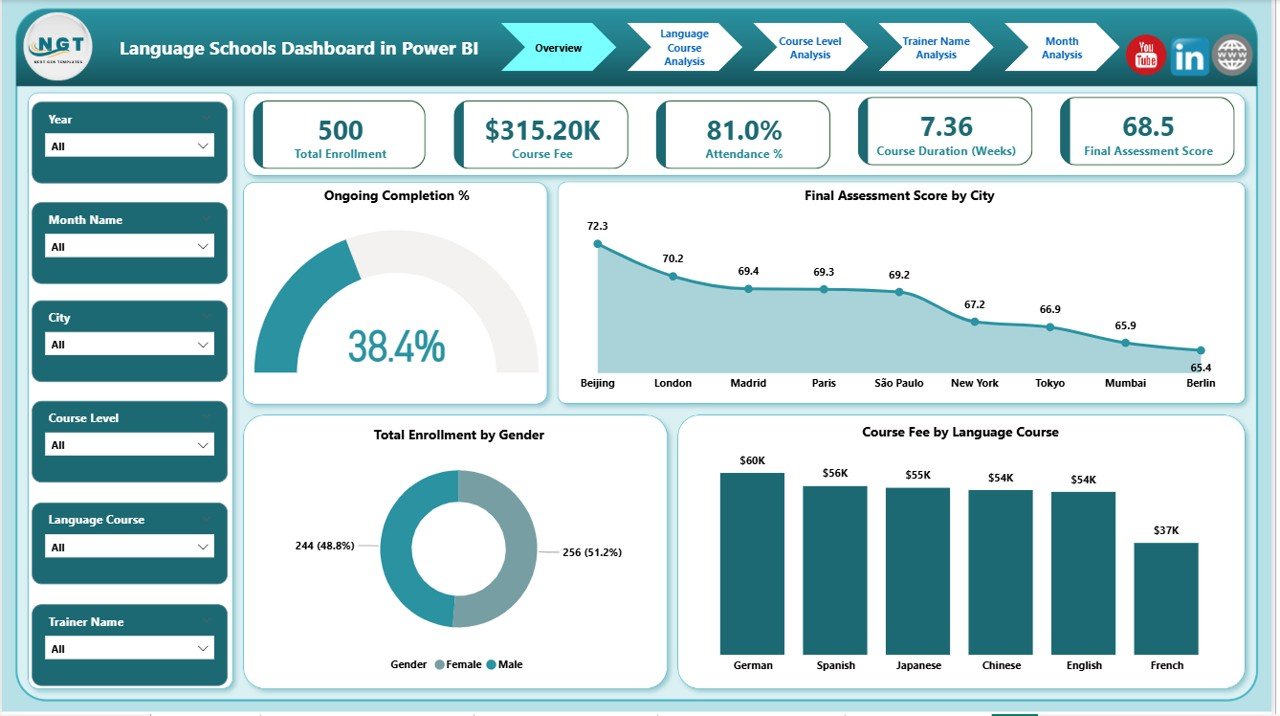
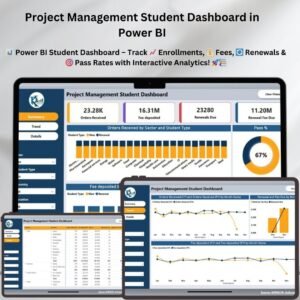
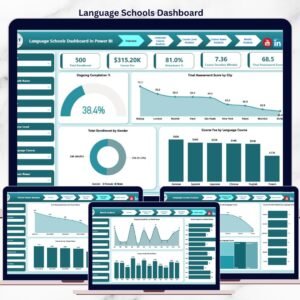
📊 Overview Page – Complete Performance Snapshot
Language Schools Dashboard
The Overview Page acts as the command center of the dashboard.
Key insights include:
-
🎯 Ongoing Completion % – Track student progress
-
🌆 Final Assessment Score by City – Compare academic quality across locations
-
👥 Total Enrolment by Gender – Monitor diversity trends
-
💰 Course Fee by Language Course – Identify high-revenue languages
-
📌 High-level KPI cards – Instant performance summary
This page gives leadership immediate clarity without drilling into detailed reports.
🗣️ Language Course Analysis – Course-Wise Insights
This page answers one key question: Which language courses perform best?
Charts included:
-
Final Assessment Score by Language Course
-
Course Duration by Language Course
-
Attendance % by Language Course
👉 Helps schools improve low-performing courses, refine engagement strategies, and balance course duration.
📚 Course Level Analysis – Academic Planning Support
This page focuses on Beginner, Intermediate, and Advanced levels.
Key insights:
-
Final Assessment Score by Course Level
-
Course Duration by Course Level
-
Course Fee by Course Level
👉 Supports curriculum optimization, pricing alignment, and balanced academic planning.
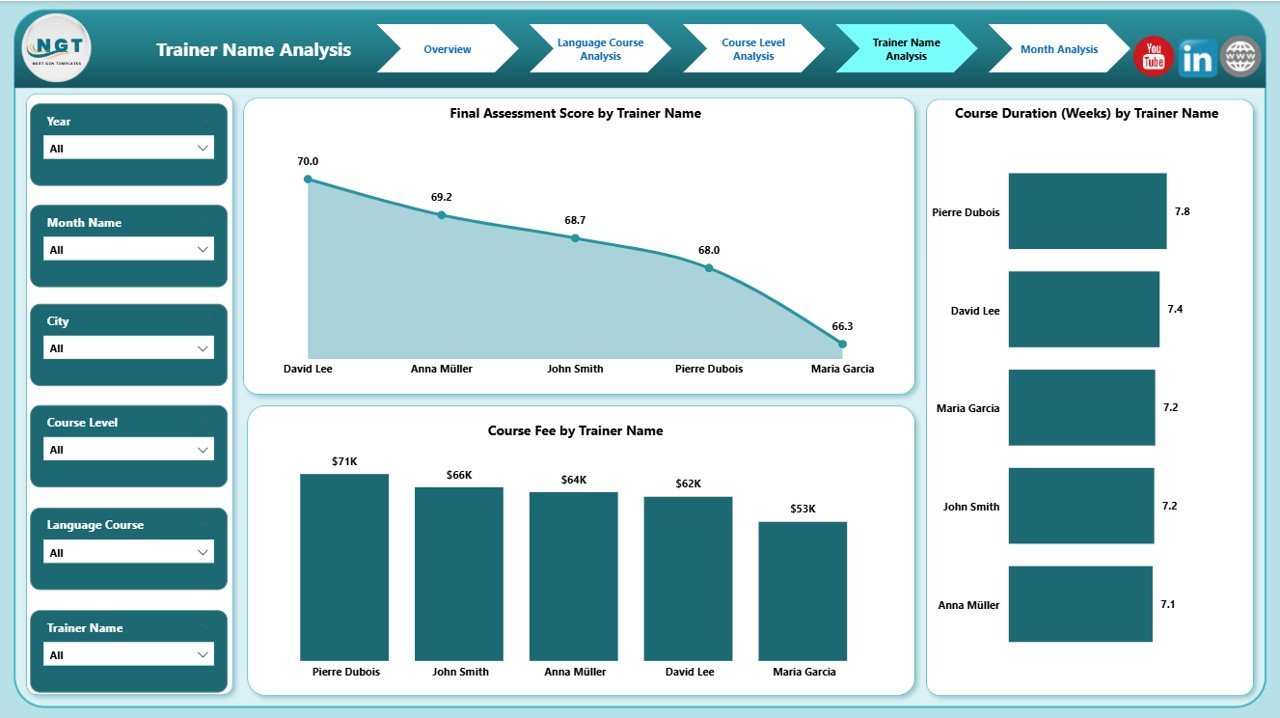
👩🏫 Trainer Name Analysis – Teaching Quality Control
Trainer quality directly impacts student success. This page evaluates trainer-level performance.
Charts include:
-
Final Assessment Score by Trainer Name
-
Course Duration by Trainer Name
-
Course Fee by Trainer Name
👉 Enables schools to recognize top trainers, support low performers, and allocate courses efficiently.
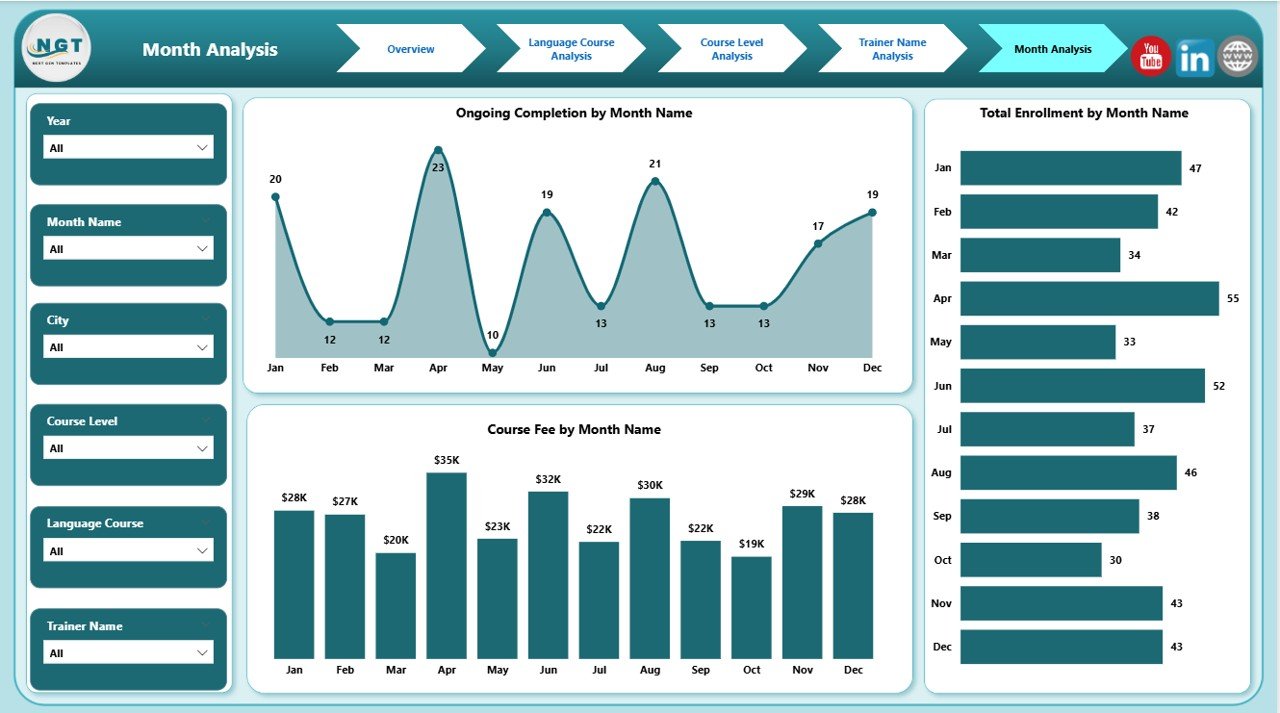
📅 Month Analysis – Trend & Growth Monitoring
The Month Analysis Page tracks performance changes over time.
Key metrics:
-
Ongoing Completion by Month
-
Total Enrolment by Month
-
Course Fee by Month
👉 Helps management forecast demand, plan marketing, and stabilize cash flow.
⚙️ How to Use the Language Schools Dashboard in Power BI
1️⃣ Update enrolment, attendance, assessment, and fee data
2️⃣ Refresh the Power BI dashboard
3️⃣ Apply slicers for city, language, trainer, level, or month
4️⃣ Review KPIs and trends
5️⃣ Take faster academic and business decisions
No coding. No complexity. Just insights ✔️
🎯 Who Can Benefit from This Dashboard?
🏫 Language Schools & Academies
🗣️ Foreign Language Institutes
🌍 Multi-city Education Franchises
🎓 Academic Directors & Coordinators
📊 Education Consultants
### 👉 Click here to read the Detailed blog post
▶️ Visit our YouTube channel to learn step-by-step video tutorials
https://youtube.com/@PKAnExcelExpert


Reviews
There are no reviews yet.