

Managing residential or commercial properties requires constant attention to occupancy, rental income, expenses, maintenance efficiency, and tenant performance. However, many property owners and managers still rely on multiple spreadsheets, manual calculations, and static reports. As a result, important insights get delayed, issues go unnoticed, and decision-making becomes slow and reactive.
That is exactly why the Property Management KPI Dashboard in Google Sheets becomes a powerful and practical solution.
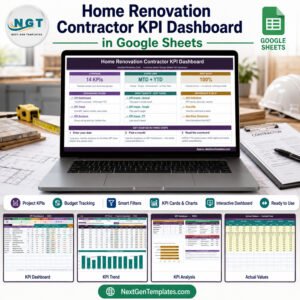
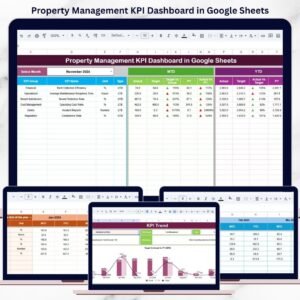
This ready-to-use dashboard helps property owners, real estate managers, and facility teams track property performance using structured KPIs, visual indicators, and clear comparisons. Instead of switching between reports, you can monitor occupancy, revenue, expenses, and efficiency from one centralized Google Sheets dashboard.Property Management KPI Dashboard in Google Sheets
Because the dashboard is built entirely in Google Sheets, it is cloud-based, collaborative, and extremely easy to maintain. You simply update the numbers, and the entire dashboard refreshes automatically—no complex formulas or technical expertise required.
🔑 Key Features of the Property Management KPI Dashboard 🏘️
📊 Centralized Property Performance Tracking
View all key property KPIs in one place.
💰 Financial Visibility
Track rental income, expenses, and performance trends clearly.
🏠 Occupancy & Vacancy Insights
Monitor occupancy rates and vacancy trends month by month.
🧮 Target vs Actual Comparison
Measure performance against targets and previous year benchmarks.
📈 Trend-Based Decision Making
Identify seasonal patterns and long-term performance changes.
📦 What’s Inside the Property Management KPI Dashboard 📂
The dashboard is structured into 6 well-designed worksheet tabs, each supporting accurate and reliable analysis.
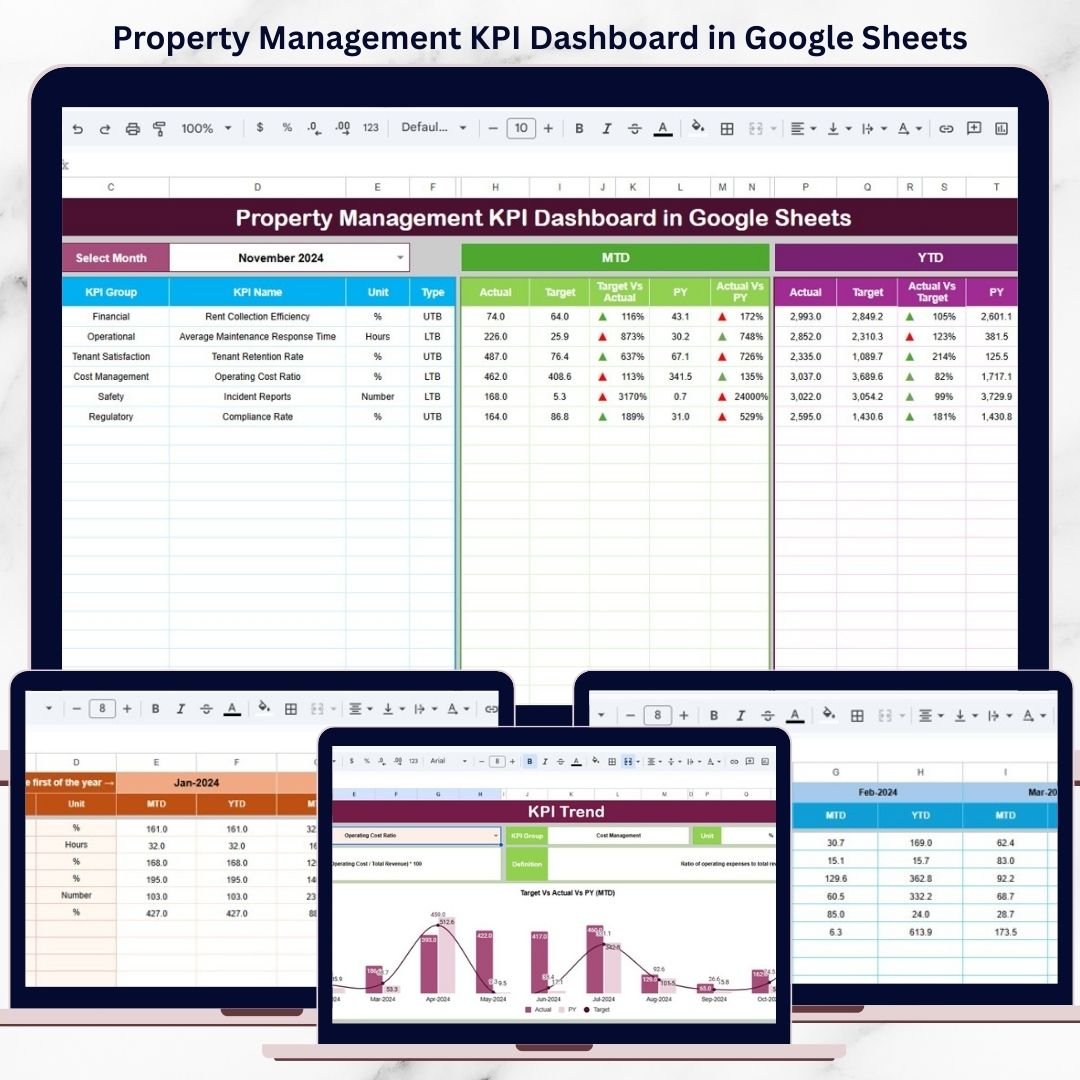
🧭 Dashboard Sheet Tab – Main Performance Overview
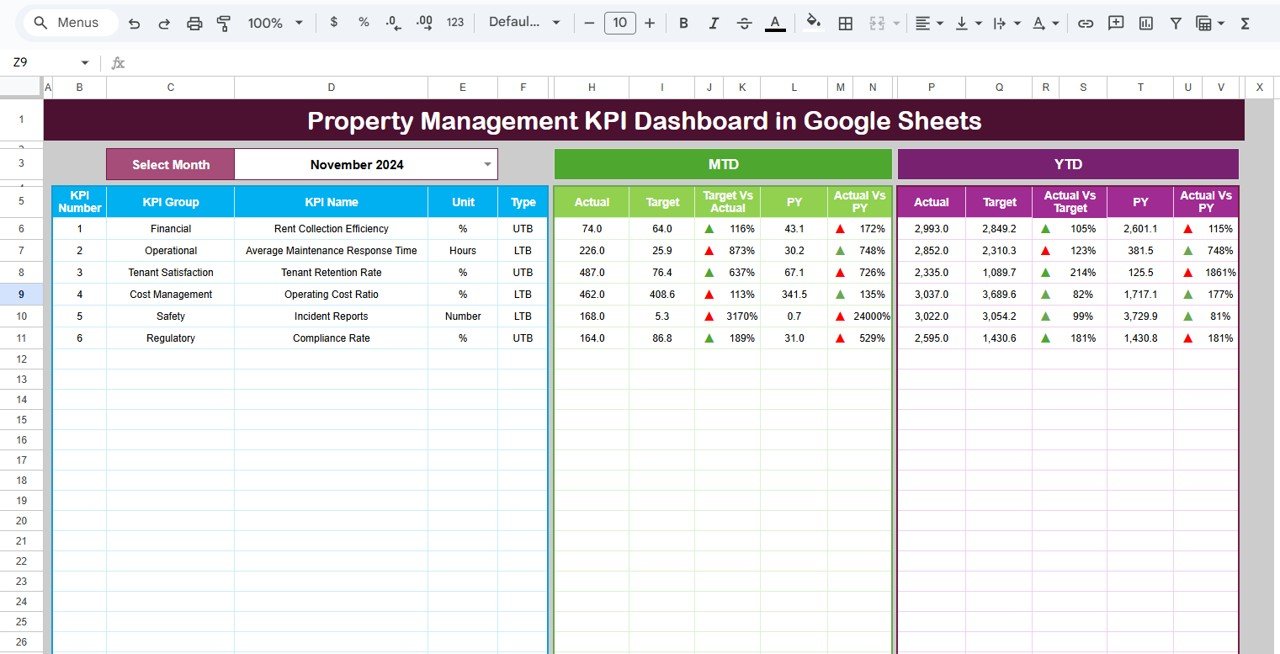
This is the main control panel of the dashboard where leadership gets an instant snapshot of property performance.
🔹 Month Selector
Located in cell D3
Selecting a month automatically refreshes all KPIs
🔹 KPI Comparison View
MTD (Month-to-Date):
Actual
Target
Previous Year
Target vs Actual
Previous Year vs Actual
YTD (Year-to-Date):
Actual
Target
Previous Year
Target vs Actual
Previous Year vs Actual
Conditional formatting with up and down arrows highlights performance improvement or decline instantly.
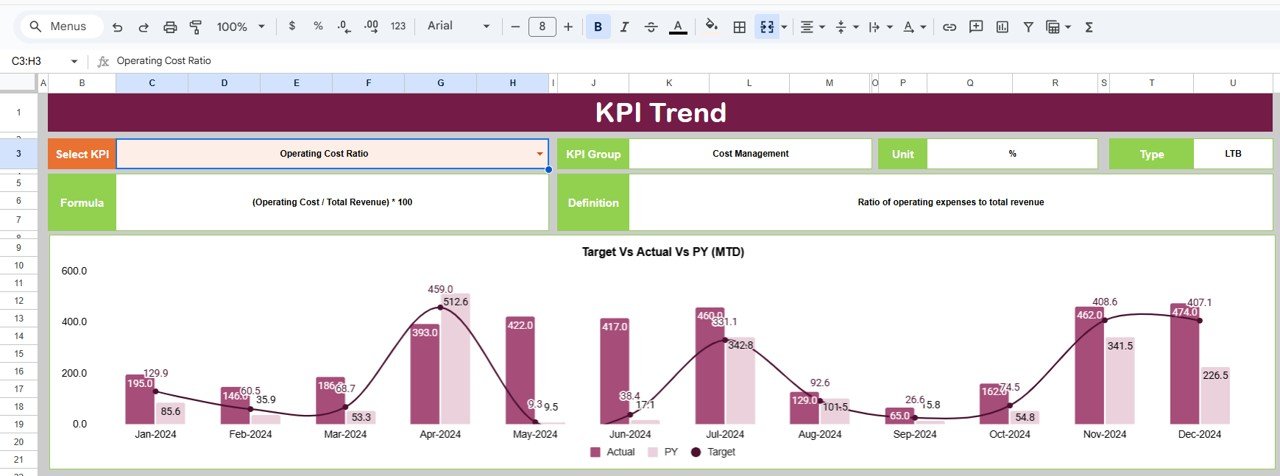
📊 KPI Trend Sheet Tab – Deep KPI Analysis
This sheet allows detailed KPI-wise performance review.
🔍 How It Works
Select a KPI from the dropdown in cell C3
📌 Details Displayed
KPI Group
Unit of Measurement
KPI Type (Upper the Better / Lower the Better)
KPI Formula
KPI Definition
Month-wise KPI trend
This helps managers understand how each KPI behaves over time.
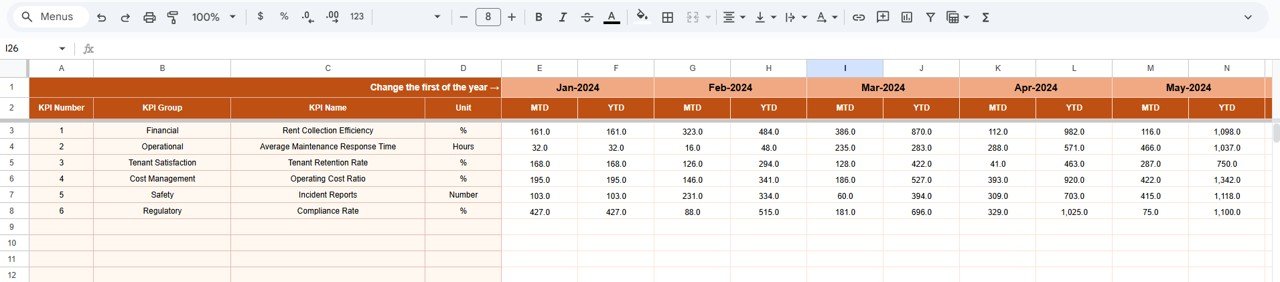
🧾 Actual Number Sheet Tab – Data Entry
This sheet captures real performance data.
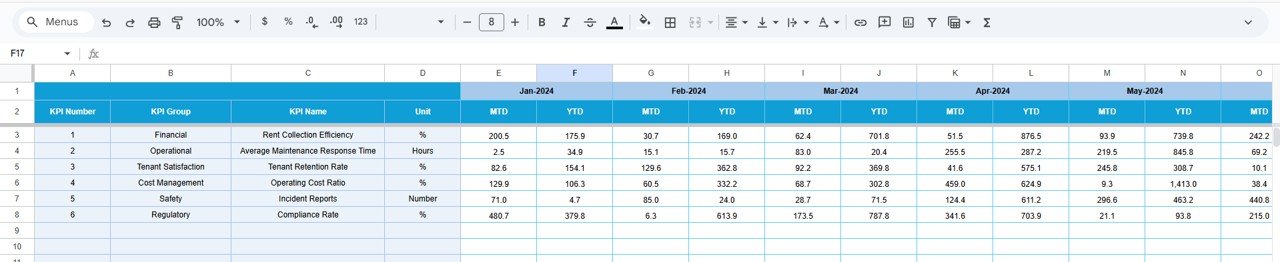
Select the first month of the year in cell E1
Enter MTD and YTD actual values
Dashboard updates automatically
It ensures clean, consistent, and controlled data entry.
🎯 Target Sheet Tab – Performance Goals
This sheet stores:
Monthly (MTD) targets
Annual (YTD) targets
Targets help align property operations with revenue, occupancy, and efficiency goals.
📅 Previous Year Number Sheet Tab – Historical Comparison
This sheet stores last year’s KPI data and supports:
Year-over-year comparison
Seasonal trend analysis
Performance benchmarking
Historical data strengthens planning and forecasting.
📘 KPI Definition Sheet Tab – Single Source of Truth
This governance sheet includes:
KPI Name
KPI Group
Unit
Formula
KPI Definition
KPI Type (UTB / LTB)
It ensures consistency and clarity across teams.
👥 Who Can Benefit from This Dashboard 🎯
Property Owners
Real Estate Managers
Facility Management Teams
Leasing & Finance Teams
Asset & Portfolio Managers
📈 Best Practices for Using the Dashboard
Update KPI data regularly
Set realistic occupancy and income targets
Review maintenance and cost KPIs monthly
Compare YoY performance quarterly
Share insights with stakeholders
Keep KPI definitions consistent