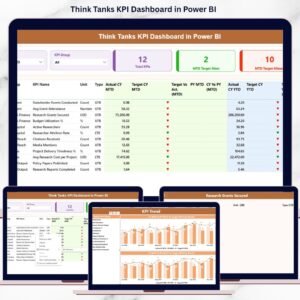
Think tanks operate in a world where data, research impact, and accountability matter more than ever. Policy influence, funding efficiency, research productivity, and operational performance must be tracked precisely. However, managing all these metrics using scattered reports and manual spreadsheets slows down decision-making. That is why the Think Tanks KPI Dashboard in Power BI becomes a powerful and essential solution.
This ready-to-use Power BI dashboard helps think tanks monitor KPIs in real time, compare targets versus actuals, and analyze trends across months and years. Built with Excel as a data source and Power BI as the visualization layer, this dashboard transforms raw data into clear, actionable insights. As a result, leadership teams can focus on strategy instead of manual reporting.
Whether you manage a policy research institute, an economic think tank, or a social impact organization, this dashboard empowers you to measure performance, demonstrate impact, and improve accountability—all from a single, interactive interface.
🚀 Key Features of Think Tanks KPI Dashboard in Power BI
📊 Three Interactive Dashboard Pages that cover summary performance, KPI trends, and KPI definitions
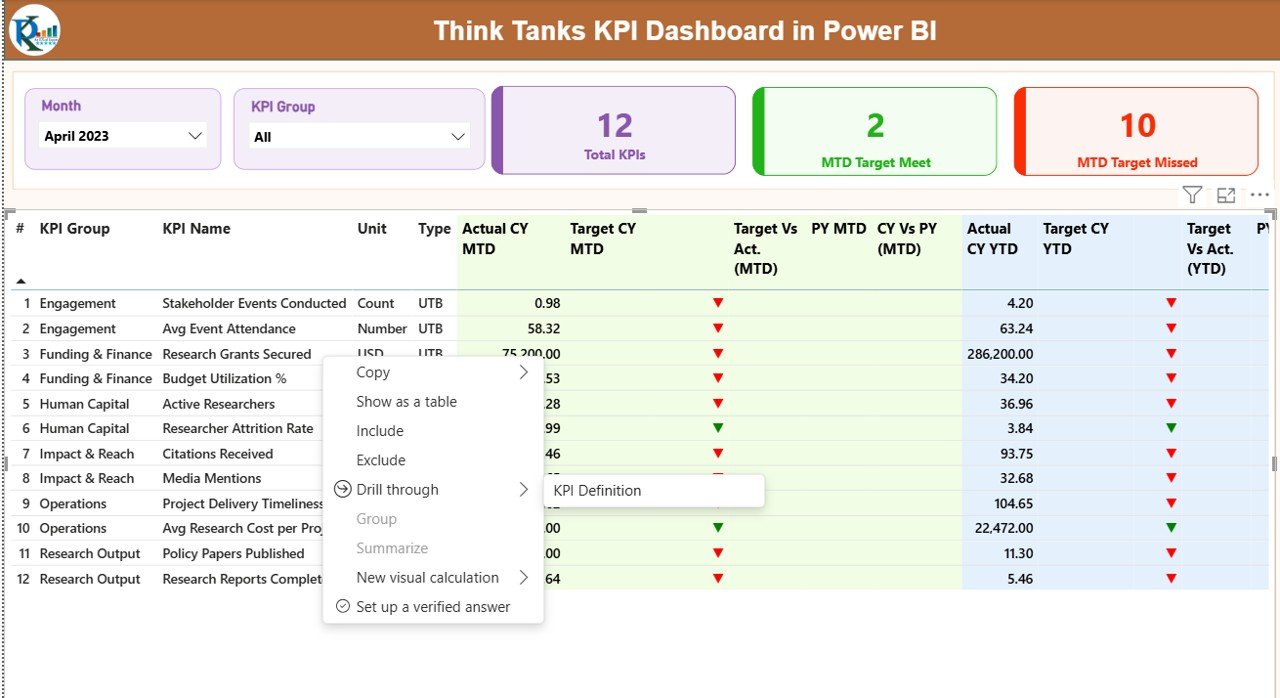
📅 Month & KPI Group Slicers for fast and focused analysis
🎯 MTD & YTD KPI Tracking with target vs actual and previous year comparisons
📈 Automatic Performance Indicators using green/red arrows and icons
📂 Excel-Based Data Input for easy updates without technical complexity
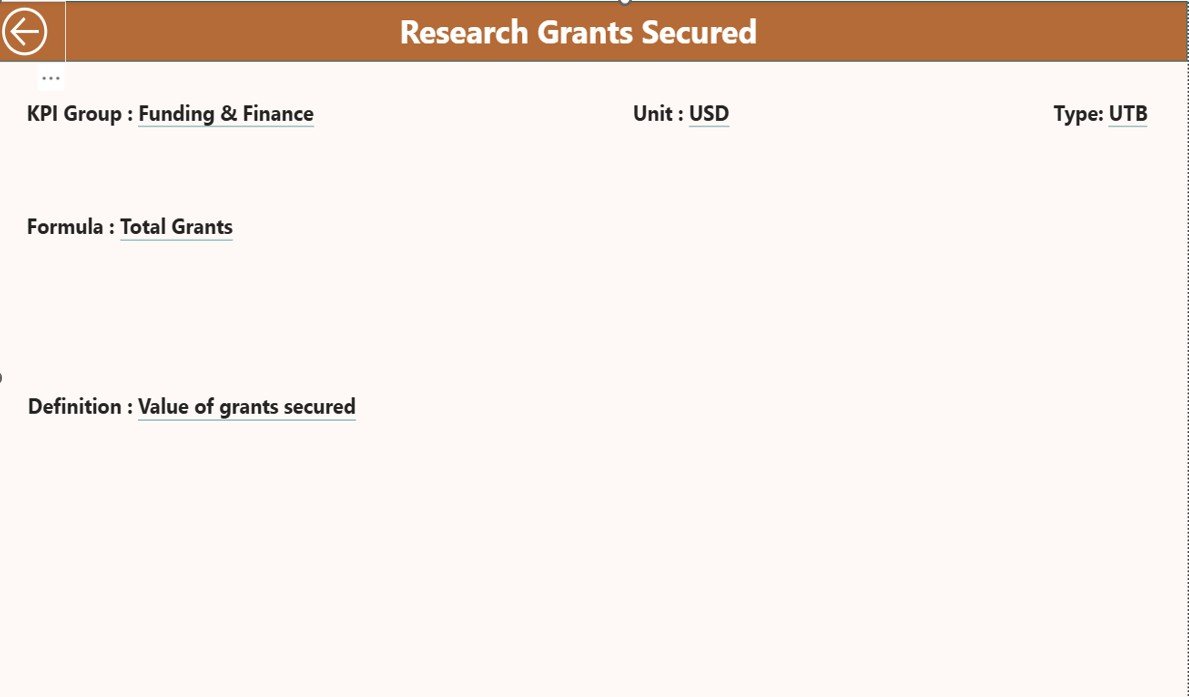
🔍 Drill-Through KPI Definitions for clarity and transparency
⚡ Real-Time Insights powered by Power BI visuals
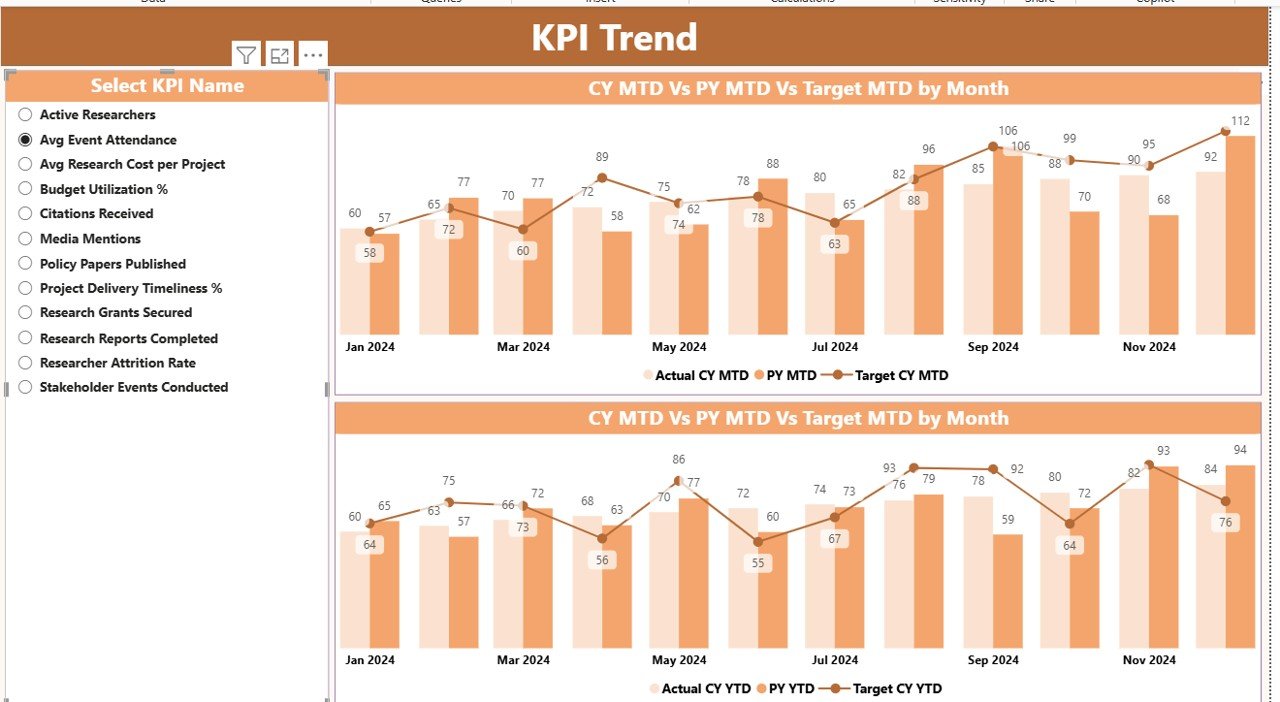
📉 Trend Analysis Charts to identify improvement or decline instantly
📦 What’s Inside the Think Tanks KPI Dashboard in Power BI
This digital product includes a professionally designed Power BI (.pbix) file connected to structured Excel data tables.
📌 Dashboard Pages Included:
-
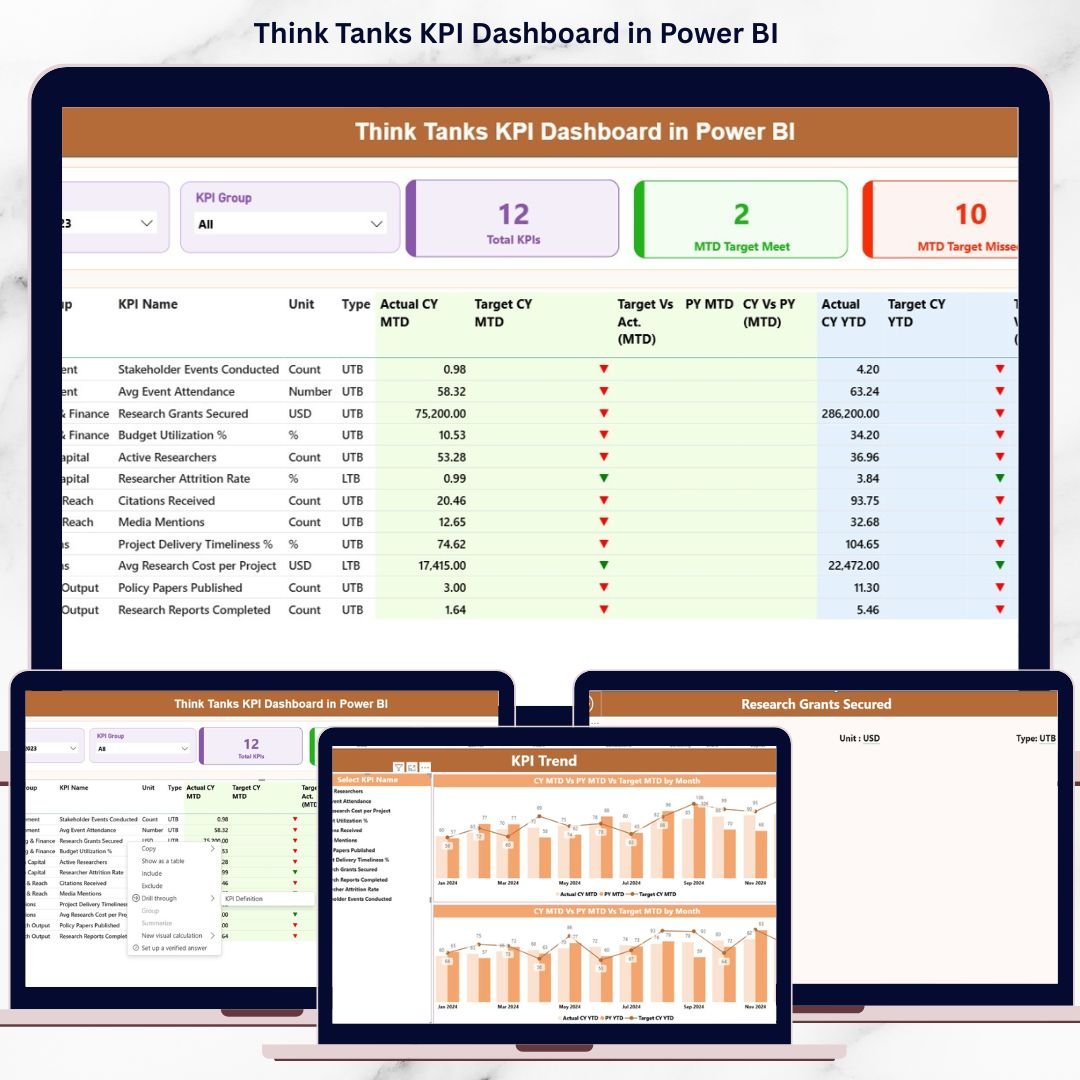
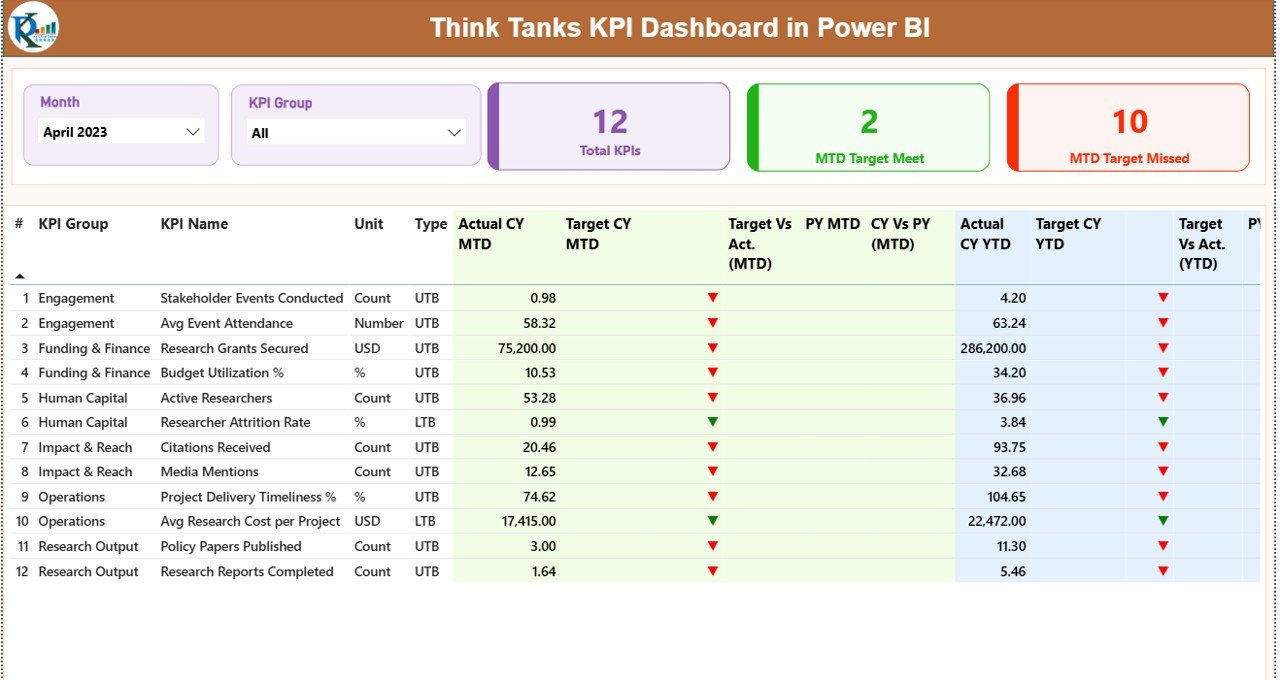
Summary Page
Displays total KPIs, MTD target met count, MTD target missed count, and a detailed KPI performance table. -
KPI Trend Page
Shows combo charts comparing Actual vs Target vs Previous Year for both MTD and YTD values. -
KPI Definition Page
Explains KPI formulas, definitions, units, and KPI type (UTB or LTB) through a drill-through feature.
📊 Excel Data Structure:
-
Input_Actual Sheet – Enter MTD and YTD actual values
-
Input_Target Sheet – Enter MTD and YTD target values
-
KPI Definition Sheet – Define KPI number, group, name, unit, formula, and type
This structure ensures consistency, accuracy, and scalability.
🧭 How to Use the Think Tanks KPI Dashboard in Power BI
1️⃣ Update actual and target values in the Excel input sheets
2️⃣ Open the Power BI file and refresh the data
3️⃣ Use Month and KPI Group slicers to filter performance
4️⃣ Review MTD and YTD results on the Summary Page
5️⃣ Analyze trends using the KPI Trend Page
6️⃣ Drill through to the KPI Definition Page for deeper understanding
No advanced Power BI knowledge is required. The dashboard is designed for business users, analysts, and leadership teams alike.
🎯 Who Can Benefit from This Think Tanks KPI Dashboard
👔 Executive Directors & Leadership Teams
📚 Research Heads & Policy Analysts
📊 Monitoring & Evaluation Teams
💰 Finance & Grants Management Teams
📑 Program Managers & Operations Teams
🏛️ Board Members & Funding Agencies
Any organization focused on policy research, impact measurement, and performance transparency will gain immediate value from this dashboard.
Click here to read the Detailed blog post
Watch the step-by-step video tutorial:


Reviews
There are no reviews yet.