Science & Technology Parks Dashboard sit at the center of modern innovation ecosystems. They connect startups, research institutions, universities, investors, and government bodies to drive economic growth and technological advancement. However, as these ecosystems expand, managing costs, funding, revenues, and participant satisfaction becomes increasingly complex. When data stays scattered across spreadsheets and static reports, leaders struggle to see the full picture. That is exactly why the Science & Technology Parks Dashboard in Power BI becomes a critical decision-support solution.
This ready-to-use Power BI dashboard transforms raw operational and financial data into a centralized, interactive, and insight-driven performance management system. Instead of compiling multiple reports for departments, programs, regions, and funding sources, decision-makers gain instant visibility in one professional dashboard. As a result, leadership teams make faster decisions, reduce reporting effort, and identify opportunities before they turn into risks.
Because this dashboard is built using Microsoft Power BI, it offers dynamic filtering, drill-down analysis, and visually intuitive storytelling. Users can explore performance by technology sector, research domain, department, region, funding source, or time period using slicers—without writing formulas or code. Consequently, meetings become more focused, transparent, and data-driven.
🔑 Key Features of Science & Technology Parks Dashboard in Power BI
📊 Centralized Park Performance Monitoring – Track costs, funding, revenue, and satisfaction in one dashboard
🎯 Executive KPI Visibility – Instantly understand high-level performance without manual reports
🎛️ Interactive Slicers & Filters – Analyze performance by sector, region, program, or time period
📈 Multi-Dimensional Analysis – Compare departments, research domains, and funding sources
😊 Satisfaction & Outcome Tracking – Measure participant and stakeholder experience clearly
⚡ Automated Power BI Reporting – Reduce manual work and improve data accuracy
📂 What’s Inside the Science & Technology Parks Dashboard in Power BI
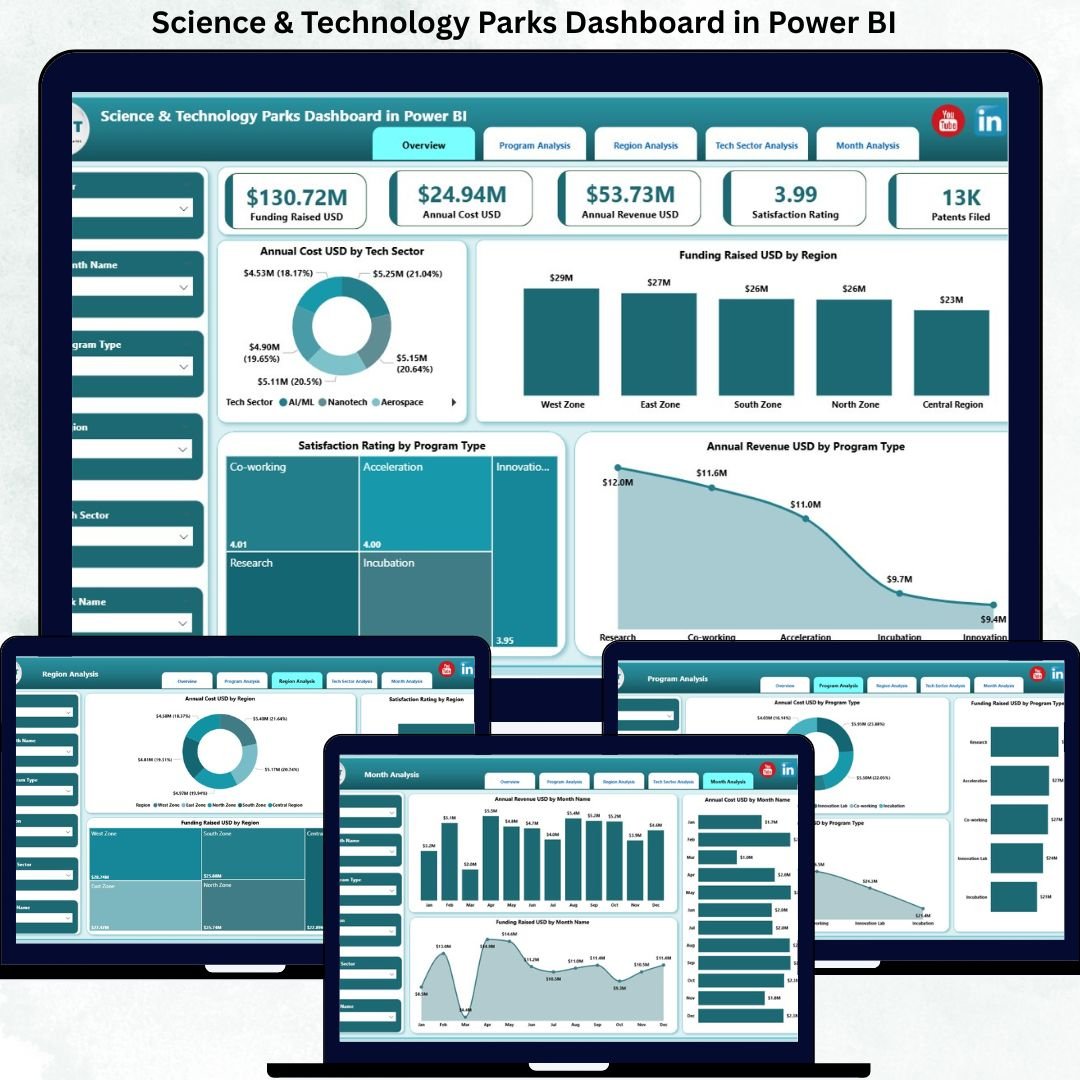
This professionally structured dashboard includes five analytical pages, each designed for a specific management need:
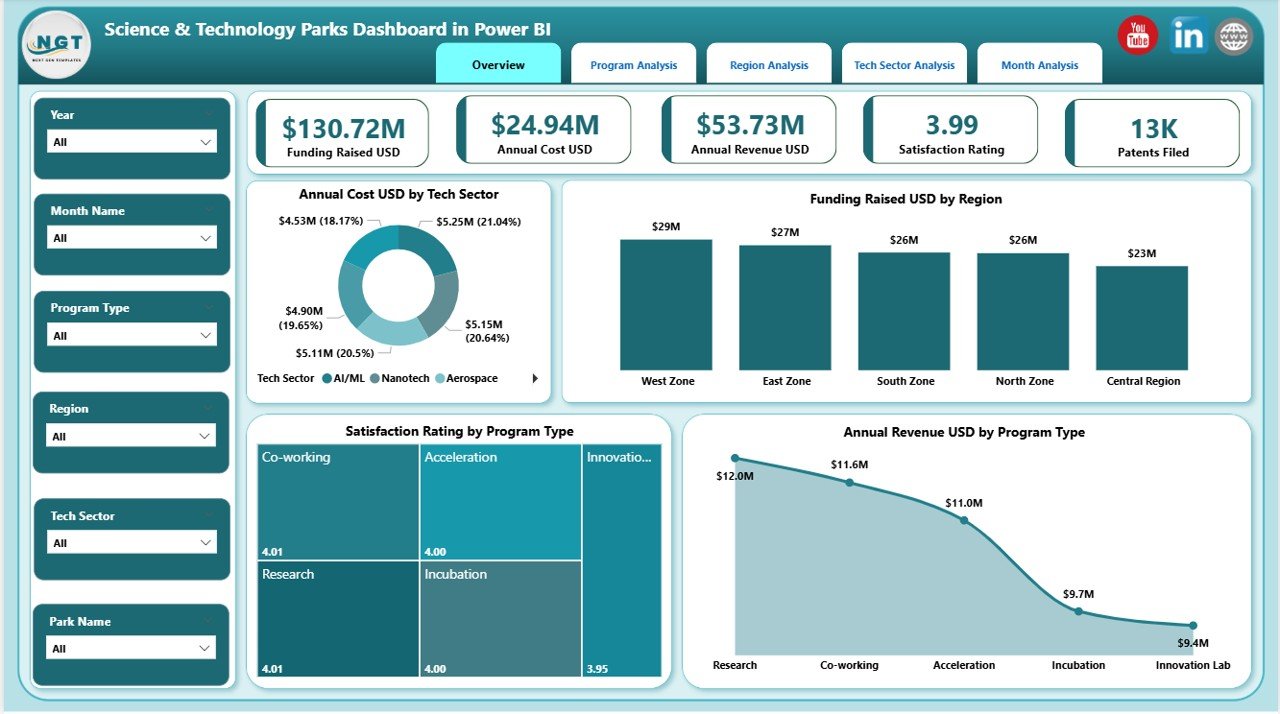
📊 Overview Page – Executive summary of park performance
-
Charts include:
-
Annual Cost USD by Tech Sector
-
Funding Raised USD by Region
-
Satisfaction Rating by Program Type
-
Annual Revenue USD by Program Type
-
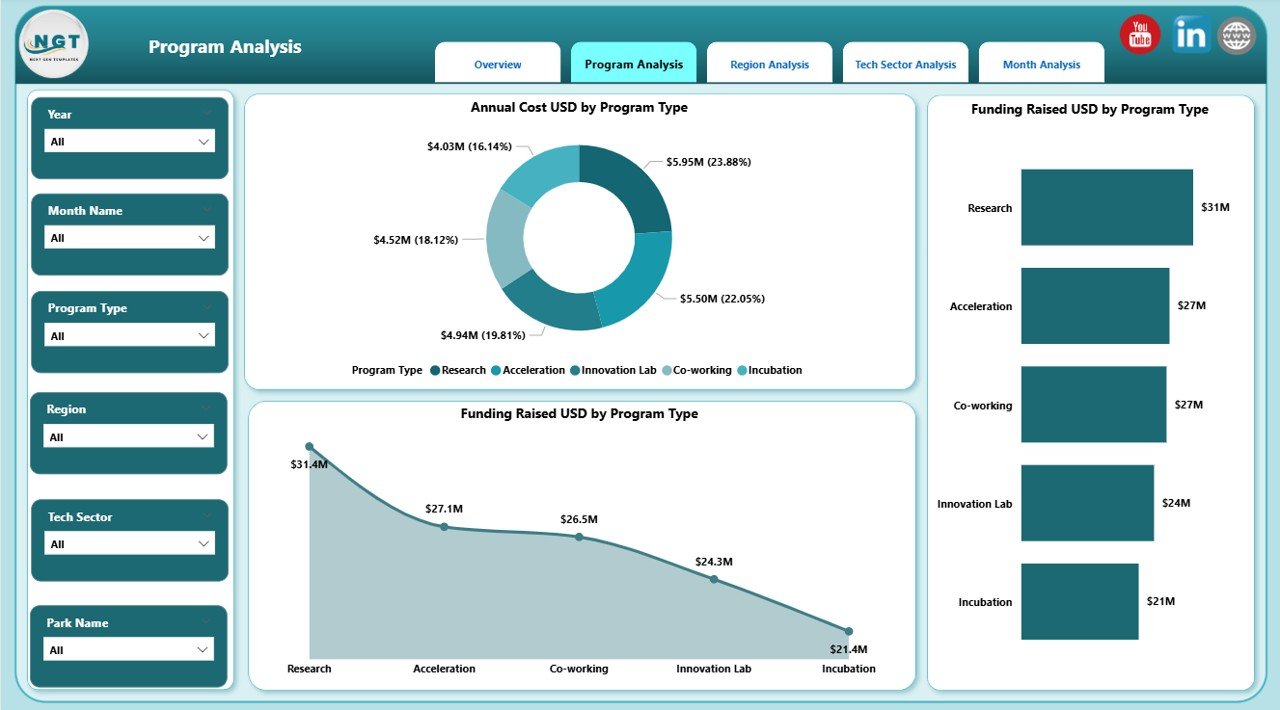
🏢 Department Analysis Page – Internal performance and efficiency view
-
Annual Cost USD by Program Type
-
Funding Raised USD by Program Type
-
Funding Rated USD by Program Type
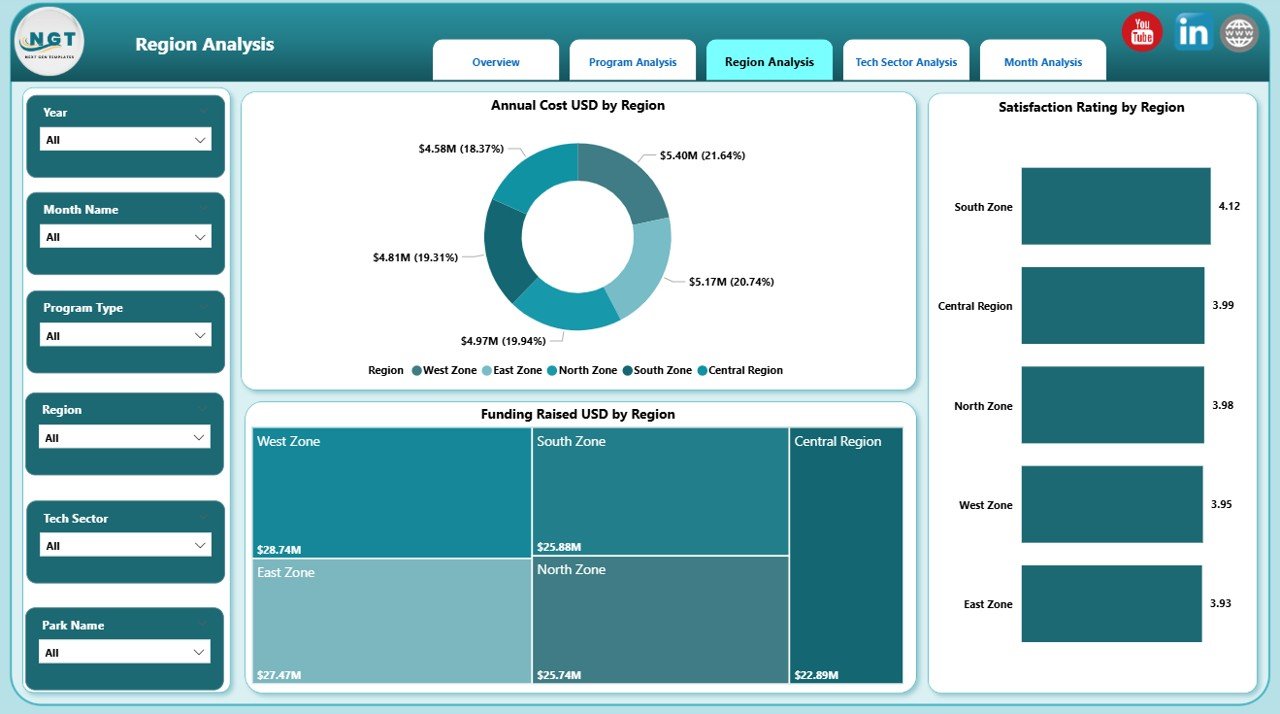
🔬 Research Domain Analysis Page – Innovation focus and impact comparison
-
Annual Cost USD by Region
-
Funding Raised USD by Region
-
Satisfaction Rating by Region
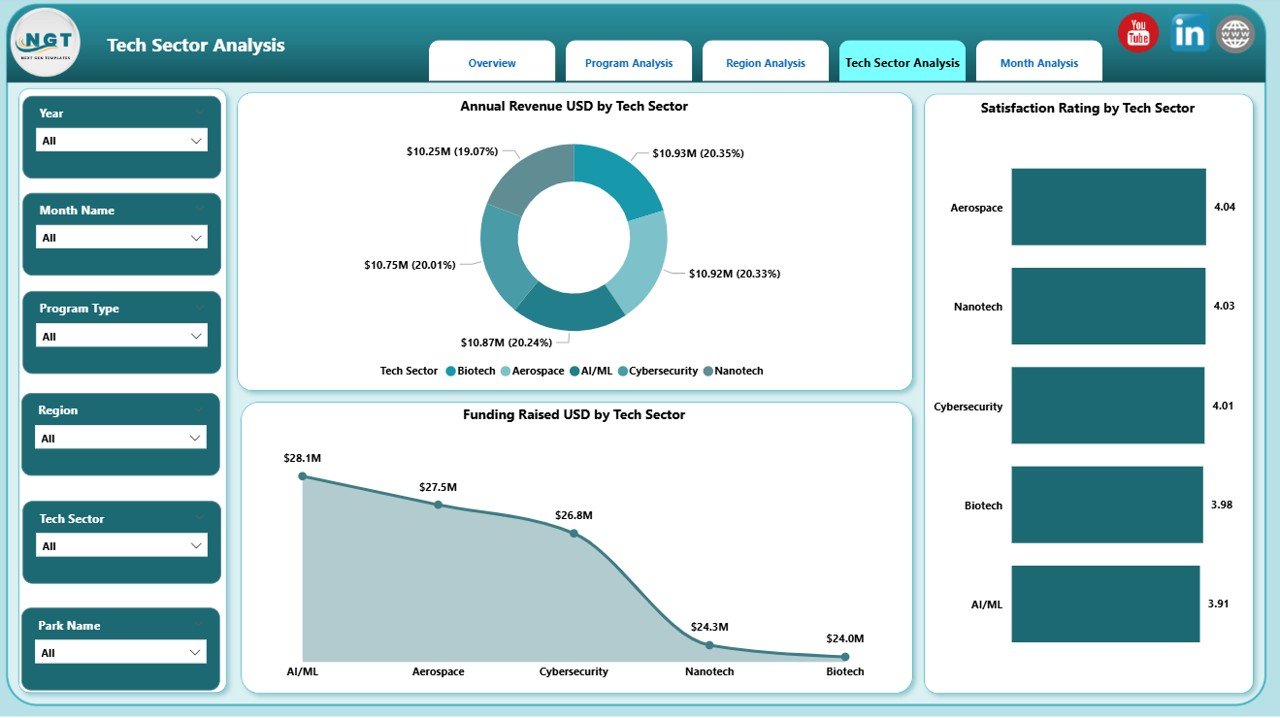
💰 Funding Source Analysis Page – Financial sustainability and investor insights
-
Annual Cost USD by Tech Sector
-
Funding Raised USD by Tech Sector
-
Satisfaction Rating by Tech Sector
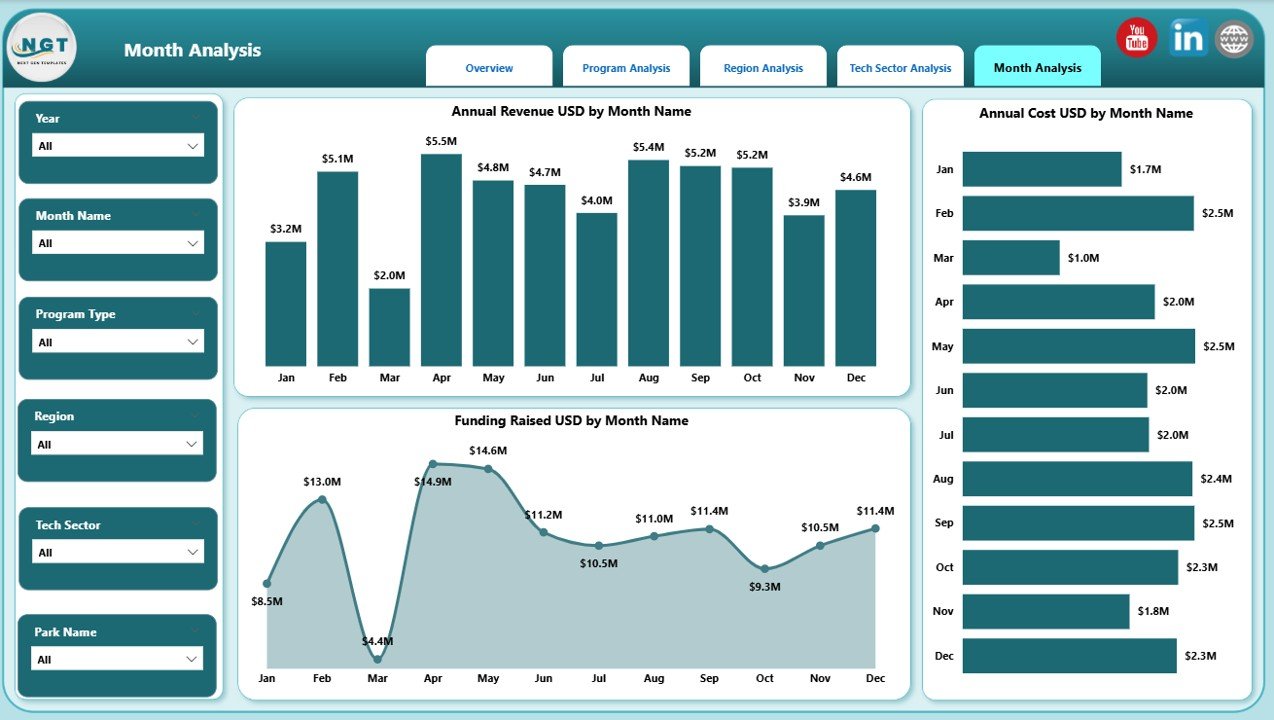
📅 Monthly Trends Page – Time-based performance and forecasting
-
Annual Cost USD by Month
-
Funding Raised USD by Month
-
Annual Revenue USD by Month
Each page responds instantly to slicers, allowing users to move seamlessly from high-level strategy to detailed analysis.
▶️ How to Use the Science & Technology Parks Dashboard in Power BI
1️⃣ Connect your structured data (Excel or database) to the Power BI file
2️⃣ Refresh the dashboard to update all KPIs and visuals
3️⃣ Use slicers to filter by sector, region, program, or funding source
4️⃣ Review trends, costs, funding, and satisfaction metrics
5️⃣ Use insights to optimize budgets, programs, and innovation strategy
No advanced Power BI skills are required for everyday use.
👥 Who Can Benefit from This Science & Technology Parks Dashboard in Power BI
This dashboard is ideal for:
🚀 Science & Technology Park Administrators
🏢 Innovation & Incubation Managers
💰 Funding & Investment Teams
🏛 Government & Regulatory Bodies
🎓 University & Research Institution Leaders
Each stakeholder gains clarity, transparency, and confidence in decision-making.
### 👉 Click here to read the Detailed Blog Post
Visit our YouTube channel to learn step-by-step video tutorials.


Reviews
There are no reviews yet.