


Audit Findings and Risk Analysis Dashboard in Google Sheets are essential for ensuring compliance, controlling risk, and strengthening governance. However, many organizations still struggle to convert audit results into clear, actionable insights. Audit data often remains scattered across spreadsheets, static reports, and presentations. As a result, leadership teams find it difficult to identify high-risk areas, monitor corrective actions, and control audit costs effectively.Audit Findings and Risk Analysis Dashboard in Google Sheets
The Audit Findings & Risk Analysis Dashboard in Google Sheets solves this challenge by transforming raw audit data into a centralized, visual, and decision-ready dashboard. Instead of reviewing multiple files, auditors, compliance teams, risk managers, and executives can monitor audit performance, risk exposure, compliance scores, findings, and costs—all in one place.Audit Findings and Risk Analysis Dashboard in Google Sheets
Because the dashboard is built entirely in Google Sheets, it is cloud-based, collaborative, and highly flexible. Teams can update data in real time, customize risk categories, and share insights instantly without relying on expensive audit or GRC software.Audit Findings and Risk Analysis Dashboard in Google Sheets

🚀 Key Features of the Audit Findings & Risk Analysis Dashboard
📊 Centralized Audit Visibility
Track all audits, findings, risks, compliance scores, and costs from a single dashboard.Audit Findings and Risk Analysis Dashboard in Google Sheets
⚠️ Risk-Based Analysis
Instantly identify low, medium, and high-risk audits and focus on critical exposure areas.
✅ Compliance Performance Tracking
Monitor average compliance scores across departments, locations, and risk levels.
🧾 Audit Findings & Corrective Action Insights
Understand where issues occur, why they occur, and which areas need immediate action.
💰 Audit Cost & Efficiency Monitoring
Control audit spending by auditor, location, month, and risk level.
🔍 Advanced Search Functionality
Locate any audit instantly using keyword-based search.
📦 What’s Inside the Audit Findings & Risk Analysis Dashboard
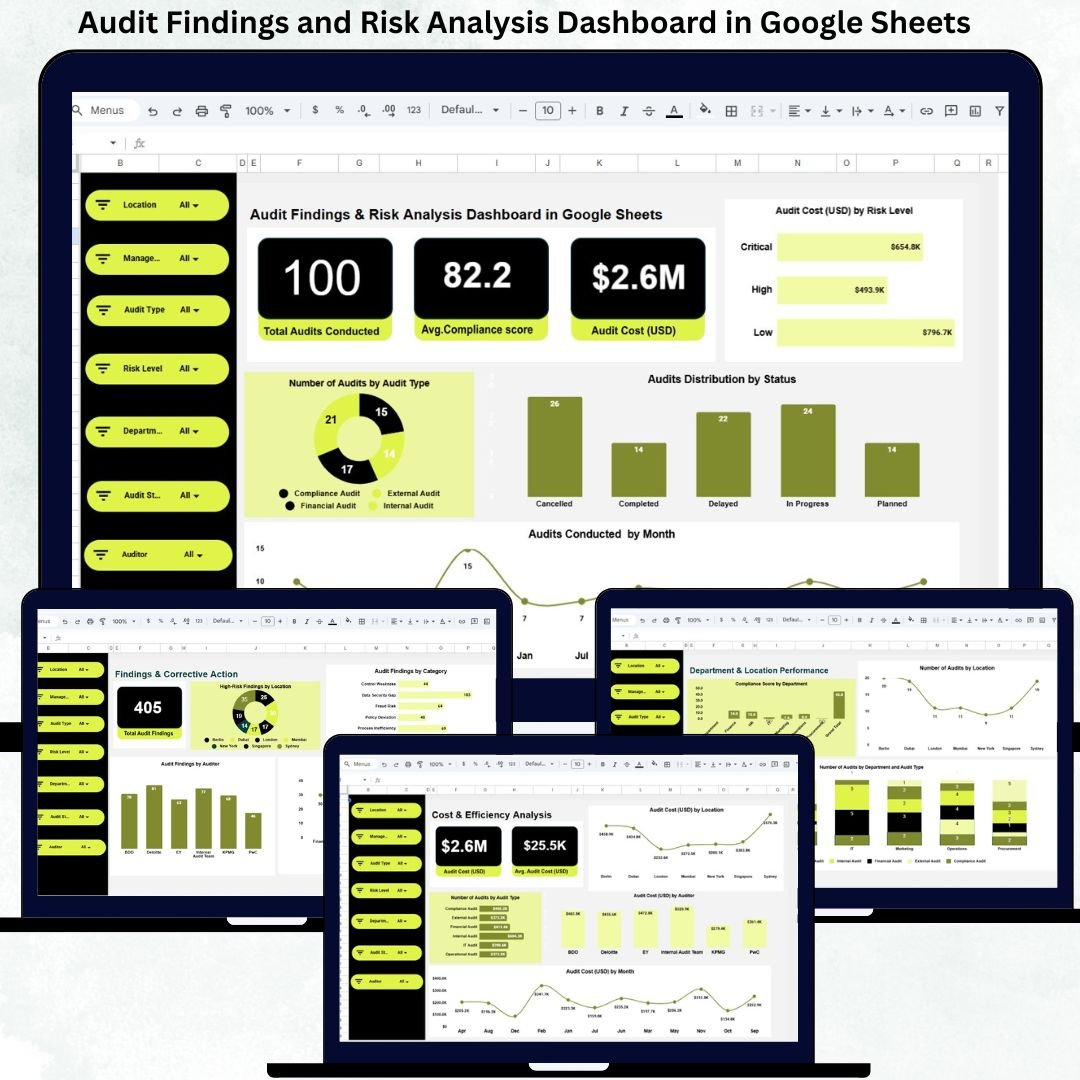
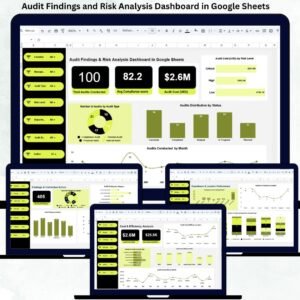
🧾 Overview Sheet – Executive Snapshot
The Overview sheet gives leadership an instant snapshot of audit health.
KPI Cards Display:
-
Total Audits Conducted
-
Average Compliance Score
-
Total Audit Cost (USD)
Overview Charts Include:
-
Audit Cost (USD) by Risk Level
-
Audits Distribution by Status
-
Number of Audits by Audit Type
-
Audits Conducted by Month
This page helps leadership understand workload trends, audit coverage, and cost drivers within seconds.
⚠️ Risk & Compliance Analysis
This section focuses on compliance quality and risk exposure.
Key Insights Include:
-
Average Compliance Score by Risk Level
-
Audit Cost (USD) by Risk Level
-
Re-Audit Requirement Distribution
-
Audit Count by Risk Level
This view helps compliance teams prioritize high-risk audits and allocate resources more effectively.
🏢 Department & Location Performance Analysis
Audits often reveal performance differences across teams and regions.
Charts in This Section Show:
-
Compliance Score by Department
-
Number of Audits by Location
-
Number of Audits by Department and Audit Type
This analysis supports targeted training, policy improvements, and governance planning.
📌 Findings & Corrective Action Analysis
This section highlights where audit issues actually occur.
Key Charts Include:
-
High-Risk Findings by Location
-
Audit Findings by Category
-
High-Risk Findings by Department
-
Audit Findings by Auditor
It helps organizations move from reporting issues to actively reducing risk.
💵 Cost & Efficiency Analysis
Managing audit costs is critical for sustainable compliance programs.
This Section Tracks:
-
Audit Cost (USD) by Location
-
Audit Cost (USD) by Auditor
-
Audit Cost (USD) by Month
Leadership can balance audit quality with financial discipline.
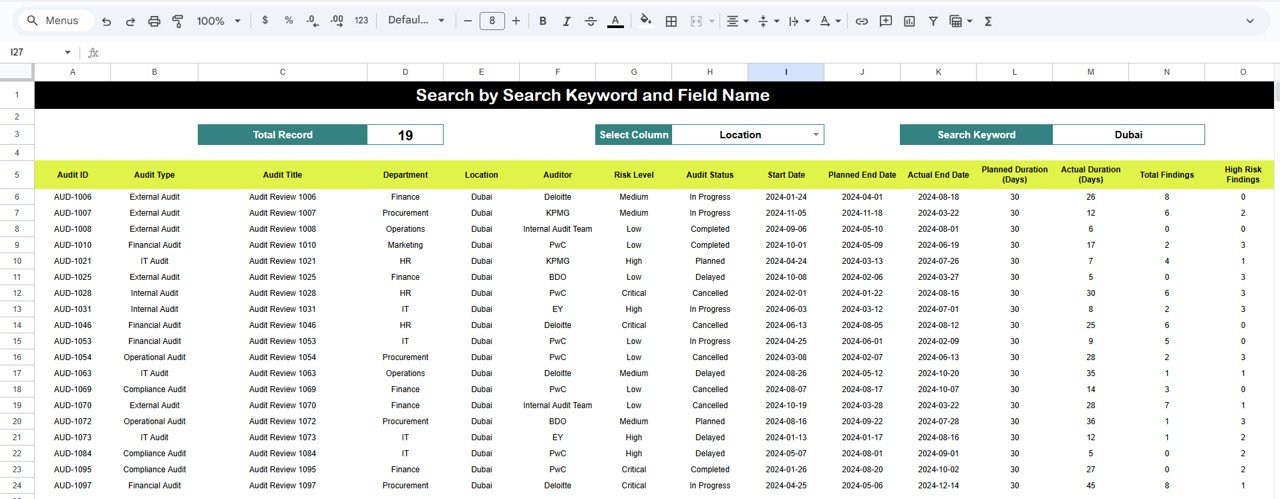
🔎 Smart Search Functionality
The built-in search panel allows users to search by:
-
Audit ID
-
Department
-
Location
-
Auditor
-
Risk Level
-
Audit Type
-
Status
Results appear instantly, saving time during reviews, investigations, and compliance checks.
🛠️ How to Use the Audit Findings & Risk Analysis Dashboard
1️⃣ Enter audit data into the data sheet
2️⃣ Review KPI cards for instant insights
3️⃣ Analyze risk, compliance, and findings
4️⃣ Monitor costs and efficiency trends
5️⃣ Use search to locate specific audits
👥 Who Can Benefit from This Dashboard
-
🧑💼 Internal & External Auditors
-
🛡️ Compliance Teams
-
⚠️ Risk Management Teams
-
🏢 Senior Leadership & Management
-
📊 Governance & Assurance TeamsAudit Findings and Risk Analysis Dashboard in Google Sheets
### Click here to read the Detailed blog post
Watch the step-by-step video tutorial:


Reviews
There are no reviews yet.