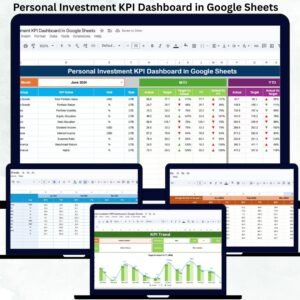
Managing personal investments without a clear performance view often leads to confusion, emotional decisions, and missed opportunities. When investments are spread across stocks, mutual funds, ETFs, bonds, and fixed deposits, tracking performance manually becomes overwhelming. Many investors rely on scattered spreadsheets, apps, or bank statements that fail to provide a consolidated picture. The Personal Investment KPI Dashboard in Google Sheets solves this problem by offering a structured, visual, and goal-oriented investment tracking system.
This ready-to-use dashboard converts raw investment numbers into meaningful KPIs, comparisons, and trends. Instead of guessing how your portfolio performs, you get instant clarity on returns, targets, growth patterns, and year-over-year progress. Because the dashboard works entirely in Google Sheets, it is flexible, cloud-based, and accessible anytime—without paid software or technical complexity.
✨ Key Features of the Personal Investment KPI Dashboard in Google Sheets
📊 Automated MTD & YTD Performance Tracking
Track Month-to-Date and Year-to-Date performance for all your personal investment KPIs. With a simple month selection, the dashboard updates automatically.
🎯 Target vs Actual Comparison
Set realistic investment targets and instantly compare them with actual results. This helps you stay disciplined and aligned with financial goals.
📈 Previous Year Comparison
Understand how your investments perform compared to last year. Year-over-year insights highlight growth consistency or performance gaps.
📉 KPI Trend Analysis
Analyze month-wise trends for individual KPIs to understand volatility, consistency, and long-term performance behavior.
🌐 Cloud-Based & Beginner-Friendly
Built in Google Sheets, the dashboard supports easy access, automatic calculations, and real-time updates without advanced finance skills.
📦 What’s Inside the Personal Investment KPI Dashboard
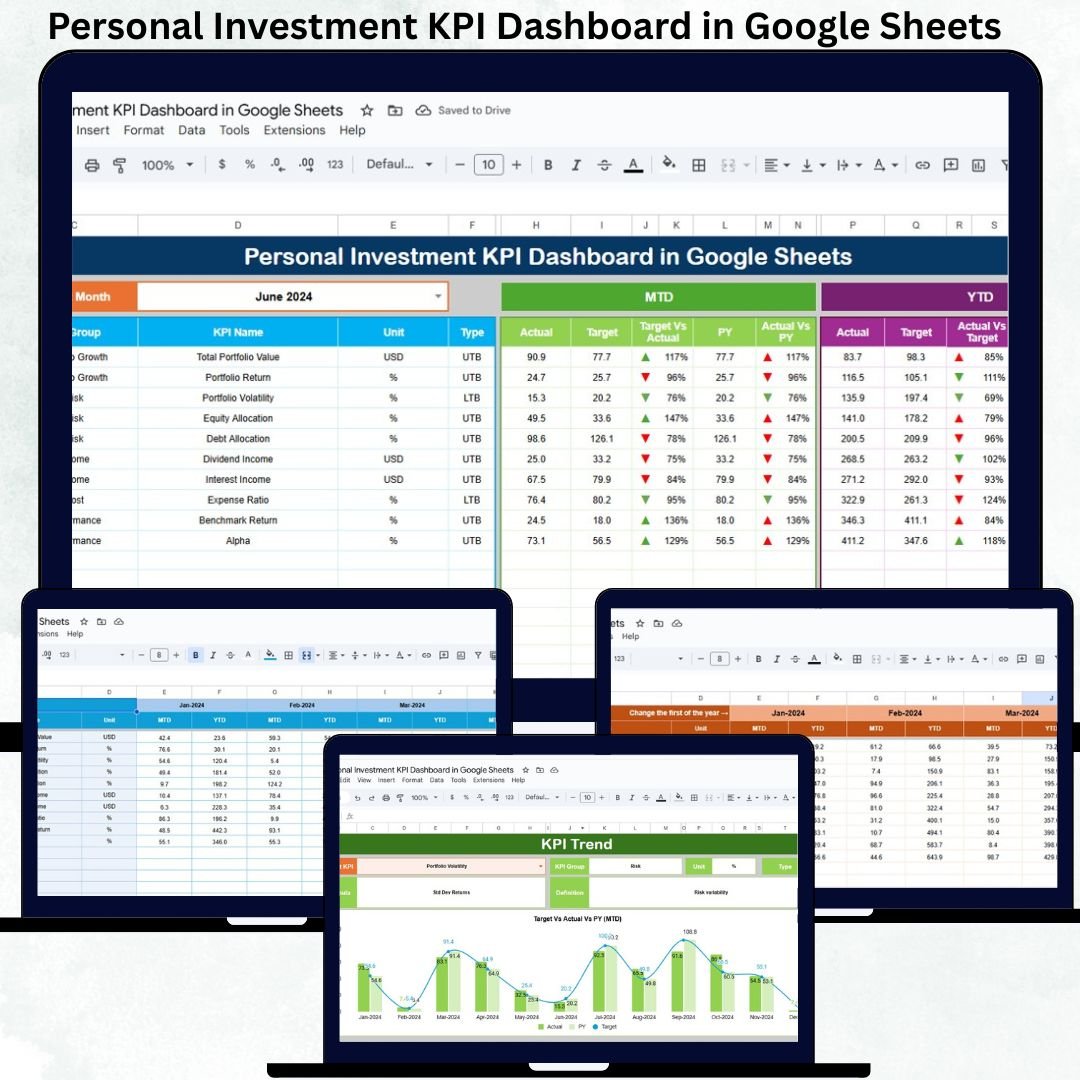
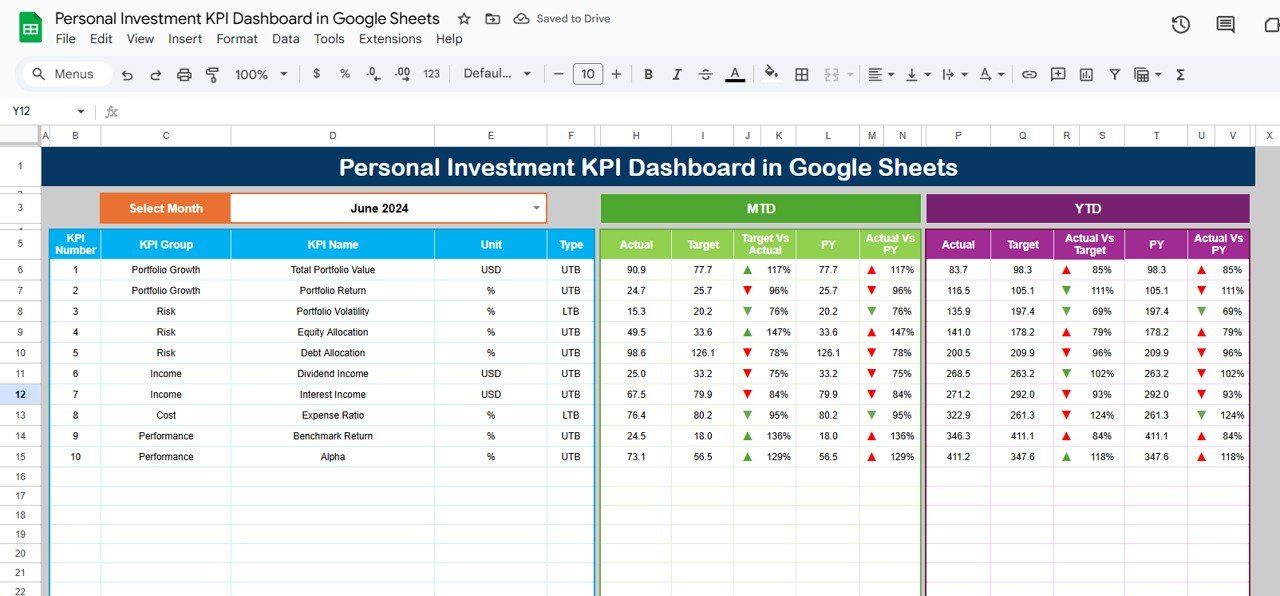
🖥️ Dashboard Sheet Tab (Main Page)
This is the central summary view of your investment performance. Select the month from cell D3, and the entire dashboard refreshes instantly.
MTD Metrics Displayed
-
Actual
-
Target
-
Previous Year
-
Target vs Actual
-
Previous Year vs Actual
YTD Metrics Displayed
-
Actual
-
Target
-
Previous Year
-
Target vs Actual
-
Previous Year vs Actual
Visual indicators make interpretation easy:
-
🟢 Green arrow → Improvement
-
🔴 Red arrow → Decline
This structure helps you understand portfolio performance in seconds.
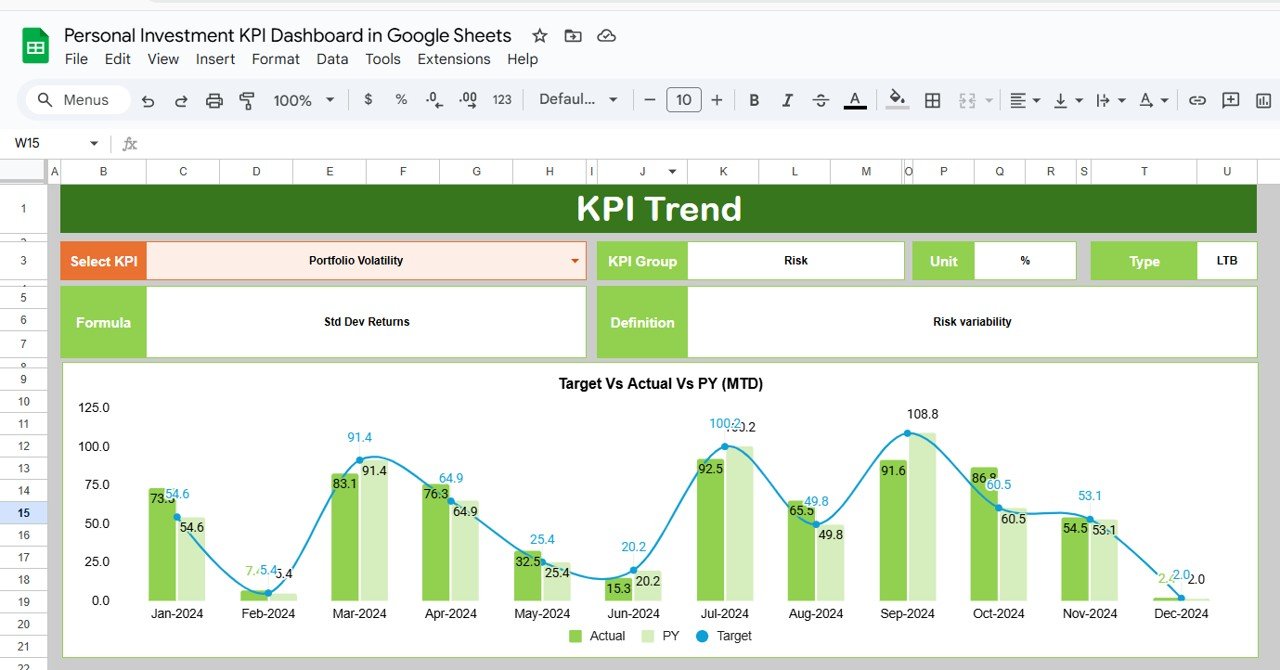
📈 KPI Trend Sheet Tab
Select a KPI from the dropdown in cell C3 to view:
-
KPI Group
-
KPI Unit
-
KPI Type (UTB / LTB)
-
KPI Formula
-
KPI Definition
Trend visuals help you identify growth stability, risk exposure, and long-term performance direction.
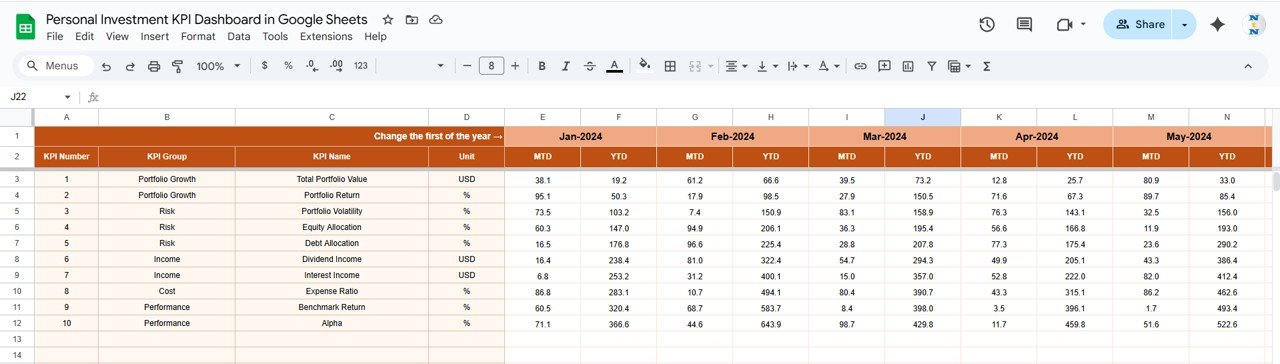
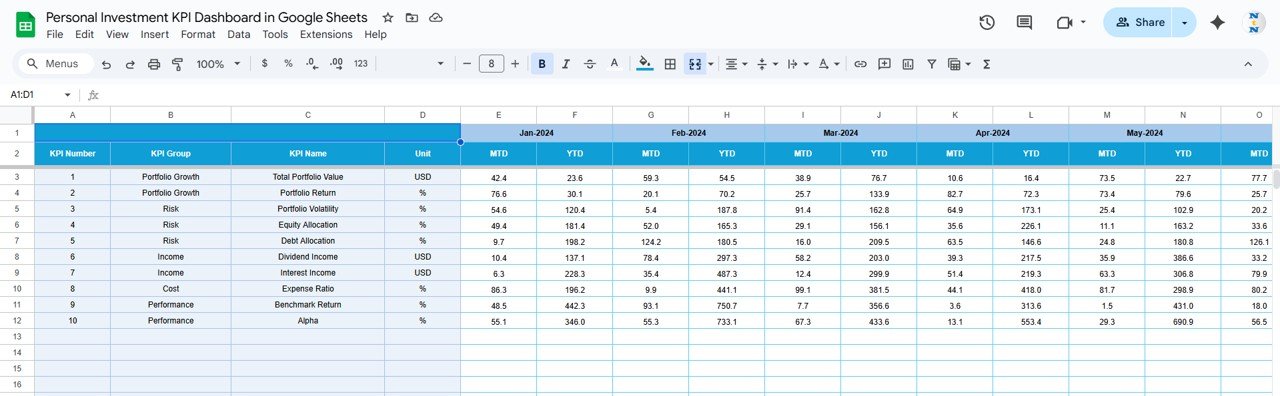
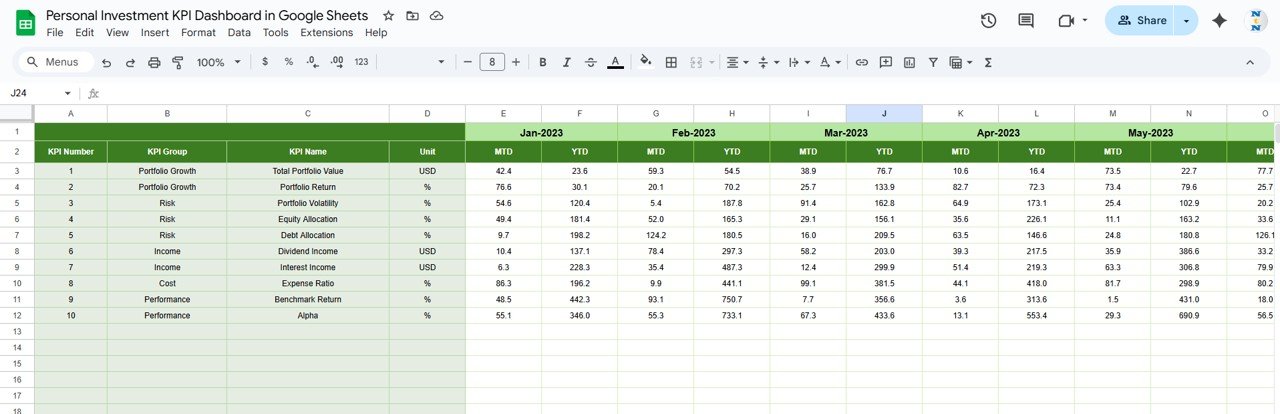
📋 Actual Number Sheet Tab
This sheet stores real investment performance values:
-
Enter MTD and YTD actual numbers
-
Select the first month of the year in cell E1
All calculations and visuals update automatically.
🎯 Target Sheet Tab
Define your expected investment goals:
-
Monthly return targets
-
Annual growth targets
-
Portfolio-level performance benchmarks
Targets help evaluate progress objectively.
📆 Previous Year Number Sheet Tab
Store last year’s investment performance to support accurate year-over-year comparison and long-term strategy review.
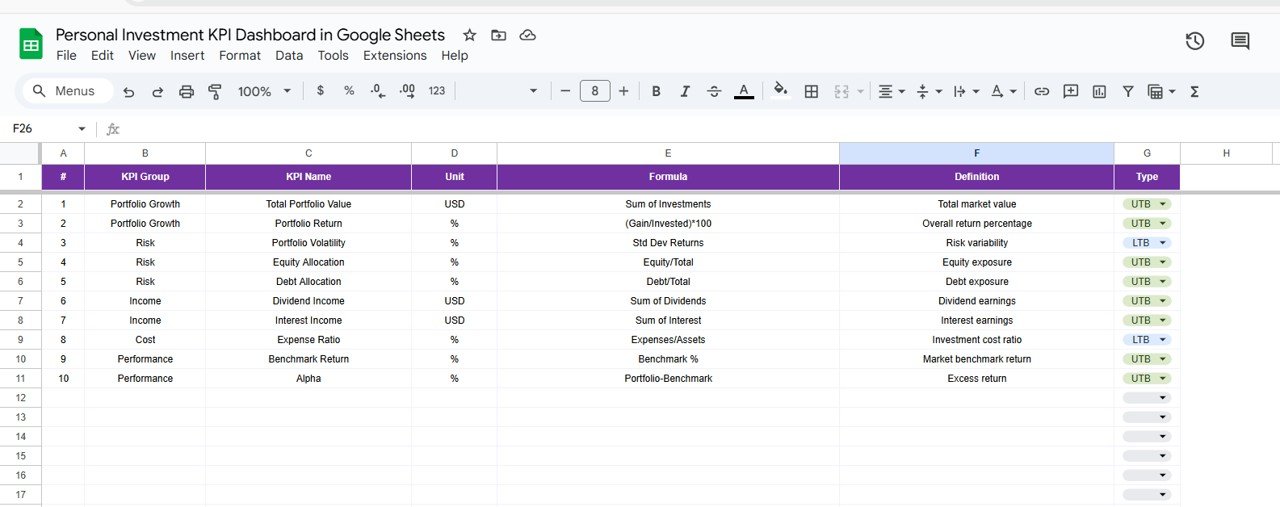
📘 KPI Definition Sheet Tab
A clear reference guide containing:
-
KPI Name
-
KPI Group
-
Unit
-
Formula
-
Definition
-
KPI Type (LTB / UTB)
This ensures consistency and clarity across all metrics.
🛠️ How to Use the Personal Investment KPI Dashboard
1️⃣ Update Actual Values Monthly
Enter updated returns or portfolio metrics regularly.
2️⃣ Set & Review Targets
Ensure goals are realistic and aligned with your risk appetite.
3️⃣ Select the Month to Refresh KPIs
One dropdown updates the entire dashboard.
4️⃣ Review Trends Quarterly
Use trend analysis for long-term planning and rebalancing decisions.
5️⃣ Compare Against Previous Year
Measure improvement and adjust strategies early.
🎯 Who Can Benefit from This Dashboard
👤 Individual Investors
Track personal wealth growth with clarity.
💼 Working Professionals
Monitor investments alongside career income.
📊 Long-Term Planners
Align portfolios with retirement or life goals.
🚀 Beginners & Experienced Investors
Simple enough for beginners, powerful for advanced users.
### Click here to read the Detailed blog post
Watch the step-by-step video tutorial:


Reviews
There are no reviews yet.