

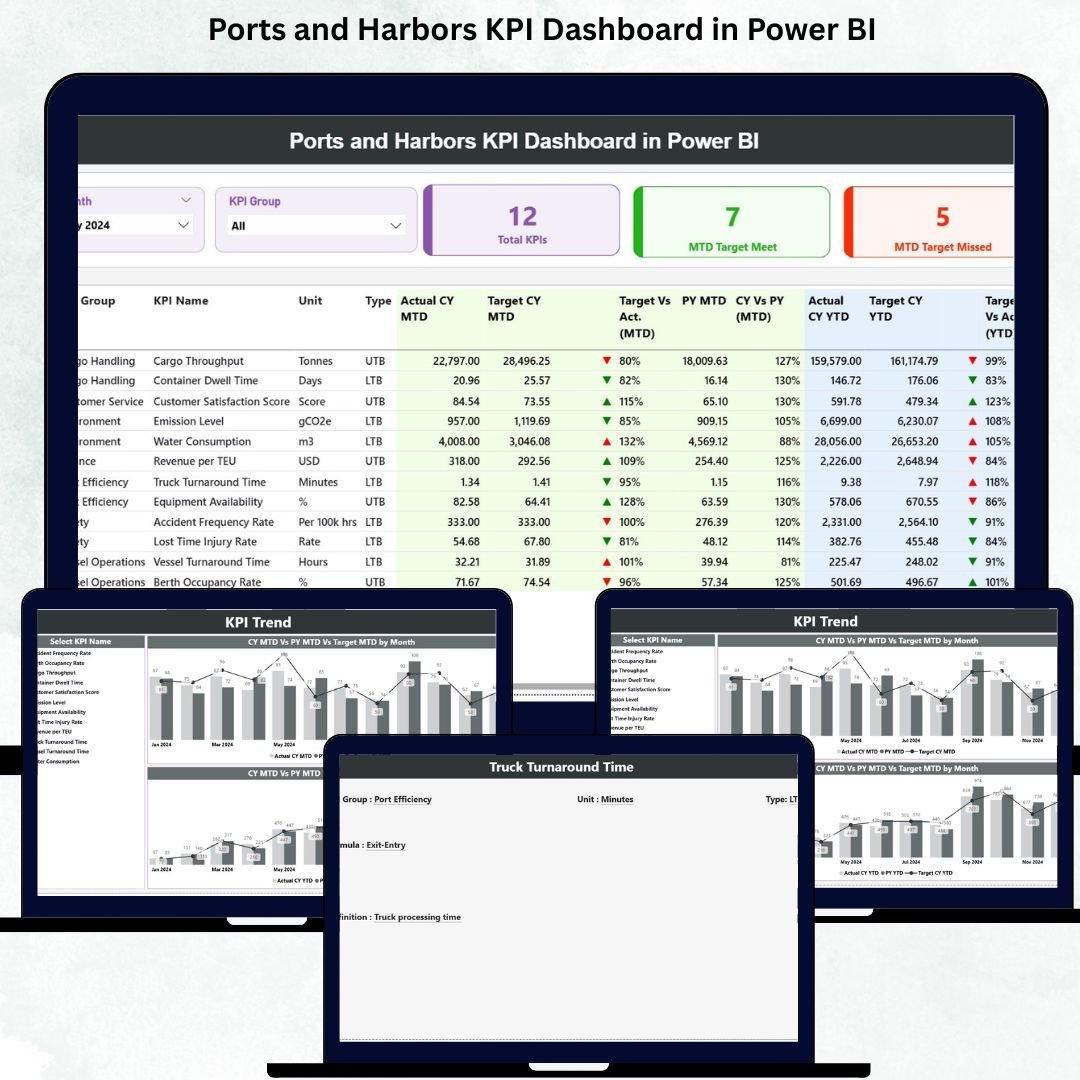

Ports and harbors are the heart of global commerce. Every day, thousands of vessels unload cargo, transfer containers, refill fuel, and navigate tight schedules. With so many moving parts—berth allocation, turnaround time, cargo handling, labor performance, vessel traffic, and equipment usage—manual reporting becomes slow, error-prone, and risky. Leaders need clarity, speed, and real-time visibility.
This is why the Ports and Harbors KPI Dashboard in Power BI is a powerful transformation tool. Ports and Harbors KPI Dashboard in Power BI It turns raw operational data into clean, visual insights that help port authorities monitor performance, detect delays instantly, and make smarter decisions. With dynamic slicers, KPI cards, monthly trends, and drill-through explanations, this dashboard becomes the control center for every maritime team.
Since it connects to a simple Excel file, updating the dashboard requires zero technical expertise. Just input monthly figures → refresh Power BI → start analyzing. Whether you manage cargo operations, port scheduling, fuel usage, or harbor administration, this dashboard gives you complete visibility in seconds.
Let’s explore everything inside this powerful maritime analytics tool 👇
✨ Key Features of the Ports and Harbors KPI Dashboard in Power BI
🚢 Monitor All Port Operations in One Dashboard
Track vessel traffic, cargo movement, turnaround time, berth utilization, equipment performance, and resource usage—all in one smart interface.
🎯 KPI Cards for Instant Performance Clarity
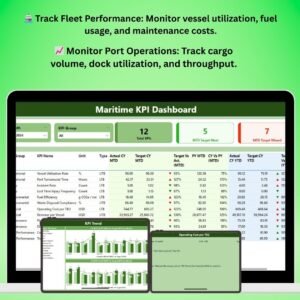
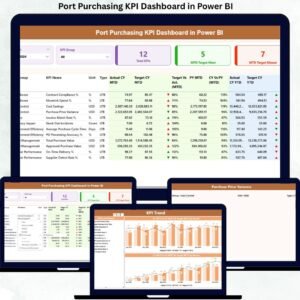
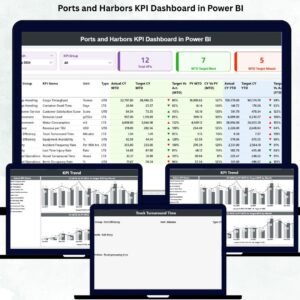
The Summary Page displays:
Total KPIs Count
MTD Target Met Count
MTD Target Missed Count
With green and red arrows, leaders know exactly where performance meets expectations and where action is needed.
🧭 Dynamic Slicers for Quick Filtering
Filter by Month and KPI Group to refresh all visuals instantly. Perfect for quick reviews, meetings, and operational discussions.
📈 MTD & YTD Insights in One View
Compare Actual vs Target vs Previous Year for both monthly and yearly performance. This side-by-side clarity helps detect operational bottlenecks immediately.
📊 Trend Analytics for Smarter Maritime Planning
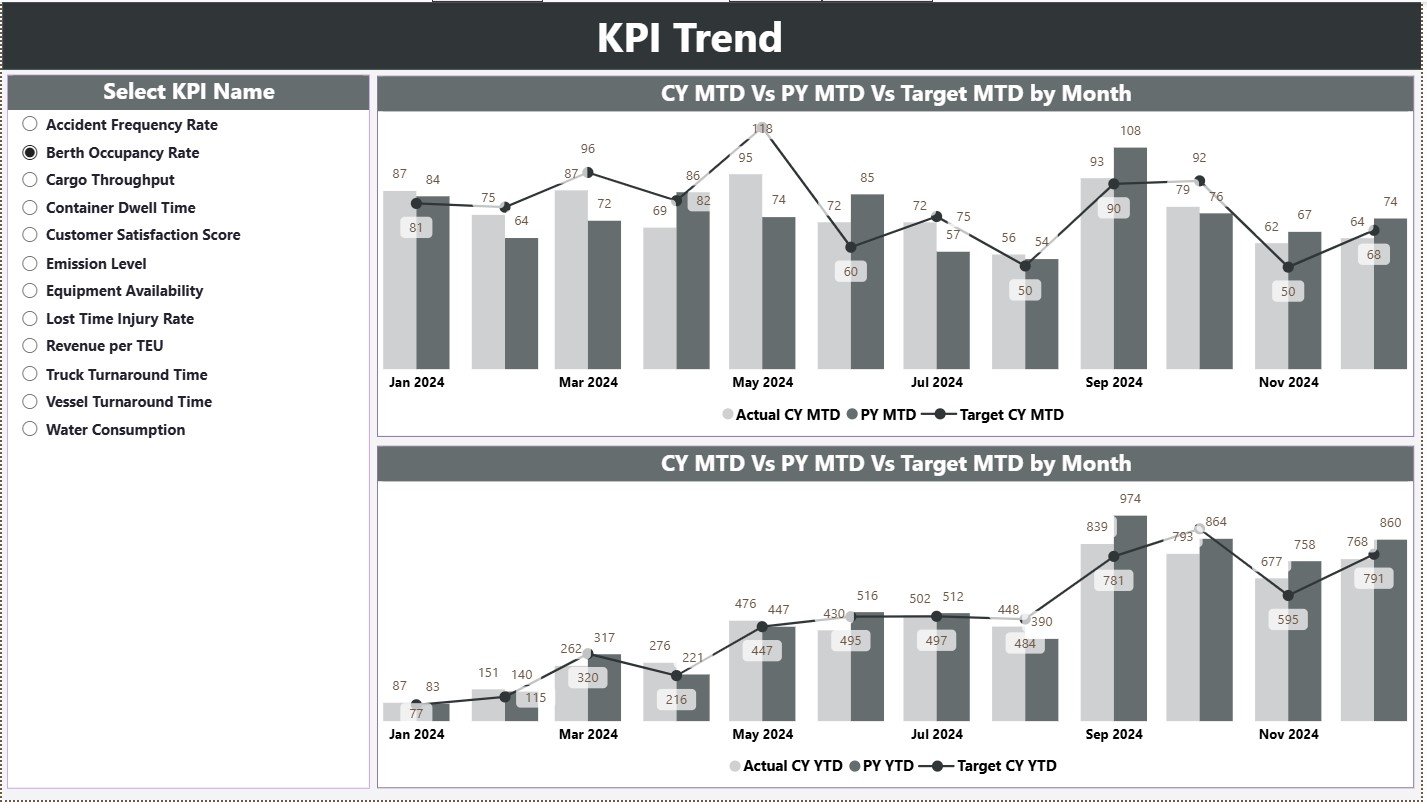
The KPI Trend Page includes combo charts that show:
Current Year MTD
Previous Year MTD
MTD Targets
Current Year YTD
Previous Year YTD
YTD Targets
These trends reveal seasonal patterns, operational fluctuations, delays, and opportunities for improvement.
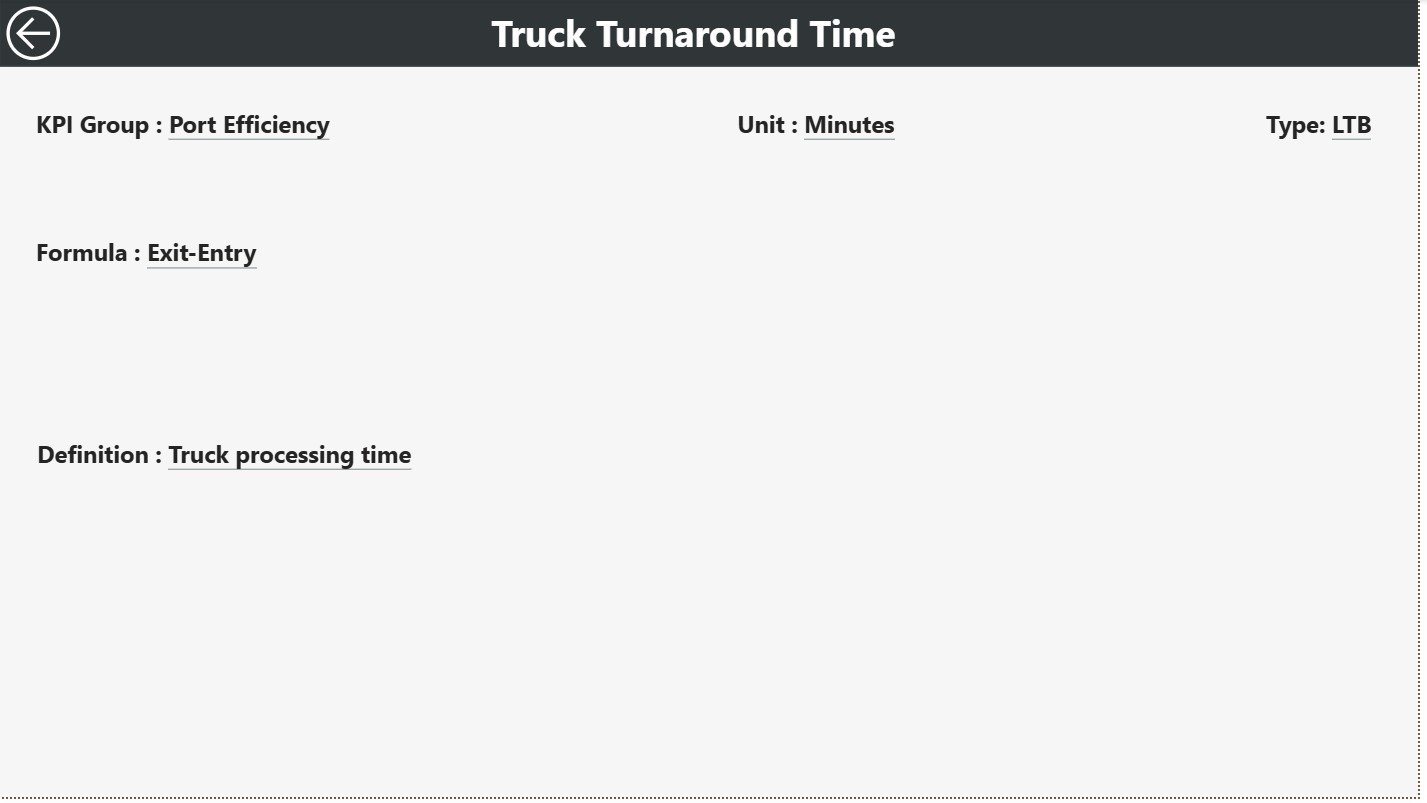
🔍 Drill-Through KPI Definitions for Transparency
Right-click any KPI → drill through to see:
KPI Number
Group
Formula
Unit
Definition
Type (UTB/LTB)
This eliminates confusion and helps standardize KPIs across departments.
📥 Excel-Driven Data Updates
All input comes from three simple sheets—Actual, Target, and Definition. Anyone can update the data without technical skills.
📦 What’s Inside the Ports and Harbors KPI Dashboard in Power BI
Your dashboard includes three structured pages, each designed to improve maritime decision-making.
✔ Summary Page – Your Operational Command Center
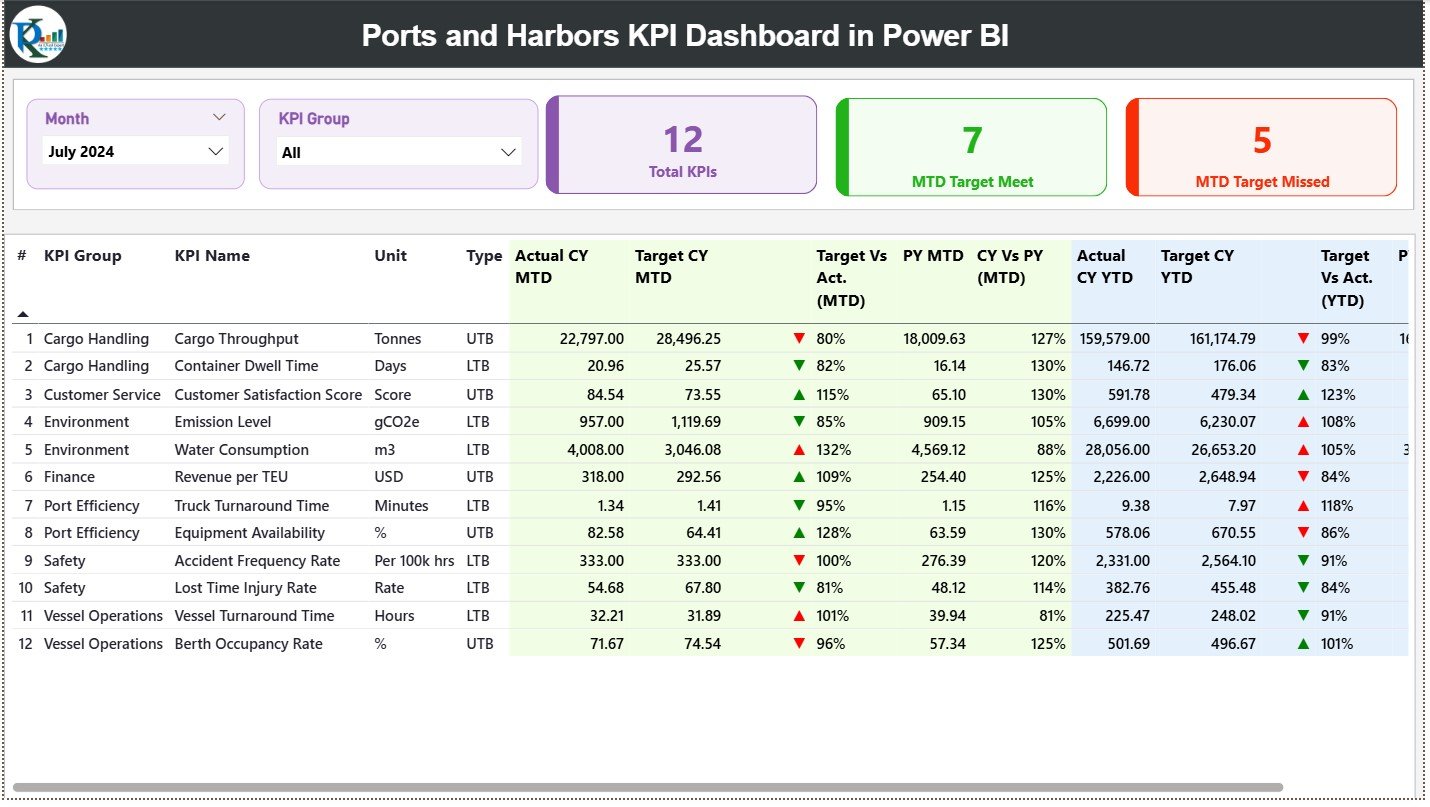
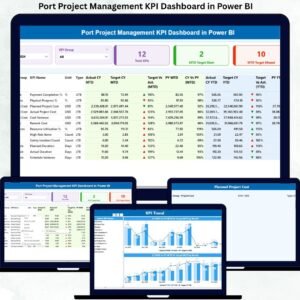
The Summary Page provides a quick overview of everything happening inside the port.
It includes:
Month & KPI Group slicers
KPI status cards
A detailed performance table with:
MTD Actual
MTD Target
Target vs Actual %
Previous Year MTD
CY vs PY (MTD)
YTD Actual
YTD Target
Target vs Actual % (YTD)
Performance icons
This page offers a complete picture of port efficiency in real time.
✔ KPI Trend Page – Understand Monthly & Yearly Patterns
This page uses combo charts to compare present vs past performance.
It helps maritime teams analyze:
Turnaround time patterns
Utility consumption
Cargo throughput variations
Equipment productivity
Berth occupancy changes
Seasonal fluctuations
Trend analysis empowers leaders to take proactive action.
✔ KPI Definition Page – Documentation with Clarity
This drill-through page shows detailed KPI definitions, formulas, and units.
It builds transparency and ensures everyone interprets KPIs in the same way.
✔ Excel Data Source (Backend)
The dashboard connects to three sheets:
Input_Actual
Input_Target
KPI Definition
This makes the dashboard simple, lightweight, and easy to maintain.
🛠 How to Use the Ports and Harbors KPI Dashboard in Power BI
Using the dashboard is simple:
➤ Step 1: Update Actual & Target Data
Fill the Input_Actual and Input_Target sheets with monthly MTD and YTD numbers.
➤ Step 2: Update KPI Definitions
Enter KPI names, formulas, units, groups, and types.
➤ Step 3: Refresh Power BI
Your entire dashboard updates instantly.
➤ Step 4: Use Slicers to Explore Insights
Filter by month or KPI group for deeper analysis.
➤ Step 5: Review Trends & Take Action
Use combo charts to detect unusual shifts or performance gaps.
👥 Who Can Benefit from This Dashboard
This tool is perfect for:
⚓ Port managers
🚢 Harbor authorities
📦 Cargo operation teams
🛠 Equipment & maintenance teams
📊 Maritime planners and analysts
🛳 Vessel scheduling teams
⛽ Fuel and utility departments
If you manage port operations, this dashboard will transform the way you monitor performance.
### Click here to read the Detailed blog post
Visit our YouTube channel to learn step-by-step video tutorials
Watch the step-by-step video tutorial:
Compatibility and Requirements
- Opens in Power BI Desktop, which is free from Microsoft. See Get Power BI Desktop.
- The data comes from three Excel sheets: Input_Actual, Input_Target and KPI Definition. Update them and click Refresh.
Frequently Asked Questions
Which pages does the dashboard have?
Three: Summary, KPI Trend and a KPI Definition drill-through page.
What do the KPI cards show?
Total KPIs Count, MTD Target Met Count and MTD Target Missed Count, with green and red arrows.
How do I filter it?
Use the Month and KPI Group slicers to refresh all visuals.
How do I see a KPI’s formula?
Right-click a KPI and drill through to see its number, group, formula, unit, definition and type.
Which port areas can I track?
Vessel traffic, cargo movement, turnaround time, berth utilization, equipment performance and resource usage.
Related Port and Maritime Templates
- Ports and Harbors KPI Dashboard in Excel: the same KPIs for Excel users
- Ports and Harbors Dashboard in Power BI: analyzes port operations data
- Maritime KPI Dashboard in Power BI: wider maritime KPIs
- Shipping & Cargo KPI Dashboard in Power BI: tracks shipping and cargo
- Logistics and Transportation Hub: 7 Excel and Power BI logistics templates in one bundle
Browse all Power BI KPI dashboards or the Power BI dashboards.
















Reviews
There are no reviews yet.