
Sovereign wealth funds (SWFs) operate at a massive scale, managing billions of dollars across global markets. Sovereign Wealth Funds Dashboard in Power BI With investments spread across asset classes, industries, and regions, tracking performance becomes challenging. Sovereign Wealth Funds Dashboard in Power BI Static reports and scattered spreadsheets make it difficult for analysts and decision-makers to spot risks early or identify growth opportunities.
Sovereign Wealth Funds Dashboard in Power BI To solve this problem, the Sovereign Wealth Funds Dashboard in Power BI brings everything into one powerful, real-time, interactive dashboard. Built for investment teams, fund managers, analysts, risk officers, and leadership, Sovereign Wealth Funds Dashboard in Power BI this dashboard transforms raw Excel data into meaningful insights using dynamic visuals, KPIs, and trend charts.
Sovereign Wealth Funds Dashboard in Power BI Whether you want to understand market exposure, compare funds, track volatility, evaluate sectors, or study month-to-month patterns—this dashboard gives you a complete 360° view of your entire investment portfolio.
✨ Key Features of the Sovereign Wealth Funds Dashboard in Power BI
This dashboard includes five analytical pages, each designed to simplify complex investment monitoring.
📌 What’s Inside the Sovereign Wealth Funds Dashboard
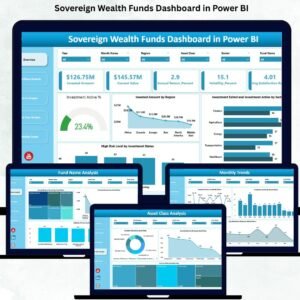
1. Overview Page – Complete Snapshot of Portfolio Health
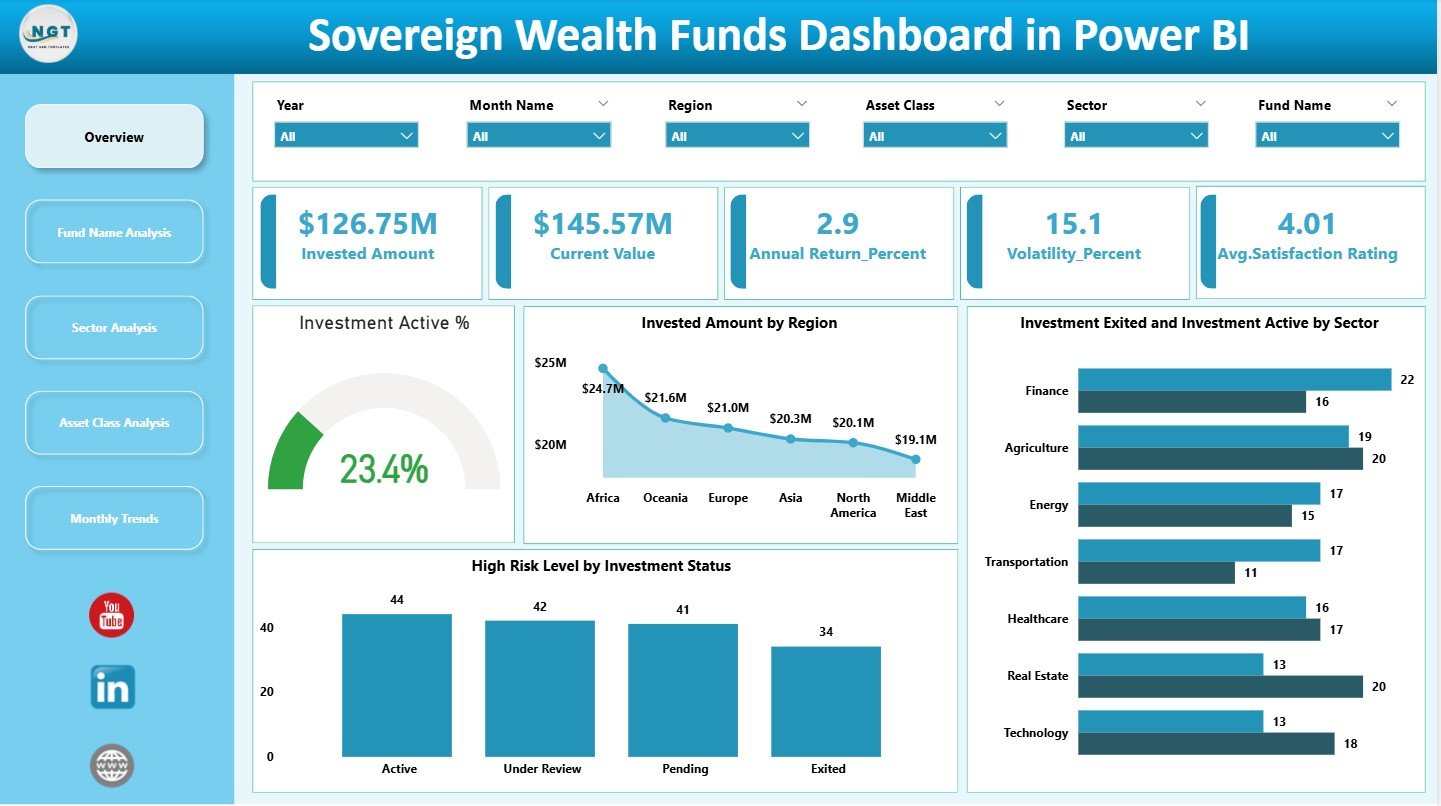
This is the main control center of the dashboard. It shows:
🔹 Investment Amount
🔹 Current Value
🔹 Annual Return %
🔹 Volatility %
🔹 Average Satisfaction Rating
With slicers on the right side, users filter data by region, asset class, sector, or fund name.
Key charts include:
📊 Investment Active %
📊 Investment Exited vs Active by Sector
📊 Invested Amount by Region
📊 High-Risk Level by Investment Status
This page helps leadership understand overall performance instantly.
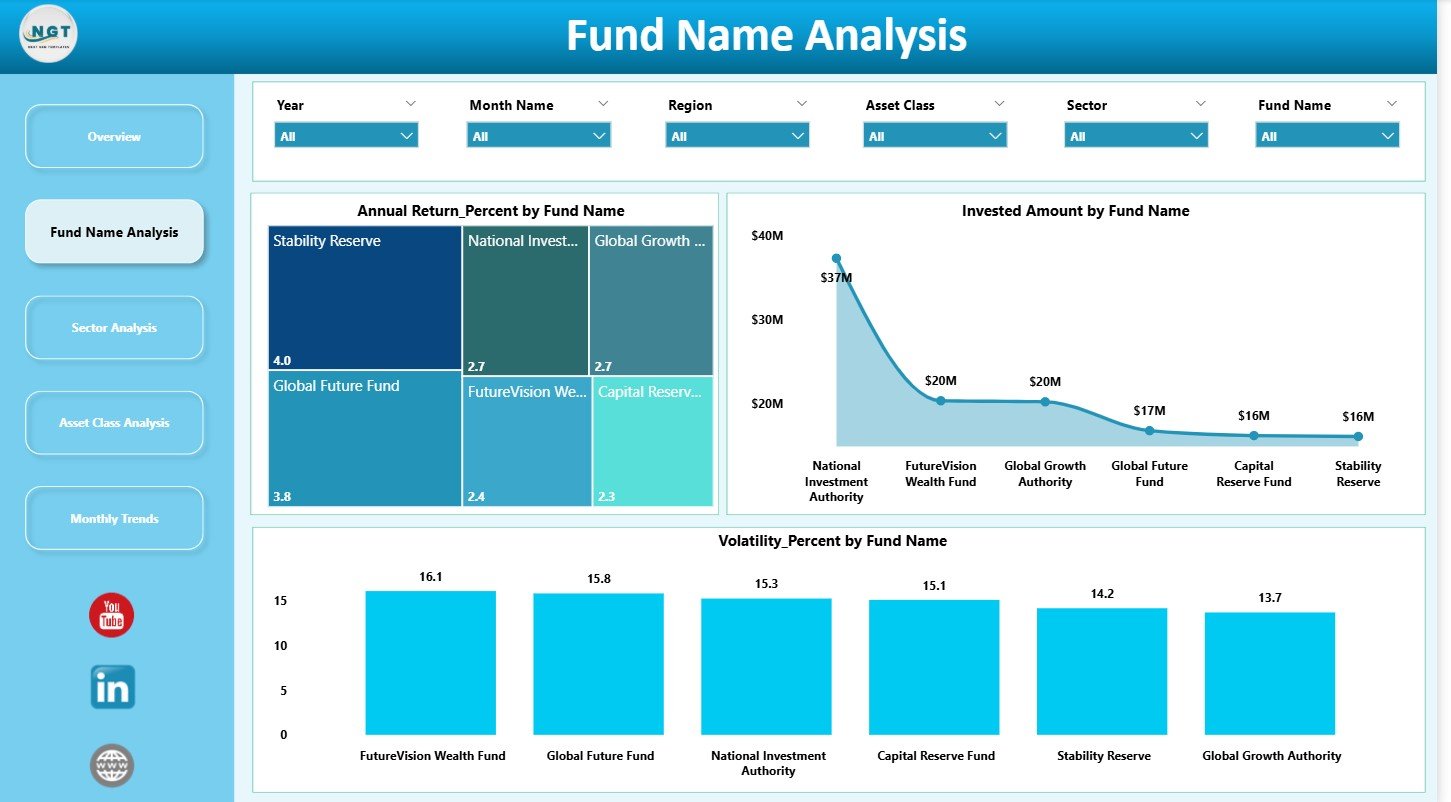
2. Fund Name Analysis – Compare Funds with Precision
Every sovereign wealth fund often manages multiple investment portfolios. This page compares:
✔ Annual Return % by Fund Name
✔ Invested Amount by Fund Name
✔ Volatility % by Fund Name
The insights help identify:
⭐ High-performing funds
⚠️ Underperforming or volatile funds
📈 Funds requiring strategic intervention
This aids long-term planning and fund restructuring.
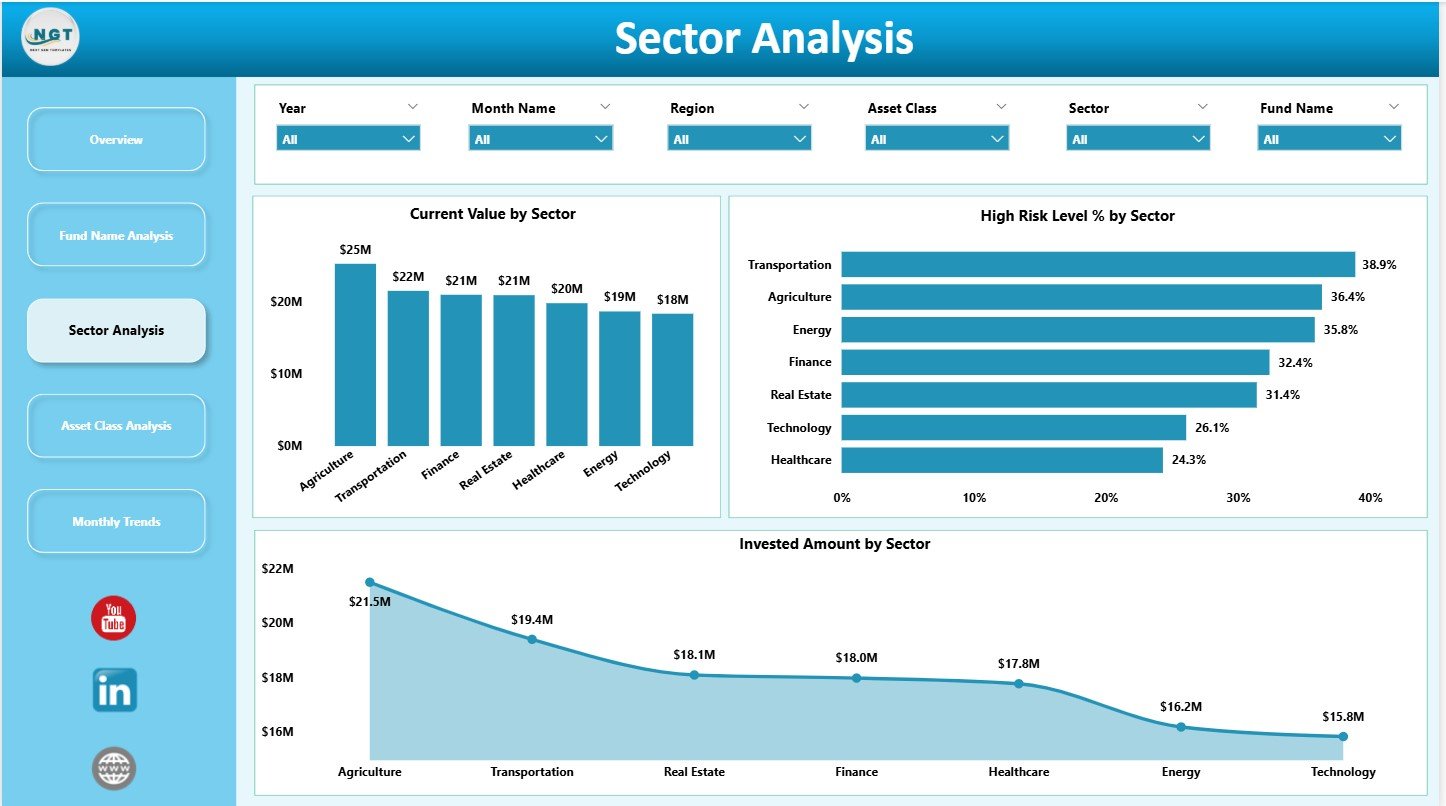
3. Sector Analysis – Evaluate Industry-Level Strength
Sectors behave differently in each economic cycle. This page reveals:
✔ Current Value by Sector
✔ High-Risk Level % by Sector
✔ Invested Amount by Sector
It helps identify sectors providing:
💡 High stability
⚠️ Rising risk
📉 Declining performance
📈 High potential returns
Perfect for guiding diversification and strategic allocation.
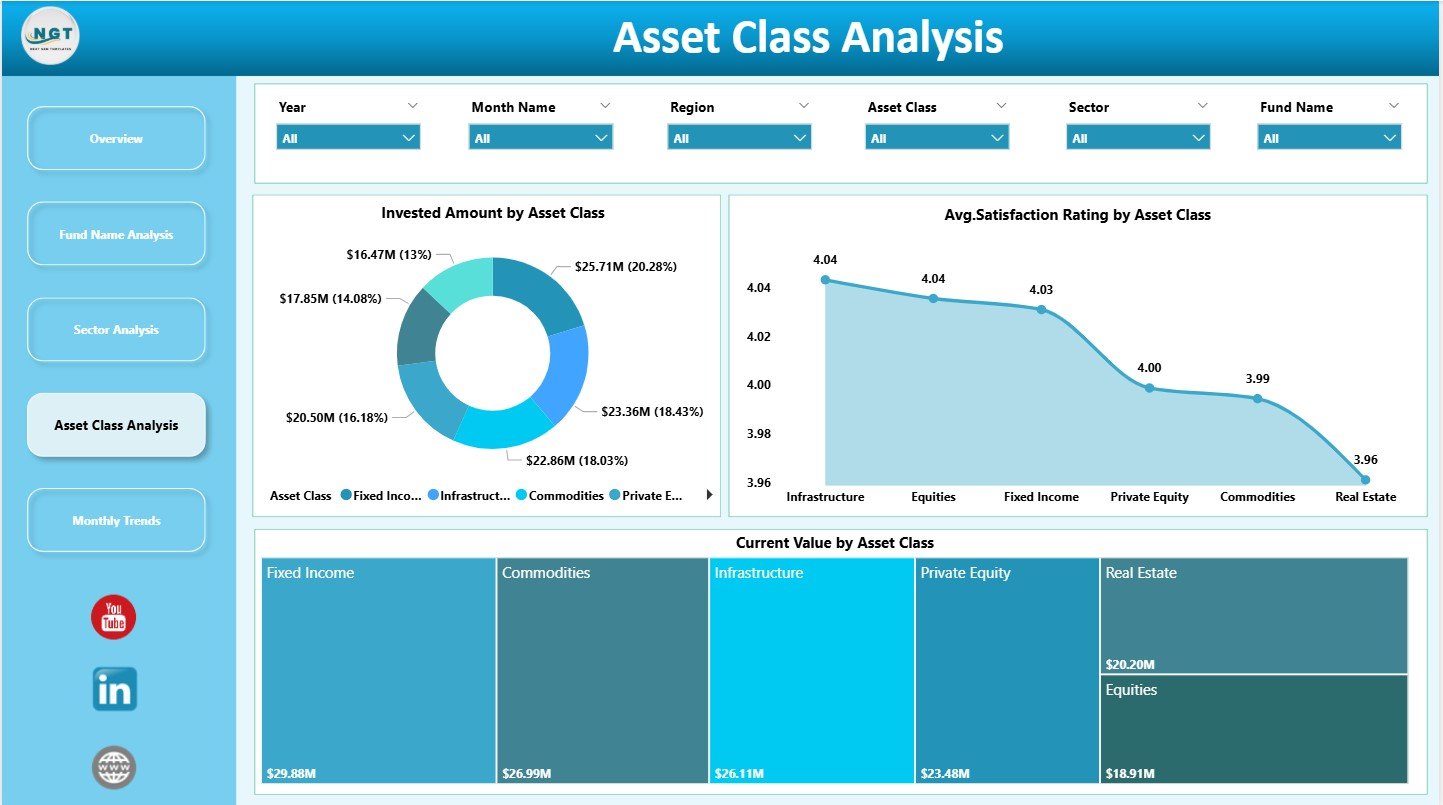
4. Asset Class Analysis – Balance Risk & Reward
Sovereign wealth funds diversify across asset classes such as equities, bonds, real estate, private equity, and infrastructure.
This page shows:
✔ Invested Amount by Asset Class
✔ Average Satisfaction Rating
✔ Current Value by Asset Class
Users understand which asset classes deliver strong growth and which require rebalancing.
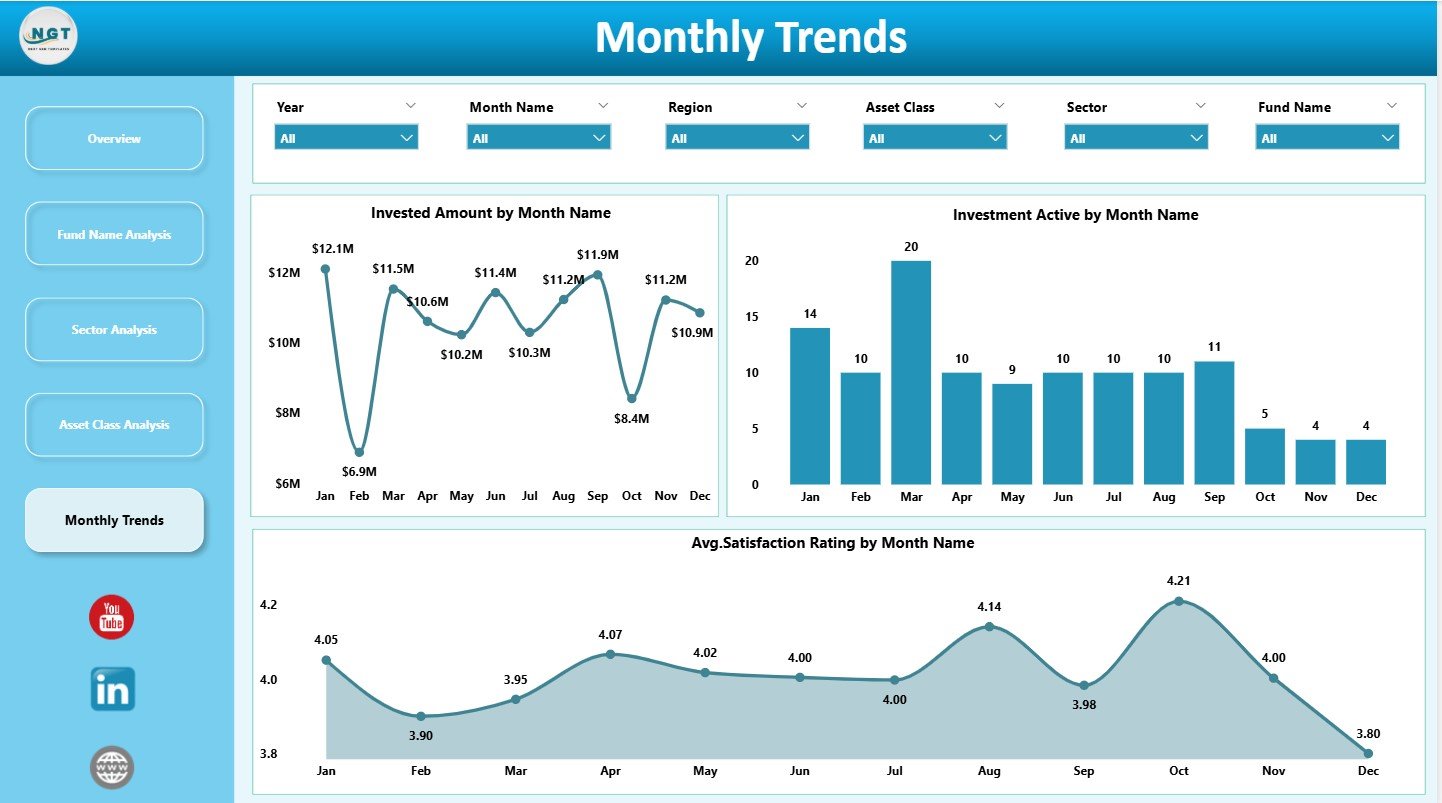
5. Monthly Trends – Identify Patterns & Market Movements
Monthly changes reveal seasonal performance and market timing.
This page includes:
📈 Invested Amount by Month
📉 Investment Active % by Month
⭐ Average Satisfaction Rating by Month
It helps decision-makers forecast better and improve timing strategies.
📦 How to Use the Sovereign Wealth Funds Dashboard
Using this dashboard is simple:
1️⃣ Update the Excel source file with new investment data
2️⃣ Refresh the Power BI dashboard
3️⃣ Use slicers to filter portfolio insights
4️⃣ Compare performance across sectors, funds, regions & asset classes
5️⃣ Review monthly patterns to forecast like a pro
6️⃣ Identify risks early through volatility & high-risk visuals
With just a few clicks, teams get complete visibility.
🎯 Who Can Benefit from This SWF Dashboard?
This dashboard is ideal for:
✔ Sovereign Wealth Funds
✔ Government Investment Entities
✔ Pension Funds
✔ Financial Analysts
✔ Portfolio Managers
✔ Risk & Compliance Teams
✔ Strategic Planning Departments
Any organization managing large, diversified investments will gain immense value from this solution.
⚡ How This Dashboard Improves Decision-Making
✔ Real-time portfolio monitoring
✔ Better understanding of risk & volatility
✔ Faster investment evaluation
✔ Stronger long-term strategy
✔ Improved diversification decisions
✔ Transparency across departments
✔ Reduced dependency on static spreadsheets
This dashboard helps funds stay ahead in competitive and fast-changing markets.


Reviews
There are no reviews yet.