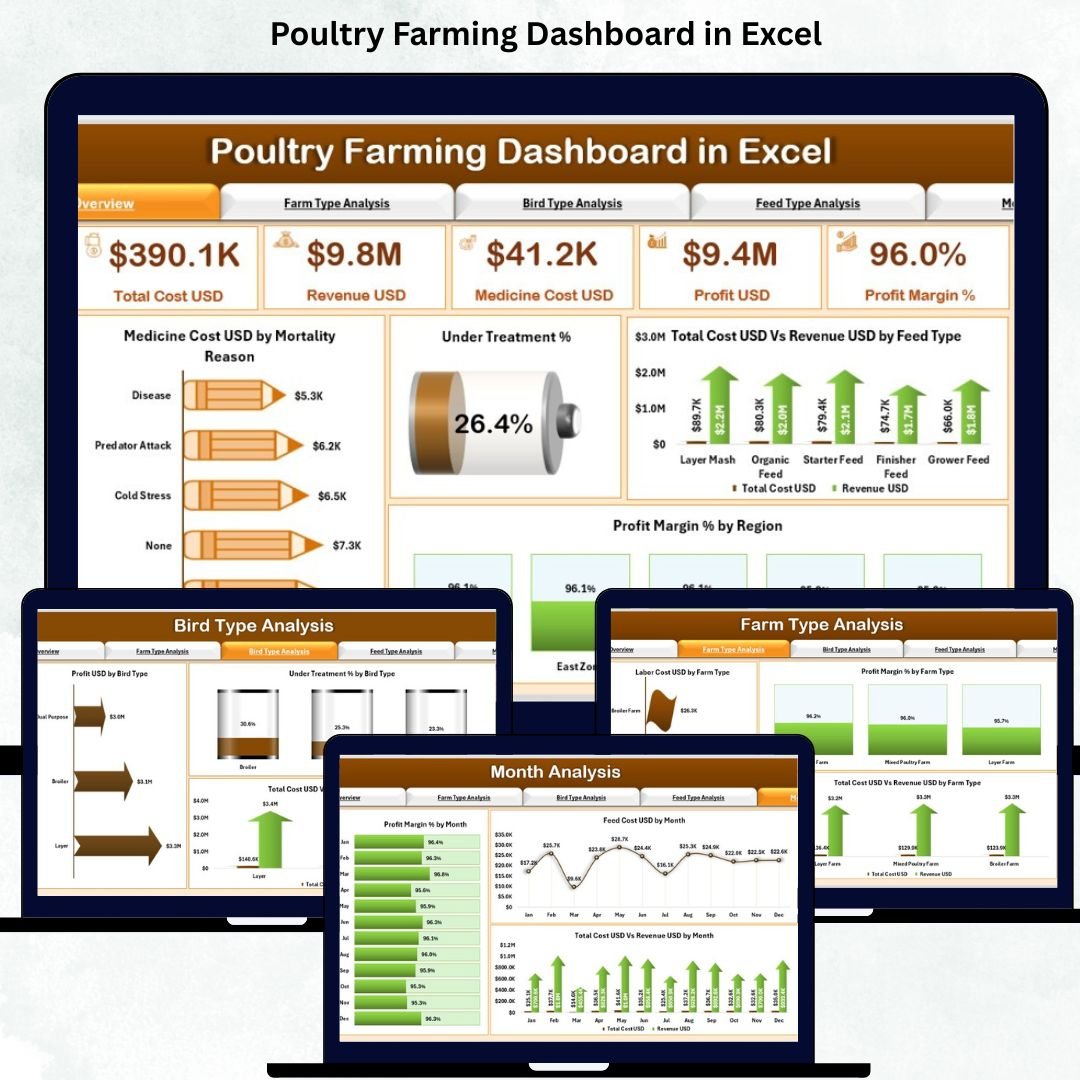
Poultry farming involves continuous monitoring, smart planning, and quick decision-making. Farmers handle thousands of birds, manage multiple costs, monitor feed and medicine usage, and track profit margins every day. As the farm grows, data becomes difficult to manage manually. That’s where the Poultry Farming Dashboard in Excel becomes a complete game changer. This ready-to-use dashboard converts complicated poultry farm data into clear visuals, charts, and KPIs—helping farmers understand performance instantly.
Whether you run broiler farms, layer farms, breeder farms, or multiple units across regions, this dashboard gives you the insights you need to improve profitability. With easy slicers, a simple page navigator, and automated calculations, even non-technical users can operate it confidently. It delivers clarity, speed, and accuracy—everything a modern poultry business needs.
🔥 Key Features of the Poultry Farming Dashboard in Excel
The dashboard contains powerful features that simplify daily farm management.
📍 1. Page Navigator for Easy Navigation
The left-side navigator lets users move across all five pages instantly. This saves time and makes analysis smooth.
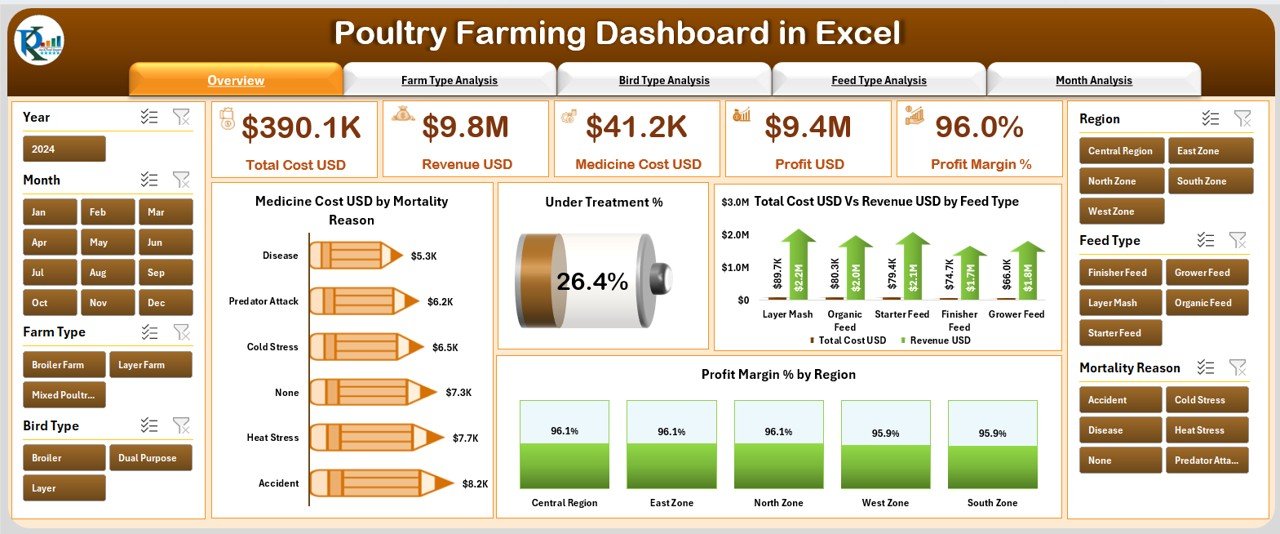
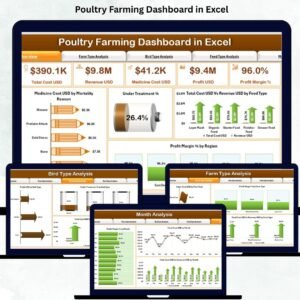
📊 2. Overview Page – Complete Farm Snapshot
With slicers for region, month, bird type, farm type, and feed type, farmers can filter data from every angle.
This page provides five real-time KPI cards such as:
-
Total Birds
-
Total Revenue
-
Total Cost
-
Average Profit Margin
-
Under Treatment %
-
Mortality Rate
Four important charts also help farmers analyze overall farm health:
-
Medicine Cost (USD) by Mortality Reason
-
Under Treatment %
-
Total Cost vs Revenue by Feed Type
-
Profit Margin % by Region
These visuals allow farmers to understand performance within seconds.
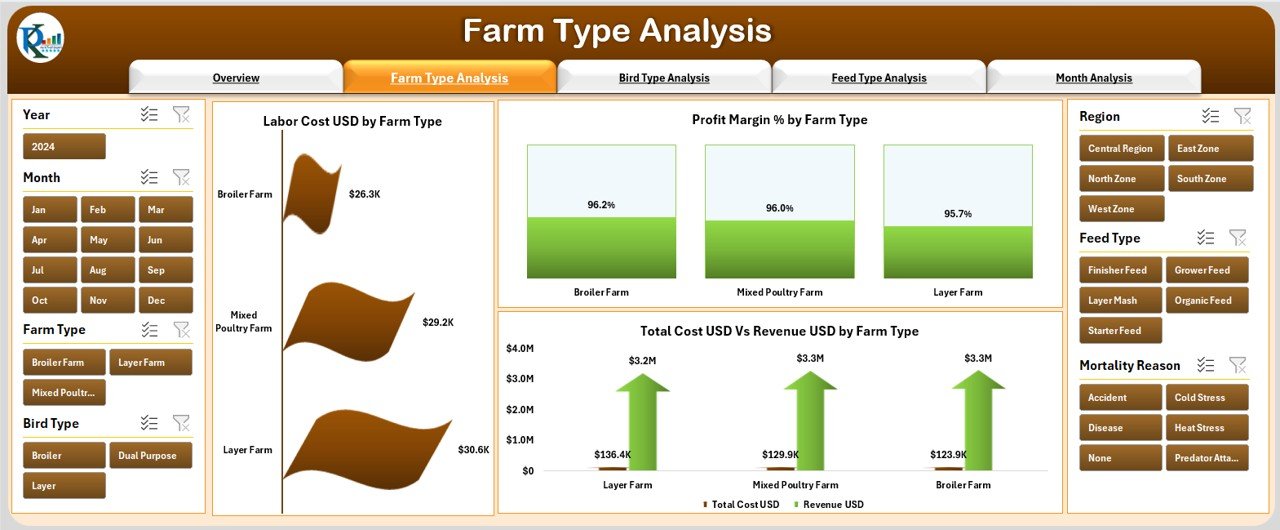
🏡 3. Farm Type Analysis Page
This page compares performance across different farm categories such as broiler, breeder, layer, or contract farms.
It includes charts for:
-
Labor Cost by Farm Type
-
Profit Margin % by Farm Type
-
Total Cost vs Revenue by Farm Type
This helps identify which farm type performs best.
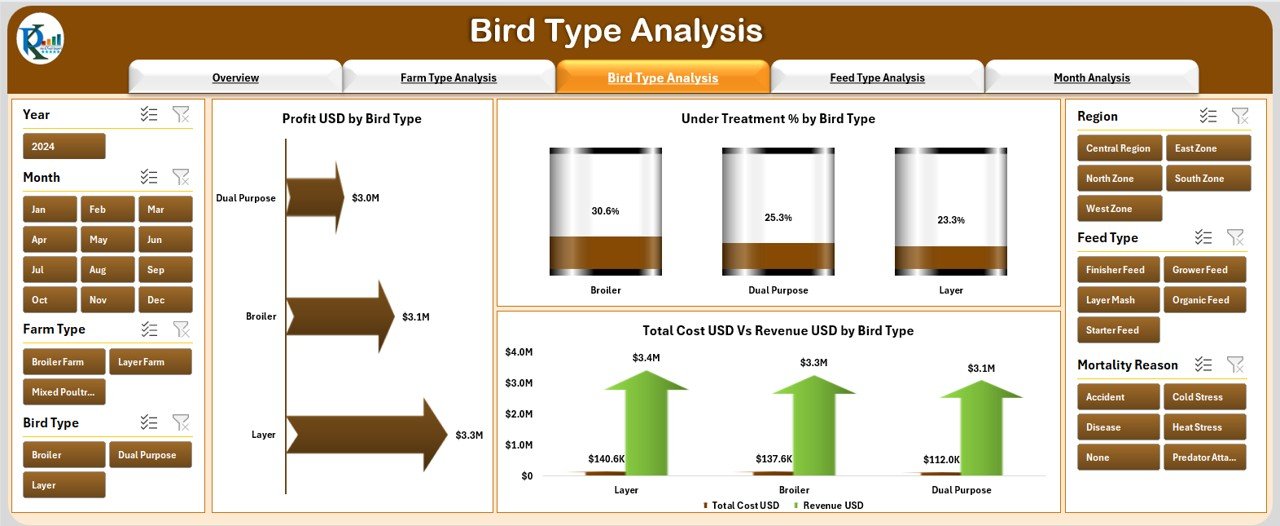
🐓 4. Bird Type Analysis Page
Bird performance directly impacts profitability.
This page compares broilers, layers, breeders, ducks, country chickens, and turkeys.
Charts include:
-
Profit by Bird Type
-
Total Cost vs Revenue by Bird Type
-
Under Treatment % by Bird Type
Farmers can identify the most profitable bird type and spot health concerns early.
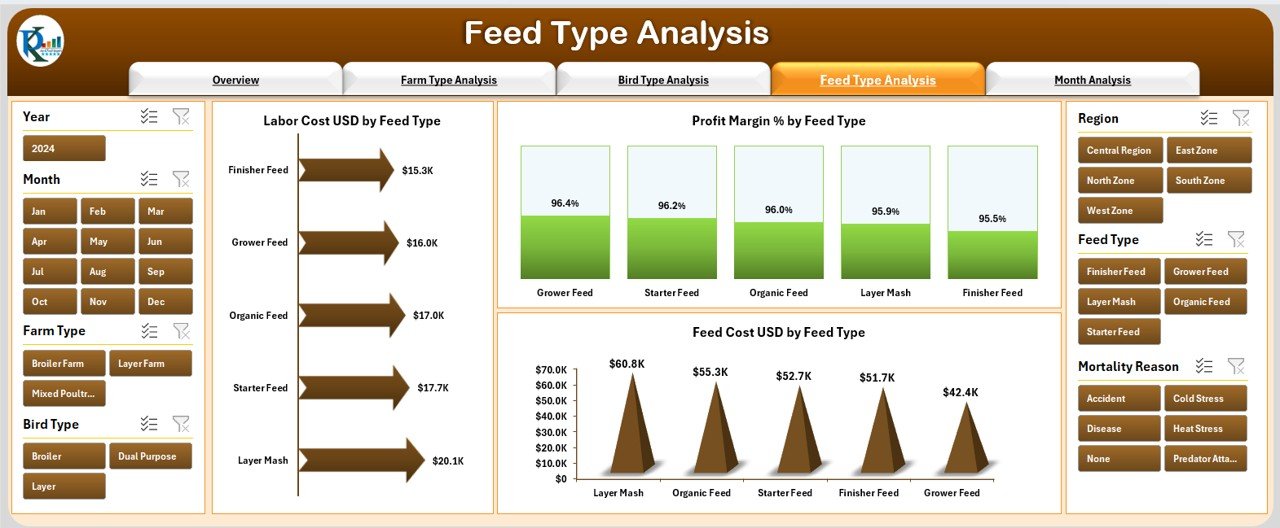
🌾 5. Feed Type Analysis Page
Feed takes up 60–70% of poultry expenses. This page helps control feed-related costs with visuals such as:
-
Profit Margin % by Feed Type
-
Total Cost vs Revenue by Feed Type
-
Labor Cost by Feed Type
Farmers can make better feed purchasing and usage decisions.
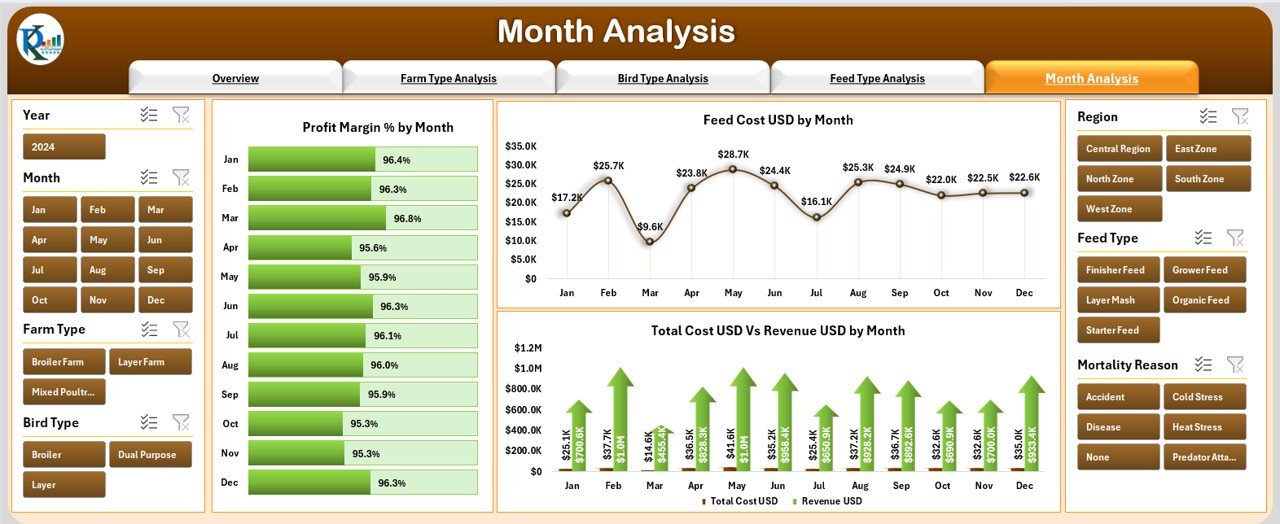
📅 6. Month Analysis Page
Monthly variations matter a lot in poultry production.
This page tracks:
-
Profit Margin % by Month
-
Total Cost vs Revenue by Month
-
Feed Cost USD by Month
These insights help farmers plan stocking, harvesting, and feeding schedules effectively.
📦 What’s Inside the Poultry Farming Dashboard in Excel
This dashboard includes well-structured sheets that make data management easy and accurate.
🗂️ Support Sheet
Contains lookup tables, dropdown lists, and master data. This ensures clean, consistent, error-free reporting.
📑 Data Sheet
Stores raw data related to feed type, bird type, farm type, medicine cost, revenue, treatment details, and month-wise performance.
The dashboard uses formulas and pivot tables to convert this data into interactive visuals.
🛠️ How to Use the Poultry Farming Dashboard in Excel
Using this dashboard doesn’t require technical expertise.
1️⃣ Update the Data Sheet
Enter the latest production, cost, and revenue numbers.
2️⃣ Refresh Pivot Tables
The visuals update automatically through Excel.
3️⃣ Apply Slicers
Filter data by bird type, feed type, region, month, or farm type.
4️⃣ Review KPI Cards
Get instant insights into cost, revenue, mortality, and profit.
5️⃣ Analyze Charts
Study cost vs revenue, mortality trends, profit margins, and treatment percentages.
6️⃣ Make Decisions Faster
Use insights to adjust feed plans, treatment schedules, farm operations, and stocking strategies.
👥 Who Can Benefit from This Poultry Farming Dashboard in Excel
This dashboard is perfect for anyone involved in poultry operations:
🐔 Poultry Farm Owners
Understand profitability and track all units easily.
👨🌾 Farm Managers
Monitor daily performance, feed usage, and treatment.
📊 Agribusiness Analysts
Analyze cost trends, revenue patterns, and monthly variations.
🏢 Agriculture Companies
Standardize reporting across multiple farms and regions.
💼 Financial & Planning Teams
Use cost vs revenue insights for long-term planning.
With this dashboard, farms can reduce costs, improve bird health, increase revenue, and maintain strong profit margins throughout the year.
### Click here to read the Detailed blog post
Visit our YouTube channel to learn step-by-step video tutorials
👉 Youtube.com/@PKAnExcelExpert


Reviews
There are no reviews yet.