

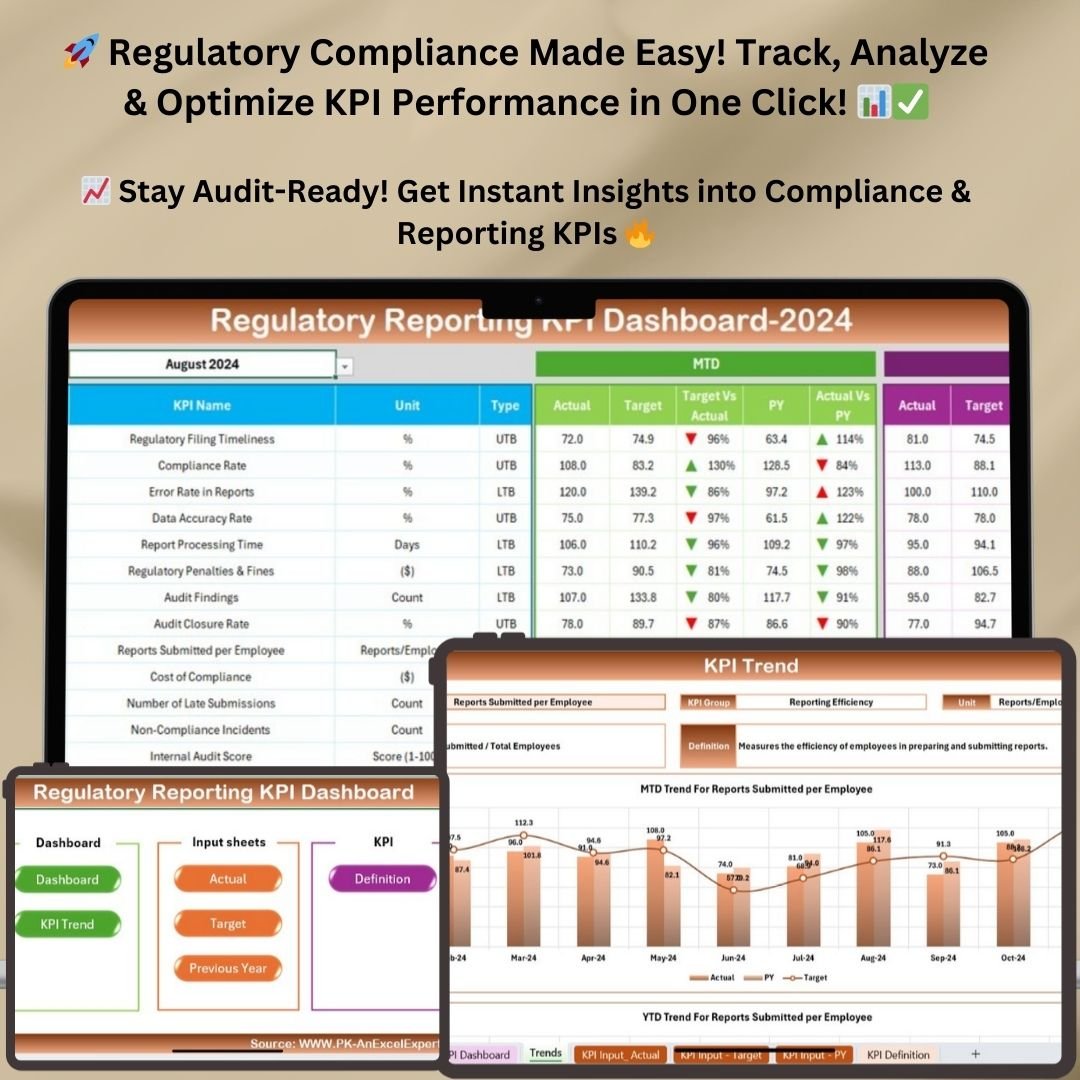



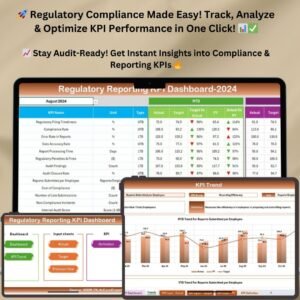
The Regulatory Reporting KPI Dashboard in Excel is a ready-made template for tracking compliance, financial risk, audit performance and operational efficiency in one workbook. It is built for finance professionals, compliance teams and risk managers who want accurate data, clearer reporting and an easier way to meet regulatory requirements. Enter your monthly actuals and targets, and the dashboard shows MTD and YTD performance, variances and trends.
Regulatory reporting is often complex and slow. This regulatory KPI dashboard replaces scattered spreadsheets with seven structured sheets, pre-built formulas and color-coded indicators. Compliance tracking becomes part of your normal monthly routine.
Key Features of the Regulatory Reporting KPI Dashboard
- Seven dedicated sheets with simple navigation, easy data entry and clear reporting.
- MTD and YTD tracking of actuals, targets and previous year comparisons.
- Variance analysis with color-coded arrows: green for improvement, red for decline.
- Month drop-down selector on the Dashboard sheet to filter results by month.
- KPI drop-down selector on the KPI Trend sheet to view any metric’s trend.
- MTD and YTD trend charts to spot patterns and changes in KPI performance.
- Auto-updating formulas that calculate MTD and YTD figures from your inputs.
- Conditional formatting for a quick visual read of KPI performance.
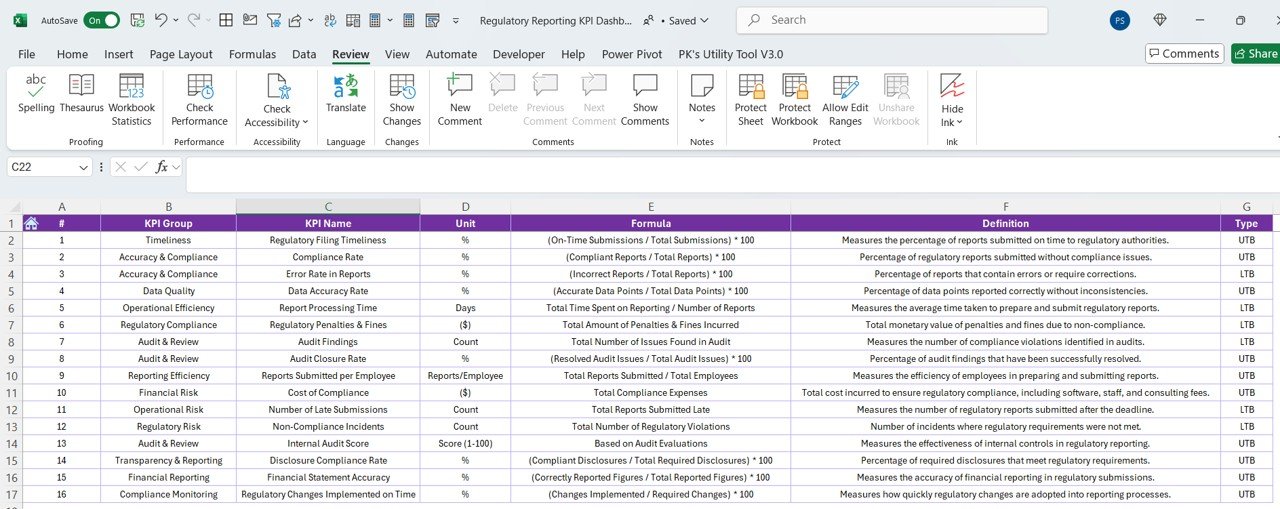
- Built-in KPI glossary listing each KPI’s group, unit, formula and definition.
- Fully customizable: change KPIs, targets, formulas and reporting structure to suit your organization.
What’s Inside: Sheet-by-Sheet Breakdown
1. Home Sheet: Centralized Navigation
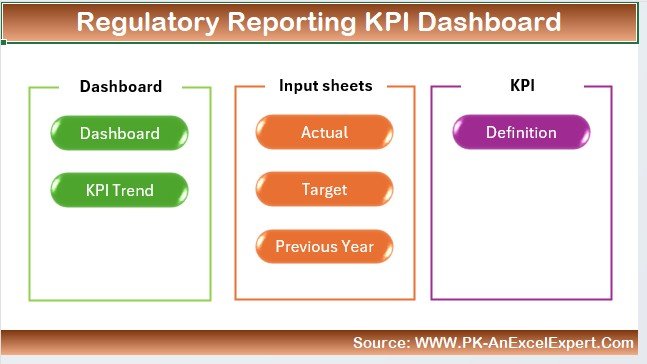
- Acts as the dashboard’s control center, so you can move between sections quickly.
- Clickable buttons open key sheets such as the Dashboard, KPI Trend and Data Entry sections.
2. Dashboard Sheet: Your Performance Snapshot
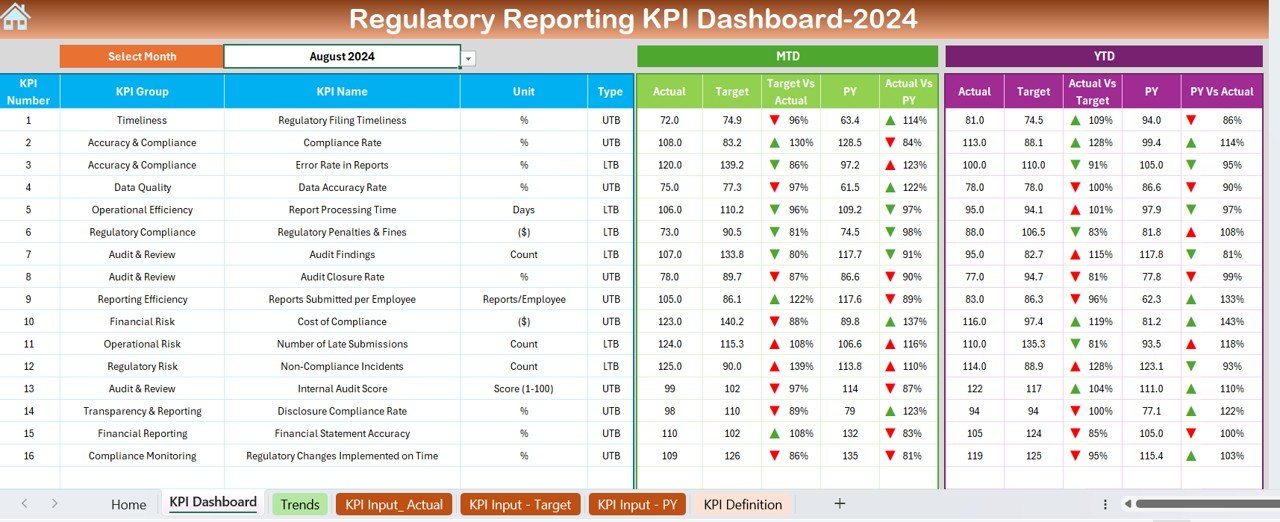
- Gives a full overview of all regulatory compliance KPIs.
- A drop-down selector filters the data by month.
- Shows MTD (Month-to-Date) and YTD (Year-to-Date) actuals, targets and previous year comparisons.
- Variance analysis highlights performance gaps with color-coded arrows.
- Helps compliance teams track key regulatory metrics, penalties, audits and financial reporting accuracy.
3. KPI Trend Sheet: In-Depth KPI Analysis
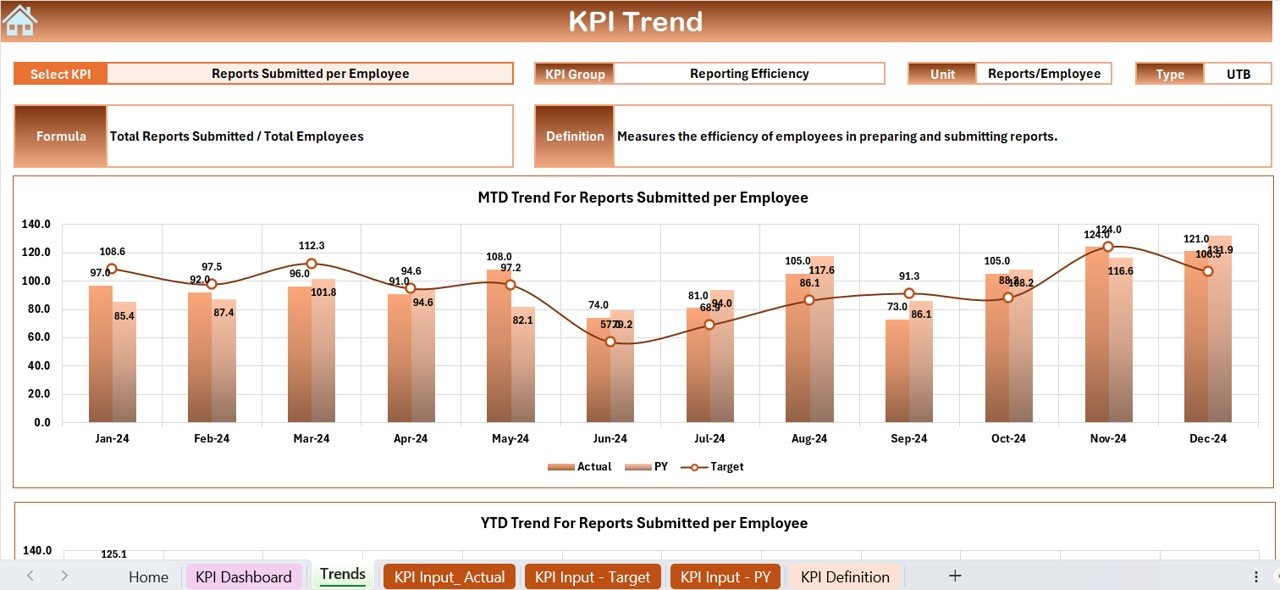
- Tracks individual KPIs in detail over time.
- A drop-down selector lets you choose a KPI and view its trend.
- MTD and YTD trend charts show how each KPI is moving and reveal patterns.
- Displays the KPI formula and definition, so every team reads the metric the same way.
4. Actual Numbers Input Sheet: Data Entry for KPI Tracking
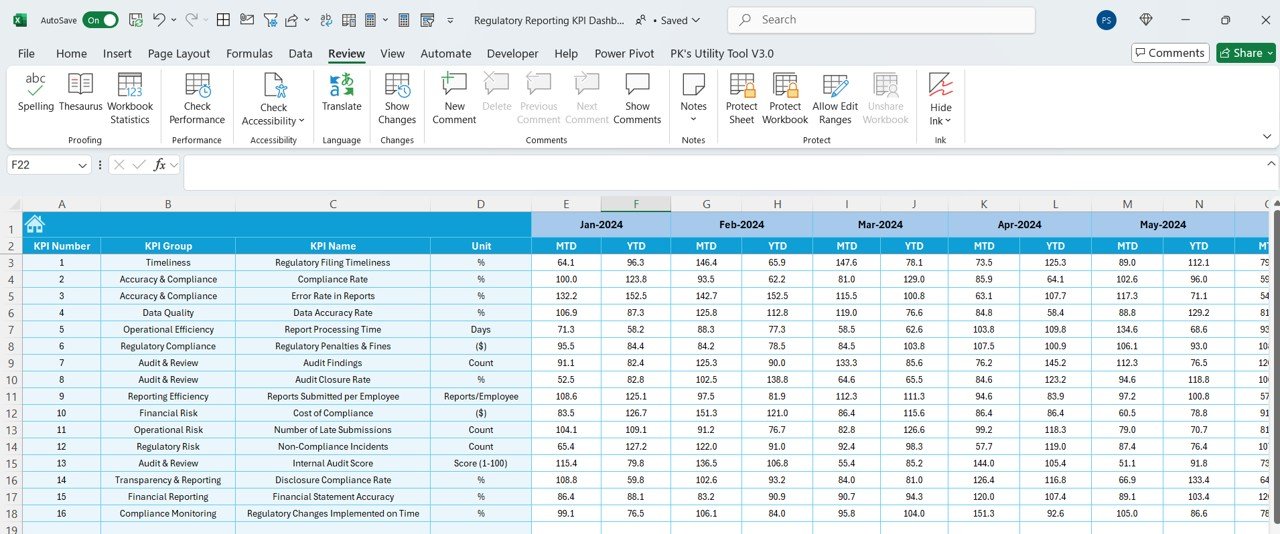
- User-friendly input fields for entering actual KPI values for each month.
- Auto-updating formulas calculate MTD and YTD figures.
- Supports accurate reporting for decision-making.
5. Target Sheet: Define Your Compliance Goals
- Set target values for each KPI.
- Compare actual performance against your predefined goals.
- Lets regulatory compliance teams check whether performance is meeting expectations.
6. Previous Year Data Sheet: Comparative Analysis
- Stores the previous year’s KPI data for side-by-side comparison.
- Shows year-over-year progress and helps detect regulatory risks before they escalate.
- Keeps KPI evaluation consistent, which improves reporting accuracy.
7. KPI Definition Sheet: Comprehensive KPI Glossary
- Lists every KPI with its group, unit, formula and detailed definition.
- Keeps reporting metrics standardized and reduces confusion.
- Serves as a reference guide so KPI data is interpreted the same way across departments.
Benefits of Using This KPI Dashboard
- Better compliance monitoring: Track regulatory penalties, audit findings and financial reporting accuracy.
- Less time on data entry: Automated calculations and structured input sheets simplify reporting.
- Clear visuals and trend analysis: Charts, variance indicators and conditional formatting show KPI performance at a glance.
- Data-driven decisions: Compare actual performance with targets and previous year values to find areas to improve.
- Customizable and scalable: Adjust KPIs, targets and reporting parameters to fit your organization.
Who Is This Template For?
This Regulatory Reporting KPI Dashboard in Excel suits:
- Regulatory compliance teams: Monitor adherence to compliance and reporting standards.
- Finance professionals: Track financial reporting accuracy, cost of compliance and audit performance.
- Risk managers: Identify and reduce regulatory risks using current data.
- Operations teams: Improve efficiency by tracking report processing time and audit closure rates.
- Internal audit and governance teams: Evaluate findings and keep improving compliance efforts.
How to Use the Dashboard
- Input data: Enter actual KPI values in the Actual Numbers Input Sheet.
- Set targets: Define your compliance goals in the Target Sheet.
- Monitor performance: Open the Dashboard Sheet and choose a month to see KPI tracking.
- Analyze trends: Use the KPI Trend Sheet for a detailed breakdown of each KPI’s progress.
- Compare year-over-year: Use the Previous Year Data Sheet for benchmarking.
- Standardize definitions: Check the KPI Definition Sheet for metric explanations.
Why Choose This Dashboard?
- Expert-designed: Built around best practices for regulatory reporting.
- Fully editable: Customize KPIs, formulas and reporting structure.
- Time-saving automation: Pre-built formulas and conditional formatting handle performance tracking for you.
Click here to read the detailed blog post.
Visit our YouTube channel for step-by-step video tutorials: Youtube.com/@PKAnExcelExpert
Frequently Asked Questions
What does the Regulatory Reporting KPI Dashboard in Excel track?
It tracks regulatory compliance KPIs, including penalties, audit findings, financial reporting accuracy, cost of compliance, report processing time and audit closure rates. Each KPI is shown with MTD and YTD actuals, targets and previous year values.
How many sheets are included?
Seven: Home, Dashboard, KPI Trend, Actual Numbers Input, Target, Previous Year Data and KPI Definition.
How does the variance analysis work?
The dashboard compares actuals with targets and previous year figures. Color-coded arrows mark the result: green for improvement and red for decline.
Can I change the KPIs and targets?
Yes. The template is fully customizable. You can edit KPIs, targets, formulas and the reporting structure.
Do I need to calculate MTD and YTD figures myself?
No. Enter monthly actual values in the input sheet, and the auto-updating formulas calculate the MTD and YTD figures.
Is this regulatory KPI dashboard suitable for audit teams?
Yes. Internal audit and governance teams can use it to evaluate findings, monitor audit performance and support ongoing compliance tracking.
Last updated: October 2026
Compatibility and Requirements
- Works in Microsoft Excel desktop (Excel 2016 or later, or Microsoft 365).
- You choose the month from a drop-down on the Dashboard sheet and the KPI from a drop-down on the KPI Trend sheet. Microsoft explains charts in Create a chart from start to finish.
Related Regulatory Reporting Templates
- Regulatory Reporting KPI Dashboard in Google Sheets: the same dashboard for Google Sheets
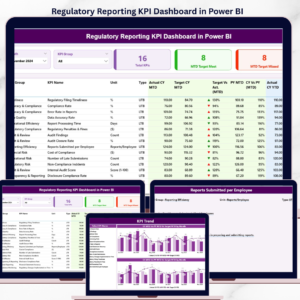
- Regulatory Reporting KPI Dashboard in Power BI: the Power BI edition
- Regulatory Reporting Audit Checklist in Excel: a checklist for audit steps
- Regulatory Reporting Checklist in Excel: a checklist for the reporting process
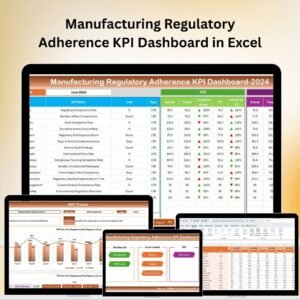
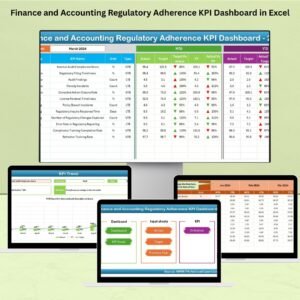
- Finance and Accounting Regulatory Adherence KPI Dashboard in Excel: a regulatory adherence view for finance teams
Browse all Excel KPI dashboards.
















Reviews
There are no reviews yet.