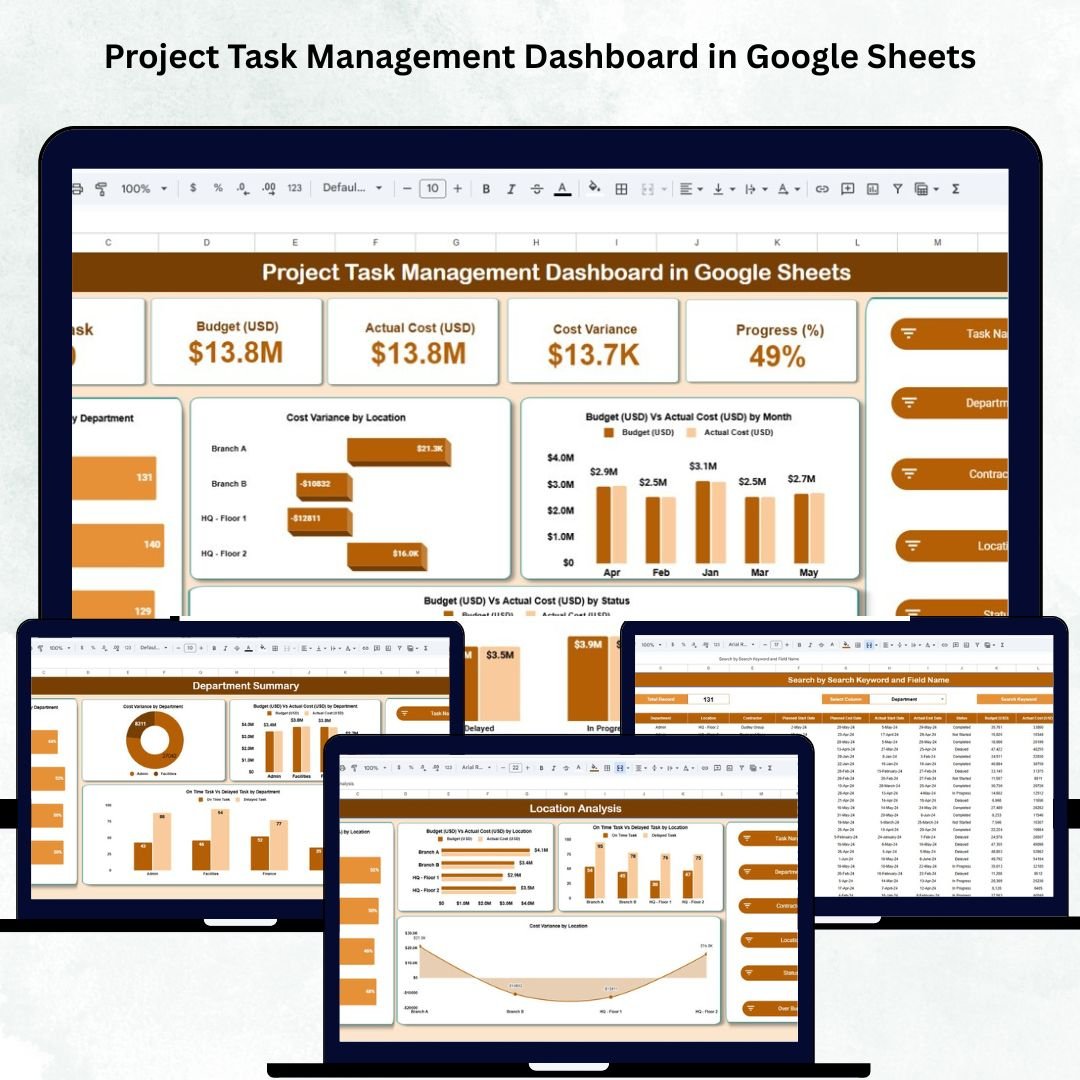
Managing multiple projects across departments, teams, and contractors can be overwhelming — especially when you need to track budgets, deadlines, and progress simultaneously. The Project Task Management Dashboard in Google Sheets is your all-in-one visual solution to monitor performance, cost, and delivery efficiency — all from one centralized workspace. 🗂️📊
Built entirely in Google Sheets, this ready-to-use dashboard brings together automation, data visualization, and collaboration. It provides instant insights into project health, budget utilization, and completion progress — without the need for any complex project management tools.
Whether you’re a project manager, operations lead, or department head, this dashboard helps you make data-driven decisions that keep projects on time and within budget.
🔑 Key Features of the Project Task Management Dashboard in Google Sheets
📋 Overview Sheet Tab (Main Dashboard)
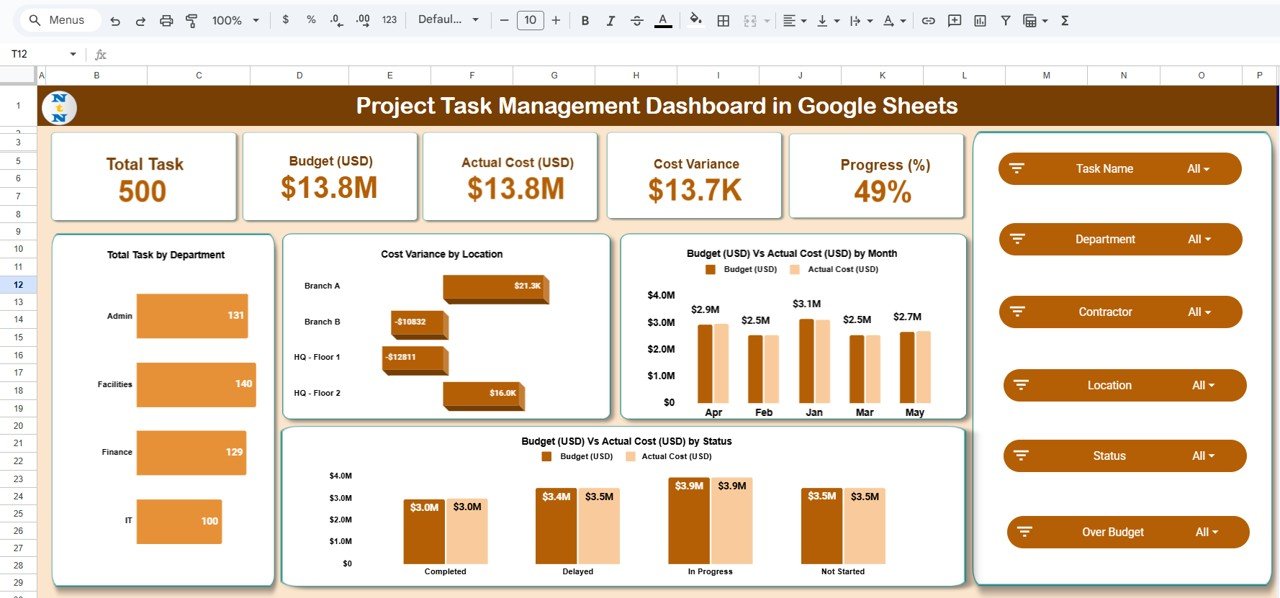
The Overview Sheet provides a clear summary of your project’s health and budget performance.
Cards Displayed:
-
📊 Total Task: Number of tasks tracked across all active projects.
-
💰 Budget (USD): Total planned project expenditure.
-
💵 Actual Cost (USD): Total spent so far.
-
⚖️ Cost Variance: Difference between budgeted and actual spending.
-
⏱️ Progress (%): Average task completion percentage.
Charts Included:
-
Total Task by Department – Shows how work is distributed across departments.
-
Cost Variance by Location – Highlights sites or branches exceeding or staying within budget.
-
Budget vs Actual Cost by Month – Monitors monthly budget utilization.
-
Budget vs Actual Cost by Status – Tracks cost patterns for tasks (Not Started, In Progress, Completed).
This dashboard provides a bird’s-eye view of overall project performance in one place.
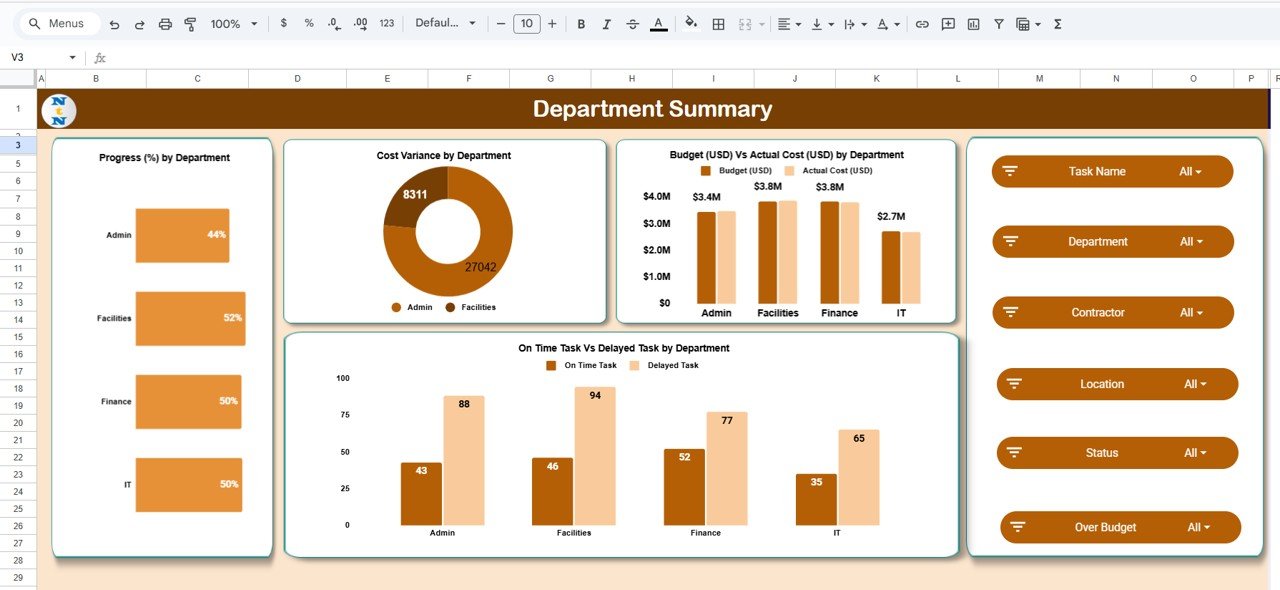
🏢 Department Summary Sheet Tab
Gain a department-level understanding of task progress, timeliness, and spending.
Charts Included:
-
Progress (%) by Department – Evaluates task completion efficiency.
-
Cost Variance by Department – Identifies departments that overspend or save costs.
-
On-Time vs Delayed Tasks by Department – Monitors timeliness of deliveries.
This analysis helps managers spot top-performing departments and areas needing attention.
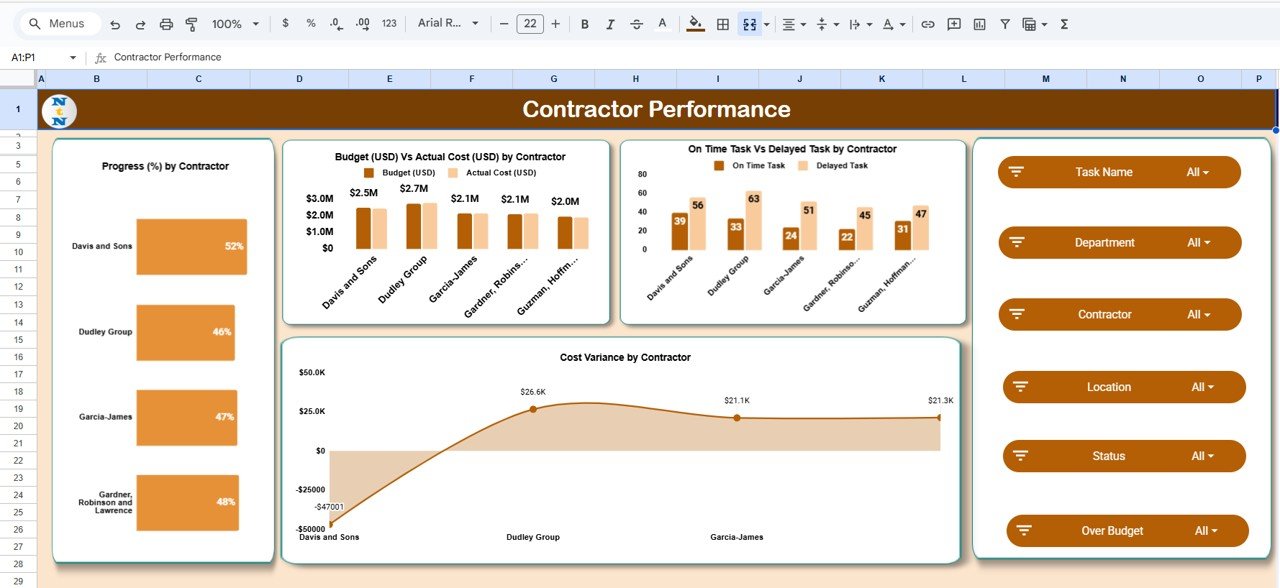
🔧 Contractor Performance Sheet Tab
Track how well your vendors and contractors perform on assigned projects.
Charts Included:
-
Progress (%) by Contractor – Measures completion percentage across vendors.
-
Budget vs Actual Cost by Contractor – Assesses financial accuracy and cost control.
-
On-Time vs Delayed Tasks by Contractor – Highlights punctual and delayed vendors.
-
Cost Variance by Contractor – Detects who stays within budget and who overspends.
Perfect for procurement and project operations teams to assess performance and accountability.
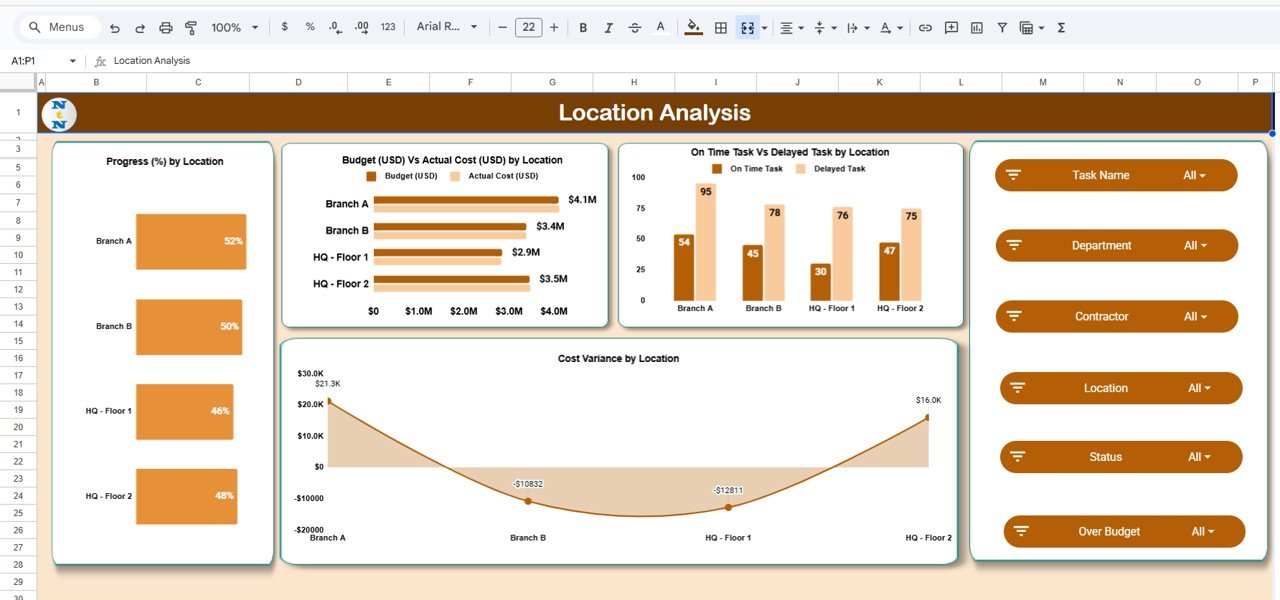
📍 Location Analysis Sheet Tab
Analyze performance geographically to improve on-site project monitoring.
Charts Included:
-
Progress (%) by Location
-
Budget vs Actual Cost by Location
-
On-Time vs Delayed Tasks by Location
-
Cost Variance by Location
Ideal for multi-site organizations managing multiple regions or project offices.
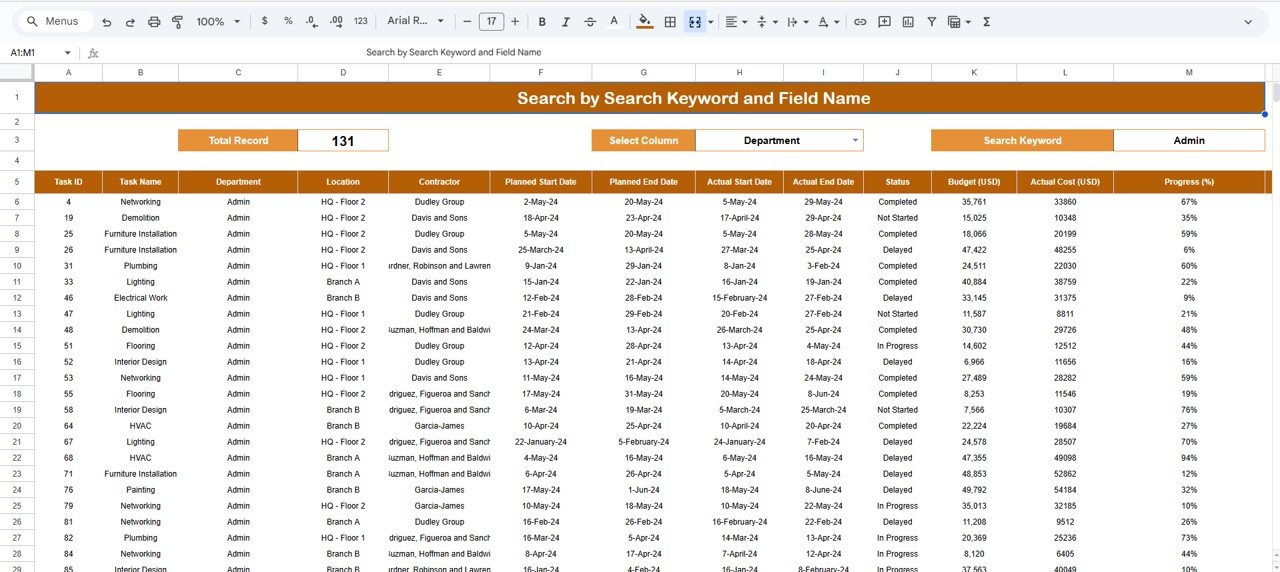
🔍 Search Sheet Tab (Smart Lookup)
Quickly find specific records using keywords or fields.
Examples:
-
“High Budget” → Displays large-budget tasks.
-
“Contractor: Davis & Sons” → Filters all tasks by contractor.
-
“Department: IT” → Shows IT-related tasks.
The Search Tab makes navigation fast and effortless.
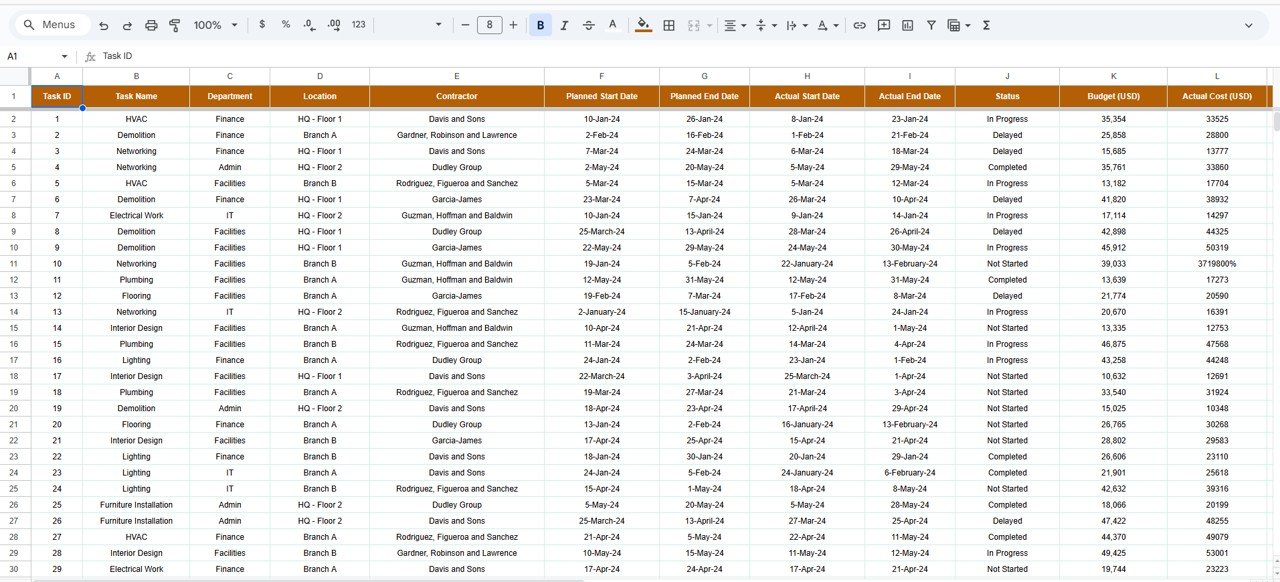
🧾 Data Sheet Tab
The central database powering the dashboard. All charts, KPIs, and visuals automatically update when data is modified here.
📦 What’s Inside the Dashboard
✅ Pre-built Google Sheets template
✅ Overview, Department, Contractor, and Location analysis tabs
✅ Smart Search function
✅ Dynamic charts and color-coded visuals
✅ Automatic cost variance calculations
✅ Editable structure — add columns or KPIs easily
✅ Cloud-ready for collaboration
🧑💼 Who Can Benefit from This Dashboard
🧱 Project Managers – Track deadlines, costs, and progress effortlessly.
🏗️ Contractors – Manage client projects and budgets visually.
🏢 Department Heads – Get insights into team workloads and progress.
📈 Executives – Monitor overall project performance for decision-making.
💼 Consultants & PMOs – Use as a quick performance dashboard for multiple clients.
Whether you manage construction, IT, or marketing projects, this tool helps ensure transparency, accountability, and efficiency.
🧪 How to Use the Dashboard
1️⃣ Enter Project Data: Add tasks, budgets, and progress values in the Data Sheet.
2️⃣ Monitor KPIs: Instantly view metrics on the Overview tab.
3️⃣ Analyze Departments: Use department and contractor tabs for deeper insights.
4️⃣ Filter Results: Search specific projects using the Smart Lookup sheet.
5️⃣ Review Trends: Regularly analyze monthly charts for improvement.
💡 Pro Tip: Integrate Google Forms to automatically feed task updates into the dashboard for real-time reporting!
🌟 Why Choose This Dashboard
-
Real-time project tracking
-
Visual cost variance and performance reports
-
Fully customizable and automation-ready
-
Cloud collaboration for teams
-
No complex software — just simple, smart Google Sheets
The Project Task Management Dashboard in Google Sheets helps you stay on schedule, control costs, and make confident project decisions — all with ease. 🚀
🔗 Click here to read the Detailed blog post
Watch the step-by-step video Demo:


Reviews
There are no reviews yet.