



Building a strong alumni network is vital for every educational institution 🎓. Whether it’s about fundraising, mentorship, or event participation, your alumni community forms the foundation of long-term success. The Alumni Engagement KPI Dashboard in Google Sheets is the ultimate ready-to-use analytics tool that helps you track, measure, and improve alumni relationships — all in one place.
This easy-to-use, cloud-based dashboard turns scattered alumni data into actionable insights that empower schools, colleges, and universities to make smarter engagement decisions. With automated charts, dynamic KPIs, and instant updates, it’s your all-in-one solution to boost alumni participation, donations, and loyalty — without the need for any coding or complex setup.
✨ Key Features of the Alumni Engagement KPI Dashboard in Google Sheets
📊 Dynamic Dashboard Sheet:
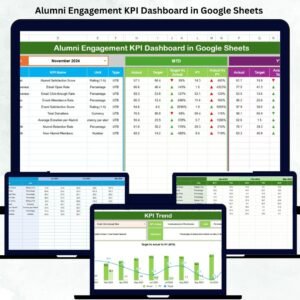
Select any month from the dropdown and instantly see updated KPI metrics — including MTD (Month-to-Date) and YTD (Year-to-Date) comparisons with targets and previous year data.
📈 Interactive Trend Analysis:
The Trend Sheet visualizes performance across months using charts and graphs, helping you spot growth, stagnation, or decline effortlessly.
💡 Automated Data Updates:
Just input your actuals and targets — the dashboard calculates and updates all results automatically, ensuring accuracy and efficiency.
🎯 Comprehensive KPI Definitions:
Every KPI comes with detailed definitions, formulas, and units, ensuring complete transparency and easy understanding.
🌐 Cloud-Based Collaboration:
Since it’s built in Google Sheets, multiple team members can access and update the dashboard simultaneously — from anywhere, anytime.
📅 Historical & Target Benchmarking:
Compare your current year’s data with previous years and set ambitious yet achievable targets to drive performance improvement.
🧩 Customizable Design:
Add, edit, or remove KPIs, adjust visuals, or apply your institution’s brand colors — total flexibility to match your unique needs.

📦 What’s Inside the Alumni Engagement KPI Dashboard
The dashboard includes 7 structured worksheet tabs — each with a clear purpose:
1️⃣ Dashboard Sheet Tab: Main control center with all KPI visuals, targets, and conditional indicators (up/down arrows).
2️⃣ Trend Sheet Tab: Choose a KPI and view its performance trend via dynamic charts.
3️⃣ Actual Numbers Input Sheet: Enter monthly and yearly actual data effortlessly.
4️⃣ Target Sheet: Define target values and track performance gaps instantly.
5️⃣ Previous Year Numbers Sheet: Benchmark against past data to analyze year-over-year growth.
6️⃣ KPI Definition Sheet: Document KPI details, units, formulas, and definitions.
7️⃣ Support Sheet: The backend logic that ensures automation and data integrity.
Together, these sheets give you a 360° view of your alumni engagement landscape — from donations and participation to communication effectiveness.
🧭 How to Use the Alumni Engagement KPI Dashboard
Using this dashboard is as simple as 1-2-3! ✅
1️⃣ Enter Data: Update your actual and target values for each KPI every month.
2️⃣ Select Month: Use the dropdown selector on the dashboard to focus on any desired month.
3️⃣ Analyze Insights: Instantly view where you’ve improved, where performance dropped, and where to take action.
No technical expertise is needed — just plug in your data and watch the visuals come alive.
👥 Who Can Benefit from This Dashboard
🎓 Universities & Colleges:
Track alumni donations, events, and mentorship programs.
🏫 Schools & Foundations:
Strengthen alumni connections to enhance brand visibility and fundraising outcomes.
🧑💼 Alumni Relations Teams:
Simplify data collection, reporting, and performance tracking.
📊 Administrators & Fundraising Managers:
Make informed decisions using real-time insights and visual analytics.
💻 Nonprofits & Education NGOs:
Monitor engagement impact across regions and initiatives using one unified dashboard.
🚀 Why You’ll Love It
✅ 100% editable and shareable Google Sheets file.
✅ Ready-to-use template — no complex setup.
✅ Real-time updates and cloud collaboration.
✅ Perfect for monthly and annual performance reviews.
✅ Designed to save time and deliver accuracy.
With the Alumni Engagement KPI Dashboard in Google Sheets, your institution can finally bring structure, clarity, and transparency to alumni engagement. Turn data into strategy — and relationships into results. 🌟
Click here to read the Detailed blog post
Watch the step-by-step video tutorial:
Visit our YouTube channel to learn step-by-step video tutorials YouTube.com/@PKAnExcelExpert
Compatibility and Requirements
- Works in Google Sheets. You need a free Google account and a web browser.
- The month is picked from a dropdown on the Dashboard sheet. Google explains dropdowns in Create an in-cell dropdown list.
Frequently Asked Questions
Which sheets are included?
Seven tabs: Dashboard, Trend, Actual Numbers Input, Target, Previous Year Numbers, KPI Definition and a Support sheet.
Does it show MTD and YTD figures?
Yes. Pick a month and the Dashboard shows Month-to-Date and Year-to-Date actuals against targets and previous year numbers, with up and down arrows.
Can I change the KPIs?
Yes. You can add, edit or remove KPIs and record each one’s unit, formula and definition in the KPI Definition sheet.
Can several people update it?
Yes. It is a Google Sheets file, so your alumni relations team can open and update it at the same time.
Is there an Excel version?
Yes. The Alumni Engagement KPI Dashboard in Excel covers the same job in Excel.
Related Alumni and Education Templates
- Alumni Engagement KPI Dashboard in Excel: the same KPIs in Excel
- Alumni Associations Dashboard in Excel: a full alumni association dashboard in Excel
- Alumni Associations Dashboard in Power BI: the alumni association dashboard in Power BI
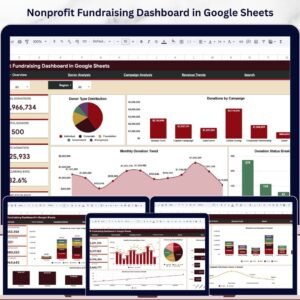
- Nonprofit Fundraising Dashboard in Google Sheets: track donations and fundraising campaigns
- Education & School Management Bundle: 8 education templates for Excel and Google Sheets
Browse all Google Sheets KPI dashboards.



Reviews
There are no reviews yet.