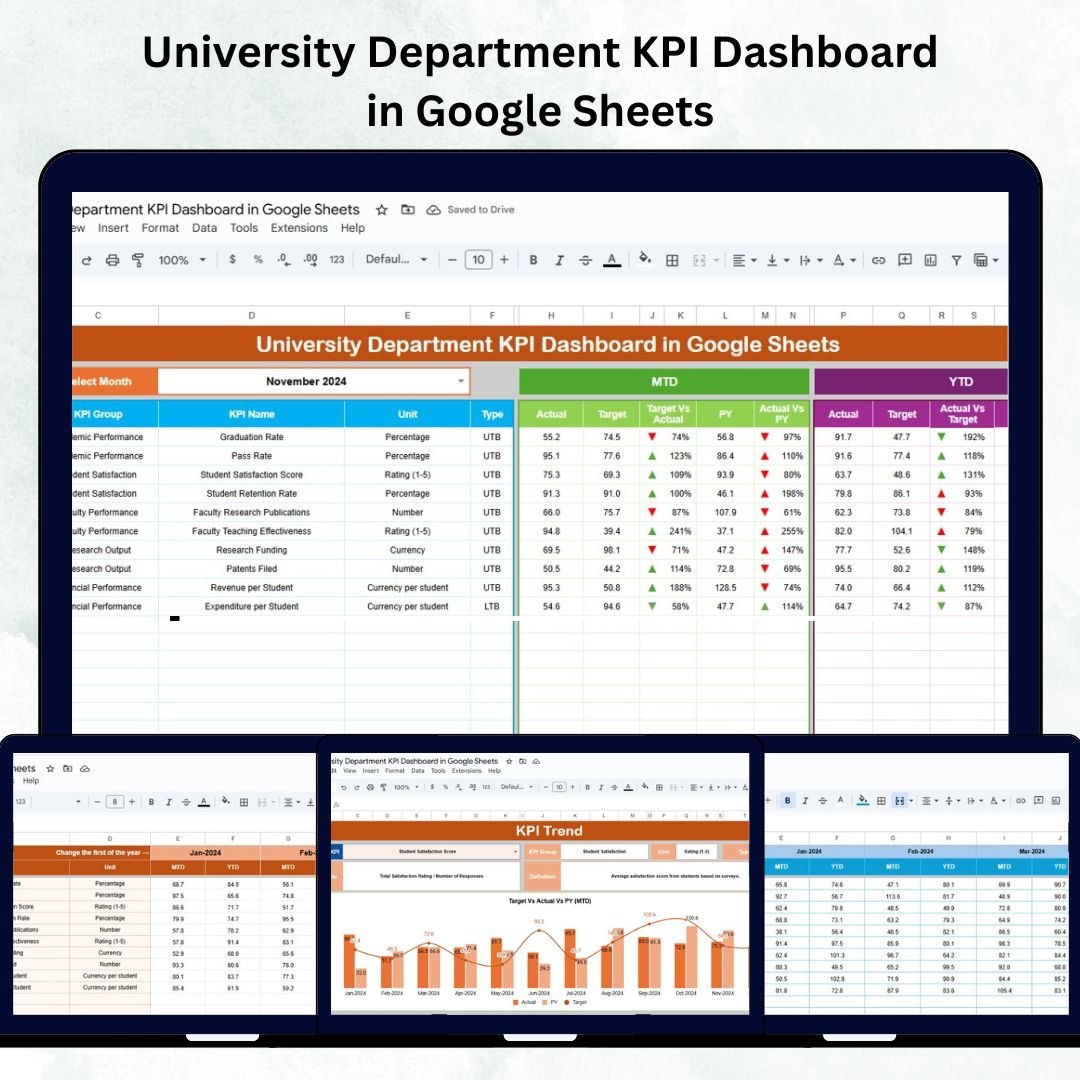
Universities today rely on data-driven insights to ensure academic excellence, operational efficiency, and strategic growth. Managing multiple departments—each with its own performance indicators—can be overwhelming without the right tools. The University Department KPI Dashboard in Google Sheets is a ready-to-use, fully interactive dashboard that centralizes departmental data, allowing academic administrators to track performance with clarity and precision.
This Google Sheets dashboard enables real-time performance analysis across academic, research, and administrative functions. With dynamic visuals, MTD/YTD tracking, and conditional formatting, it transforms raw departmental data into actionable insights—helping deans, department heads, and institutional leaders make informed decisions.
🔑 Key Features of the University Department KPI Dashboard
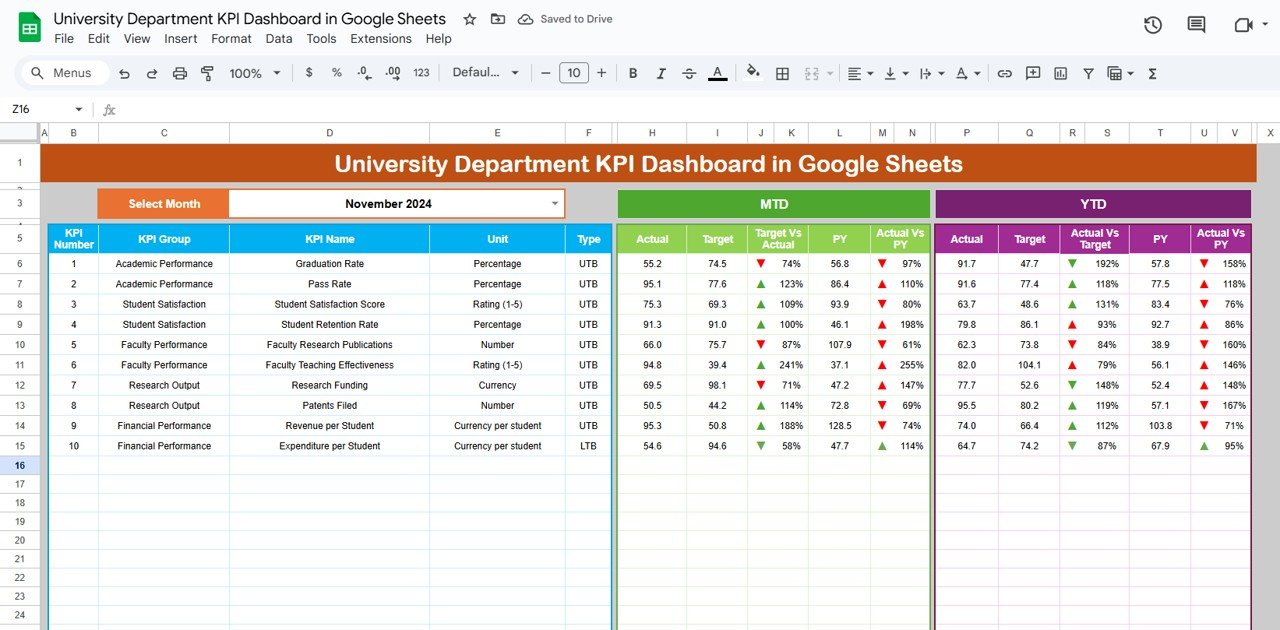
🎯 1. Dashboard Sheet Tab – Departmental Overview
The Dashboard Sheet is the main hub of the template, consolidating all key performance indicators (KPIs) into a single interactive view.
Key Highlights:
-
📆 Month Selector (Cell D3): Choose any month to dynamically refresh all metrics.
-
📈 MTD and YTD Sections: Compare Month-to-Date (Actual, Target, and Previous Year) and Year-to-Date values for each KPI.
-
🔺 Conditional Formatting: Green (▲) for improvement and Red (▼) for decline, providing instant visual insights.
-
🧮 Automatic KPI Calculations:
-
Target vs Actual (%) = Actual ÷ Target
-
PY vs Actual (%) = Current Year ÷ Previous Year
-
This section offers a 360° view of departmental performance, ideal for performance reviews and academic reporting.
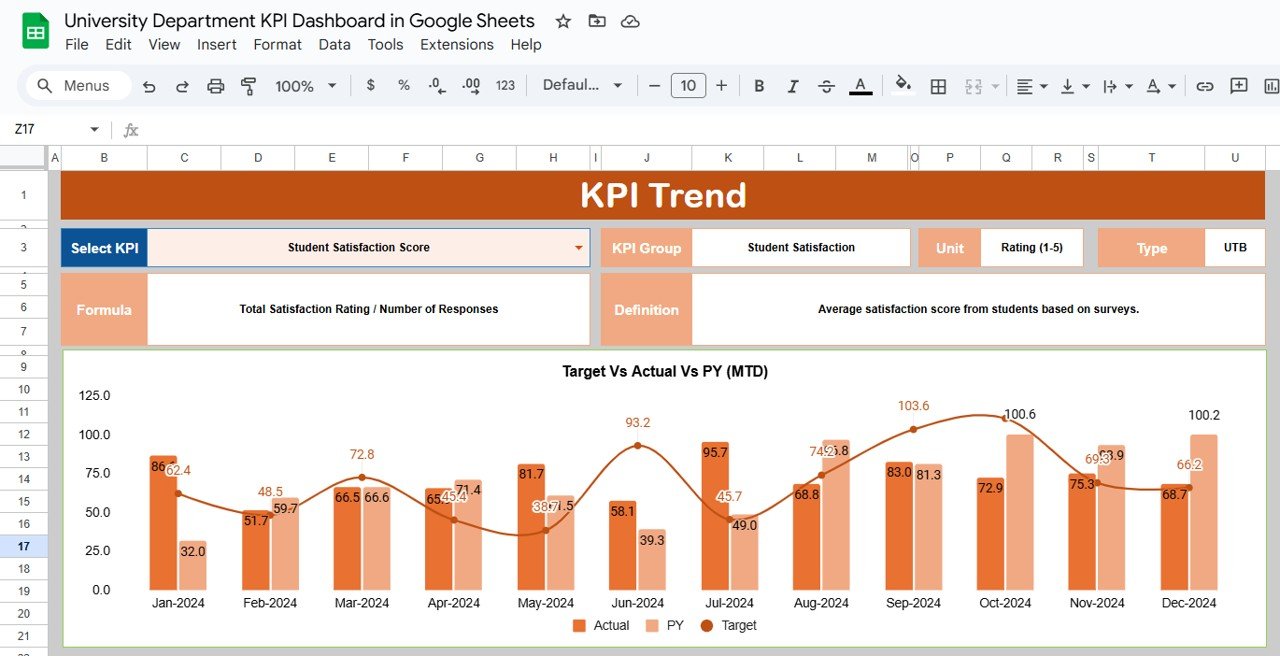
📊 2. KPI Trend Sheet Tab – Performance Over Time
The KPI Trend Sheet helps track and analyze how each KPI evolves over time.
Features Include:
-
🔽 KPI Selector (Cell C3): Choose any KPI from the dropdown menu for trend visualization.
-
📘 Information Displayed:
-
KPI Group (Academic, Research, Administrative, etc.)
-
Unit (%, Count, Ratio, Hours, etc.)
-
KPI Type (UTB or LTB)
-
Formula and Definition
-
This section allows users to monitor long-term academic performance trends such as faculty research output, student retention rates, or satisfaction scores.
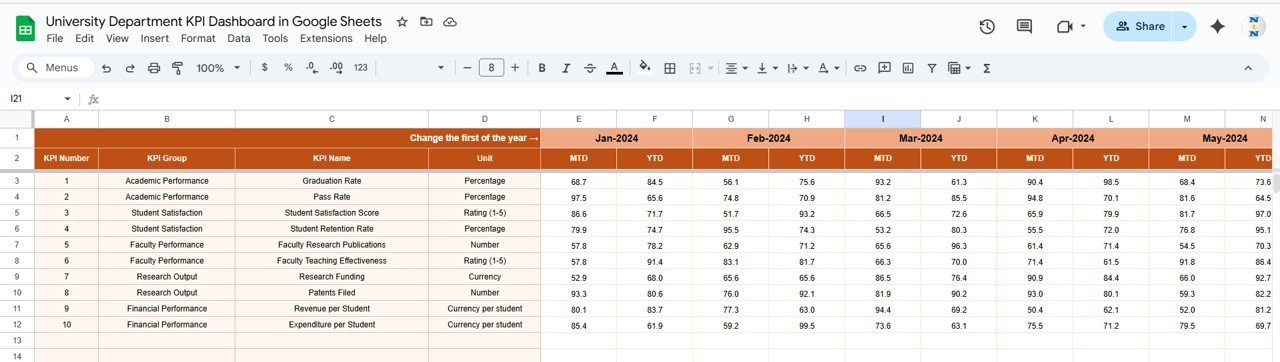
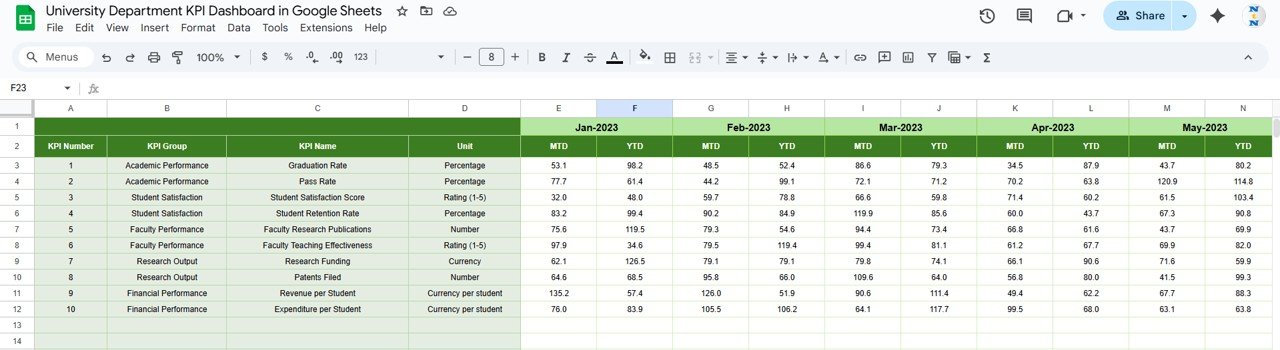
📅 3. Actual Number Sheet Tab – Real Data Entry
The Actual Number Sheet captures real-world performance metrics for each department.
How to Use:
-
Enter monthly MTD and YTD data for each KPI.
-
Adjust the starting month (Cell E1) to automatically shift reporting periods.
This ensures that the dashboard always reflects the latest, most accurate data.
🎯 4. Target Sheet Tab – Departmental Goals
This sheet serves as the goal-setting hub.
Instructions:
-
Input monthly and yearly Target values for each KPI.
-
Align them with your university’s strategic objectives or accreditation benchmarks.
Tracking actuals vs. targets helps ensure departments stay aligned with institutional goals.
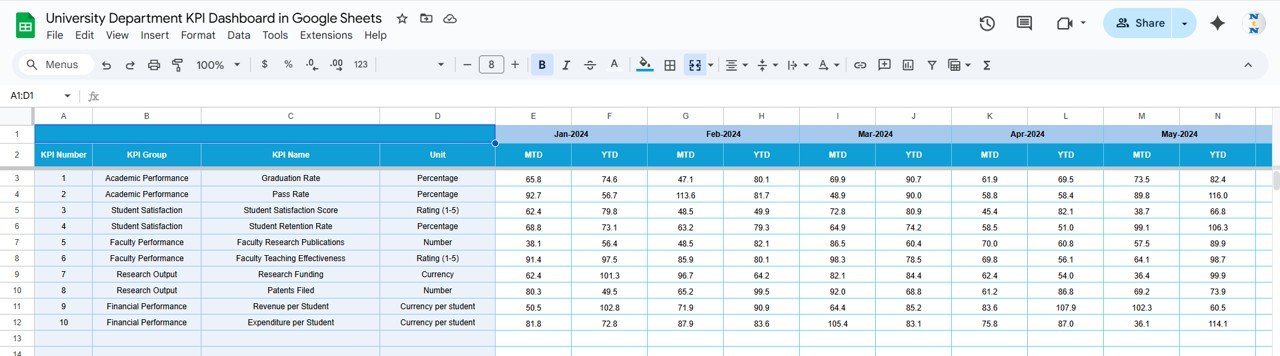
📚 5. Previous Year Number Sheet Tab – Historical Benchmarking
Use this tab to enter previous year’s MTD and YTD figures.
Benefits:
-
Enables year-over-year comparisons to evaluate growth or decline.
-
Identifies performance improvements or emerging challenges.
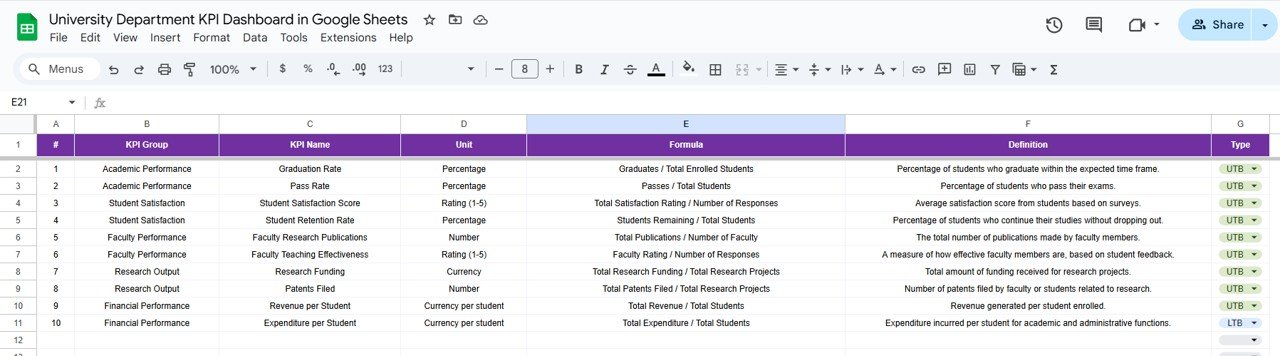
🧩 6. KPI Definition Sheet Tab – Institutional Consistency
This tab ensures all departments track KPIs using the same standards.
Columns Include:
-
KPI Name
-
KPI Group
-
Unit
-
Formula
-
Definition
-
Type (UTB or LTB)
This consistency promotes clarity and accuracy across departments.
🌟 Advantages of Using the University Department KPI Dashboard
-
🧭 Comprehensive Departmental View: Combine academic, research, and operational KPIs in one place.
-
⏱️ Real-Time Monitoring: Automatic updates ensure live tracking of performance.
-
📈 Data Comparisons: Measure progress using MTD, YTD, and YOY metrics.
-
🎓 Strategic Decision Support: Provides actionable insights for institutional planning.
-
⚙️ Customizable Framework: Add, modify, or group KPIs to fit your university’s reporting structure.
-
🤝 Collaborative Accessibility: Built in Google Sheets for multi-user editing and review.
💡 Best Practices
✅ Update Data Monthly: Keep performance records current for accuracy.
✅ Align KPIs with University Strategy: Link metrics to student success, research impact, and resource management.
✅ Use Color Indicators: Quickly identify improvement or underperformance using conditional arrows.
✅ Collaborate Across Departments: Encourage departments to co-manage data for shared accountability.
✅ Review Trends Quarterly: Use the KPI Trend tab to track semester or yearly progress.
👨🏫 Who Can Benefit from This Dashboard
🎓 University Administrators: Monitor department-wide KPIs at a glance.
🏛️ Deans & Department Heads: Evaluate faculty and research performance efficiently.
📚 Academic Planners: Ensure alignment with institutional goals and accreditation standards.
💼 Finance & Operations Teams: Track departmental efficiency and cost-effectiveness.
🚀 How It Helps Your Institution
-
Builds a culture of data transparency and accountability.
-
Simplifies KPI reporting for accreditation and audits.
-
Encourages collaborative performance tracking across multiple departments.
-
Supports evidence-based decision-making for university leadership.


Reviews
There are no reviews yet.