

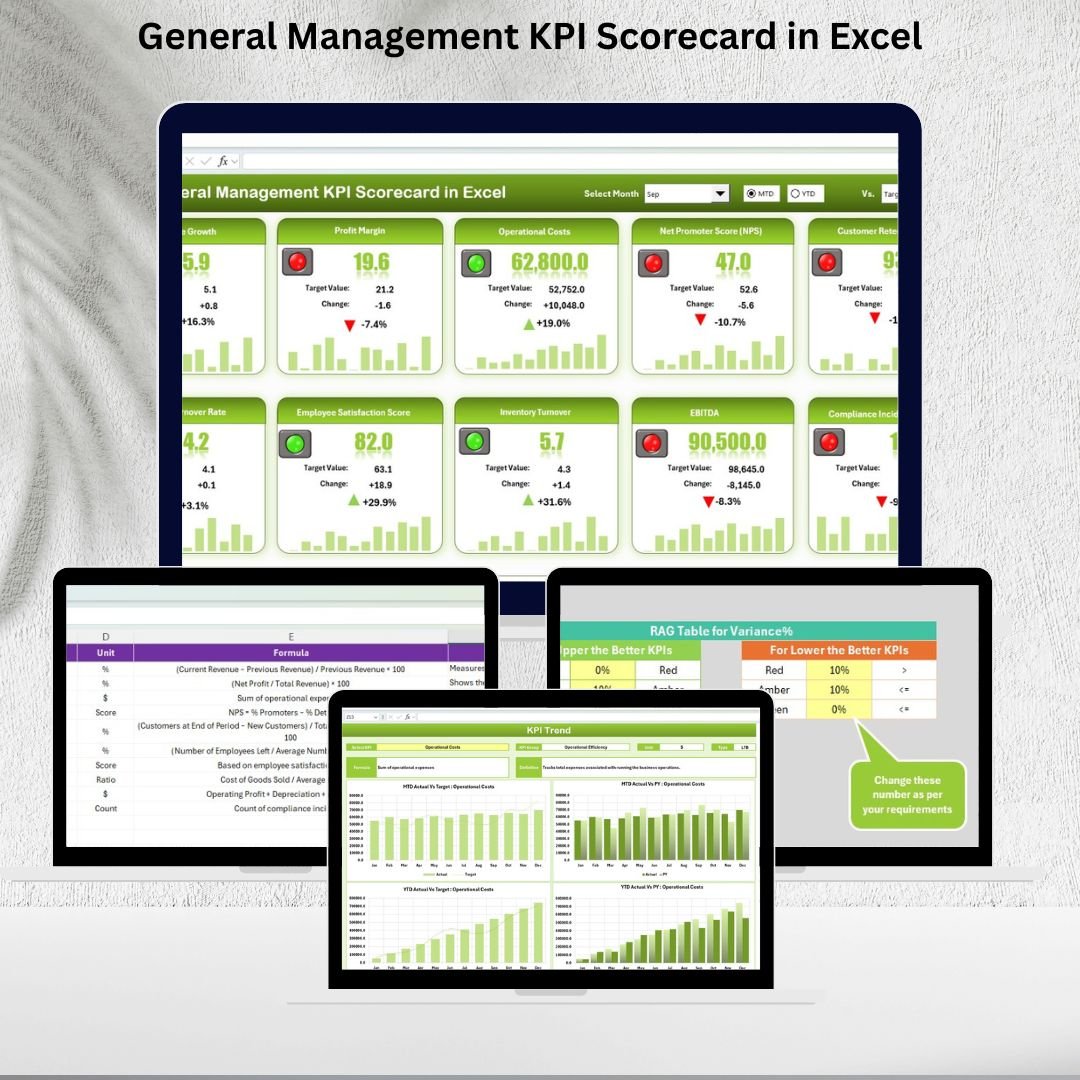

Managing business performance requires precision, visibility, and consistency. The General Management KPI Scorecard in Excel is a powerful, ready-to-use tool designed to give managers and executives a structured approach to tracking and analyzing organizational performance. 📊
This scorecard consolidates your most critical KPIs into one interactive platform, providing instant insights into both Month-to-Date (MTD) and Year-to-Date (YTD) performance. Whether you need to monitor sales, operations, or overall efficiency, this template empowers you to compare actual performance against targets and take corrective actions quickly. ✅
🔑 Key Features of General Management KPI Scorecard in Excel
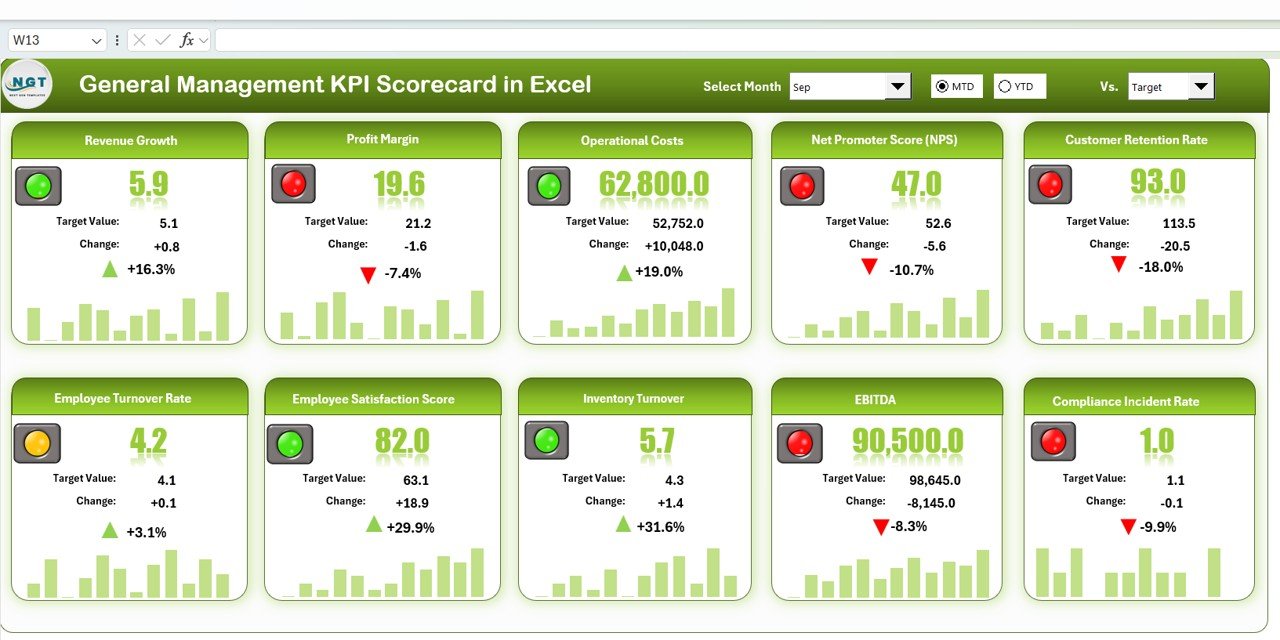
📋 Scorecard Dashboard Tab
Dropdowns to select Month, MTD, or YTD view
Compare Actual vs Target values side-by-side
Visual indicators with color-coded performance signals
Centralized overview of all KPIs for quick decision-making
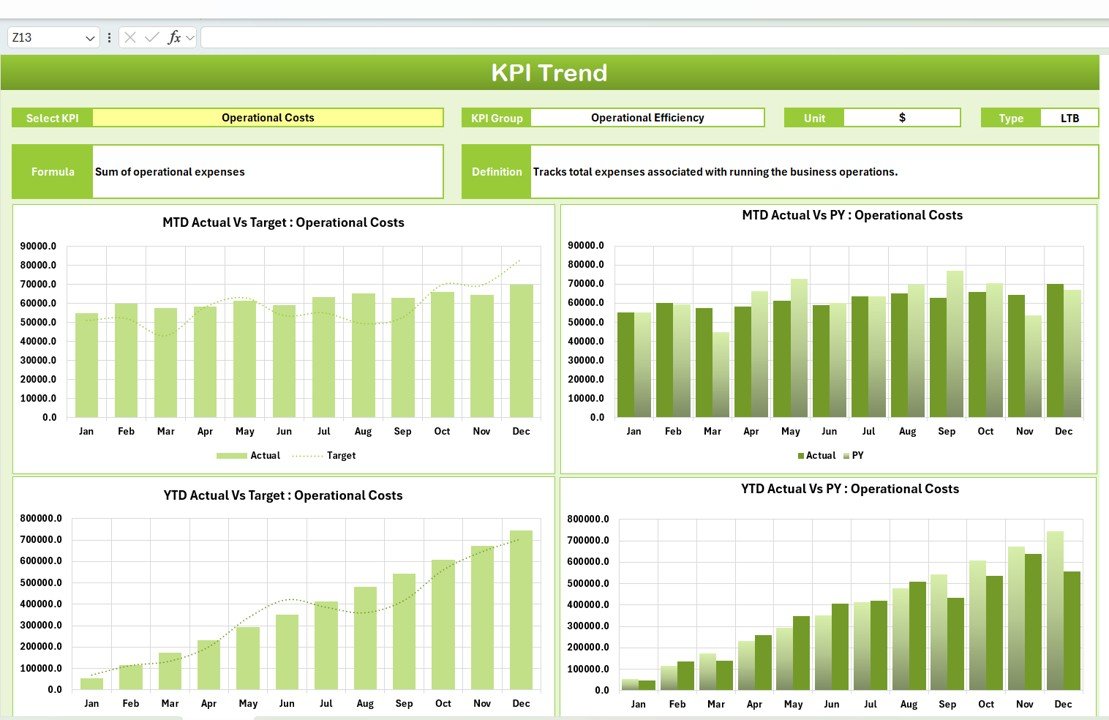
📈 KPI Trend Sheet
Select any KPI from the dropdown menu
View trends over time with clear visual charts
See KPI Group, Unit, and Type (Lower the Better / Upper the Better)
Identify long-term performance patterns and deviations
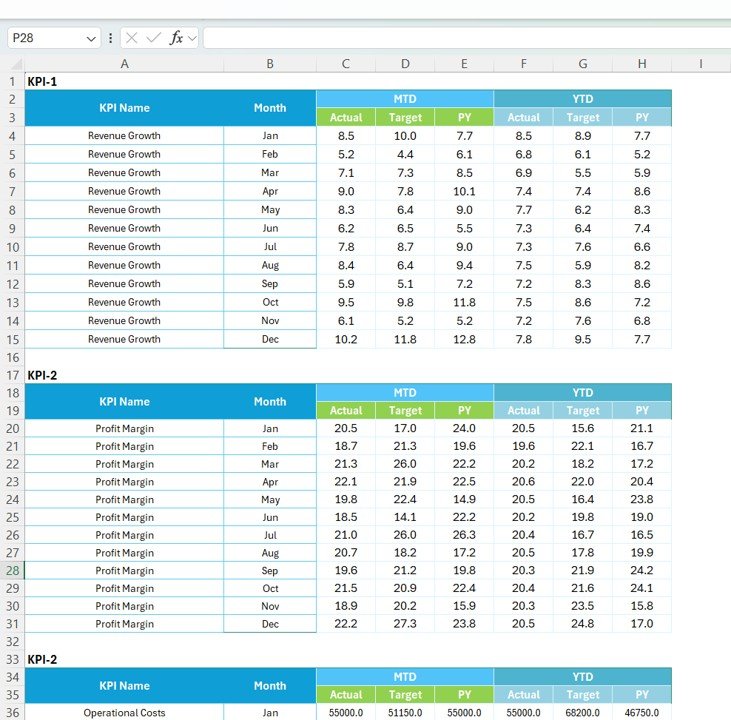
🧾 Input Data Sheet
Enter actual and target data quickly
Flexible and easy to update
Forms the foundation of your KPI scorecard with automated calculations
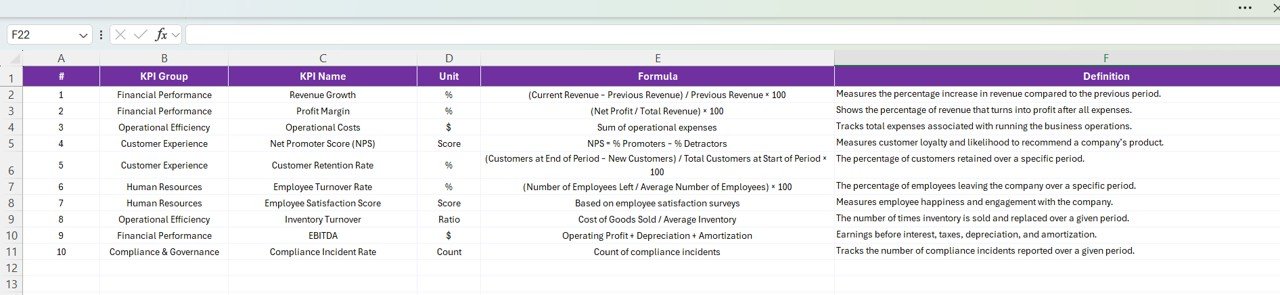
📖 KPI Definition Sheet
Reference for KPI names, formulas, units, and definitions
Ensures clarity, accuracy, and alignment across teams
Helps avoid confusion and maintains consistent reporting
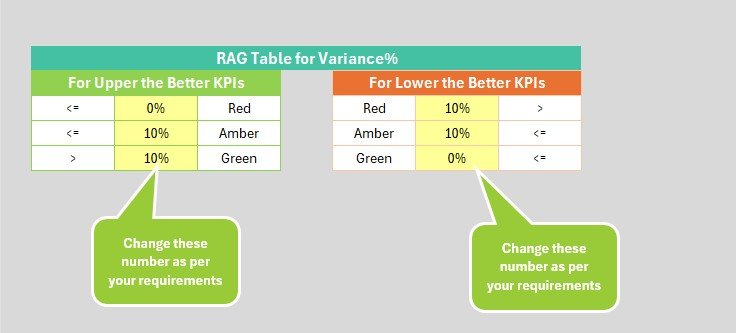
🎨 Color Settings Sheet
Customize visual indicators to match your preferences
Highlight priority KPIs with color codes
Improve readability and decision-making with intuitive visuals
📦 What’s Inside the General Management KPI Scorecard?
When you download this template, you’ll get:
✅ Pre-built Scorecard Dashboard with dropdown filters
✅ KPI Trend Sheet with dynamic charts
✅ Input Data Sheet for structured data entry
✅ KPI Definition Sheet with formulas and explanations
✅ Customizable Color Settings to match your reporting style
✅ Easy-to-follow structure, no coding required
Everything is designed to be plug-and-play — simply input your data and start analyzing performance instantly. 🚀
🧑💼 Who Can Benefit from This Scorecard?
🎯 Business Managers – Monitor departmental performance with clarity
🎯 Executives – Make data-driven decisions with confidence
🎯 Team Leaders – Track team goals vs targets
🎯 Analysts – Present KPI insights with easy visuals
🎯 SMEs & Enterprises – Scale the scorecard for single or multi-department use
This scorecard is versatile enough for organizations of all sizes and industries.
📊 How to Use the General Management KPI Scorecard
Enter Data – Input actuals and targets into the Input Data Sheet
Select Time Period – Use dropdown menus to toggle between MTD and YTD
Analyze Trends – Explore performance patterns in the KPI Trend Sheet
Check Definitions – Refer to KPI Definition Sheet for clarity
Customize Visuals – Adjust colors in the Color Settings Sheet
Within minutes, you’ll have a professional-grade KPI scorecard to evaluate and improve organizational performance.
🌟 Why Choose This Template?
Centralized performance tracking
Data-driven decision-making support
Visual trends for long-term insights
Fully customizable for your unique KPIs
Compatible with modern Excel versions (Windows & Mac)
With this template, you’re not just tracking KPIs — you’re empowering your business with a clear roadmap for success. 🌟
🔗 Click here to read the Detailed blog post
Watch the step-by-step video Demo:






























Reviews
There are no reviews yet.