Running a subscription box business means juggling dozens of moving parts — from subscriber acquisition and churn to fulfillment, revenue tracking, and customer satisfaction. 📦 Without the right system, it’s easy to miss critical trends that can affect growth and profitability.
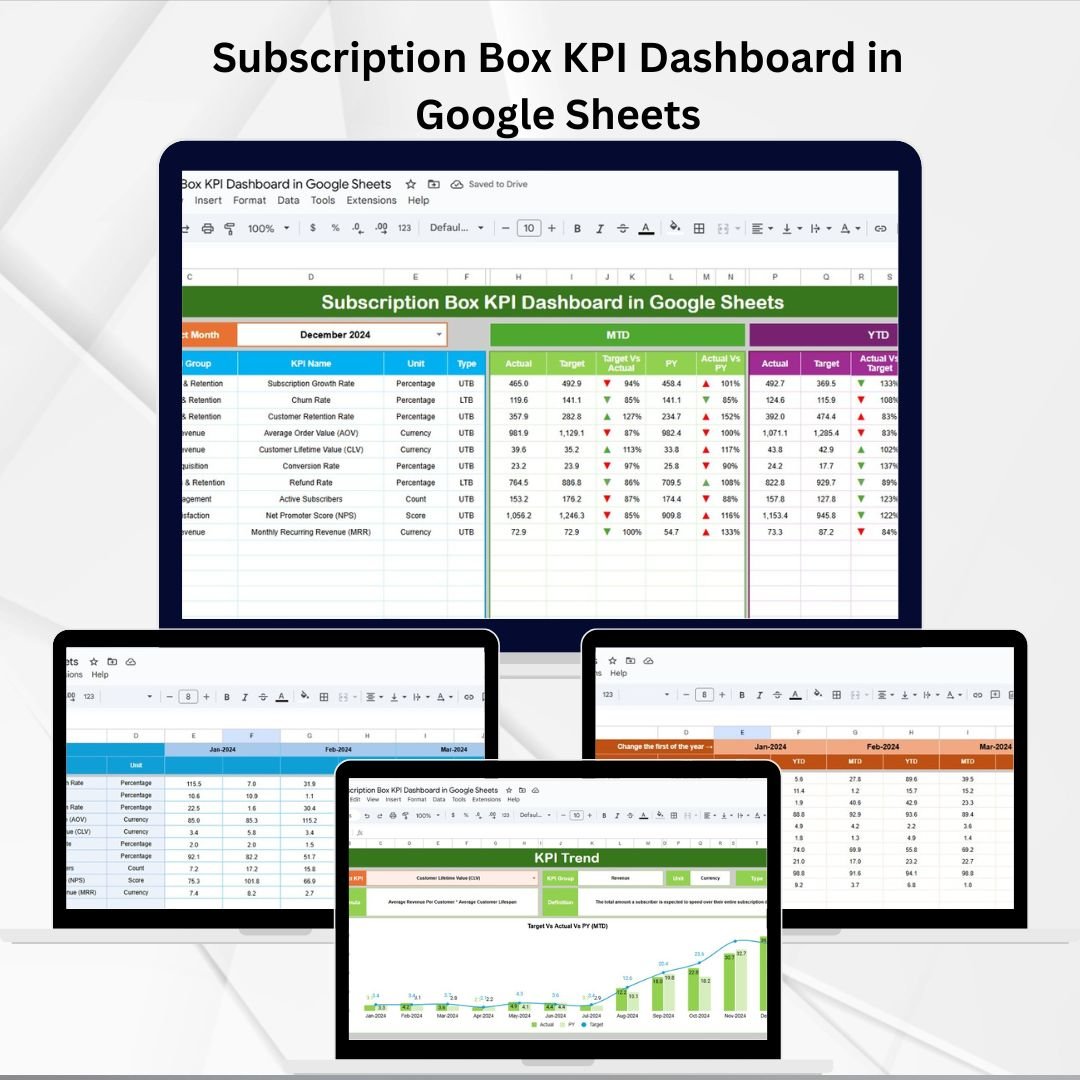
The Subscription Box KPI Dashboard in Google Sheets is a ready-to-use, interactive, and cloud-based tool designed to bring all your performance metrics into one place. With real-time updates, MTD/YTD comparisons, and historical insights, this dashboard helps subscription managers, e-commerce teams, and analysts make smarter, data-driven decisions.
🔑 Key Features of Subscription Box KPI Dashboard in Google Sheets
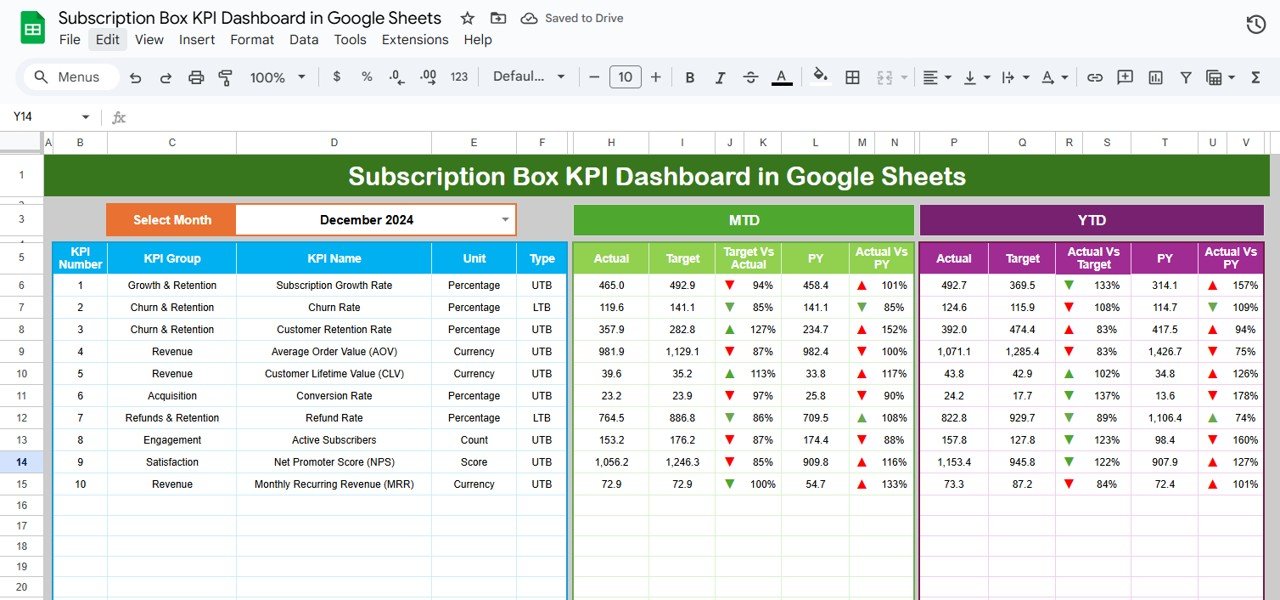
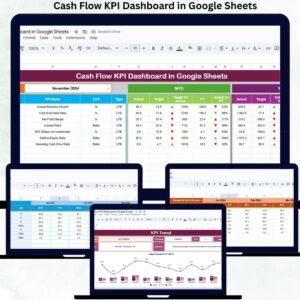
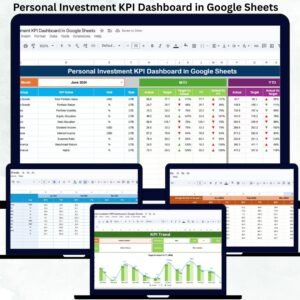
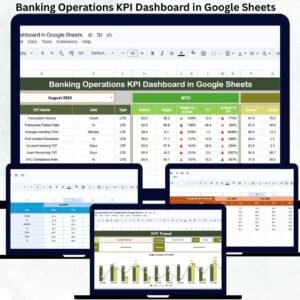
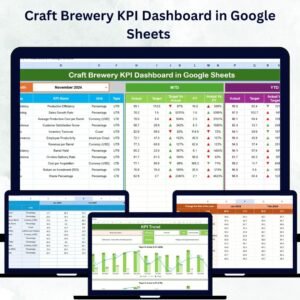
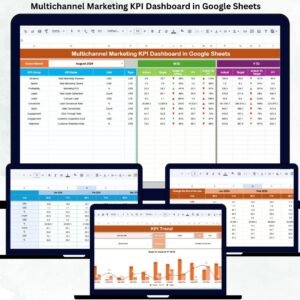
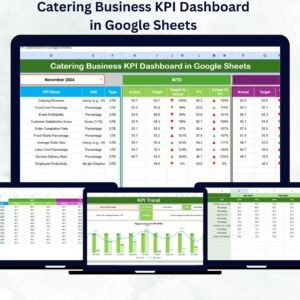
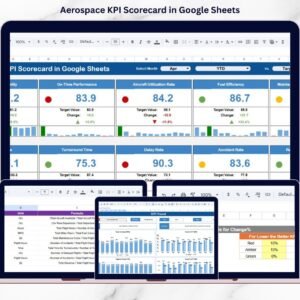
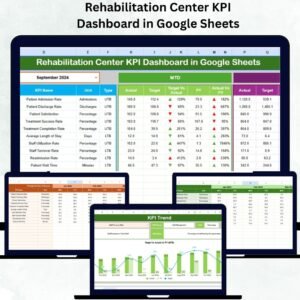
📊 Dashboard Tab (Performance Snapshot)
-
Select the month (D3) to auto-update KPIs.
-
MTD (Month-to-Date): Actual vs Target vs Previous Year with conditional formatting (up/down arrows).
-
YTD (Year-to-Date): Cumulative metrics with the same comparisons.
-
Provides instant visibility into business health.
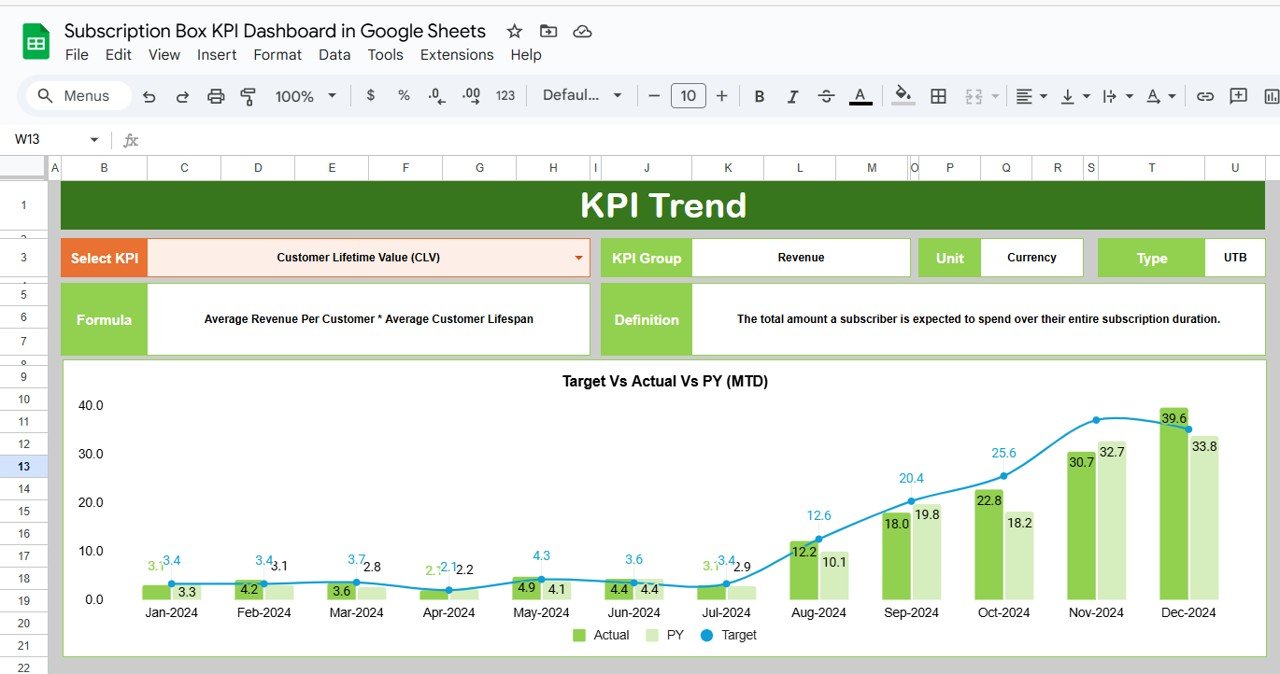
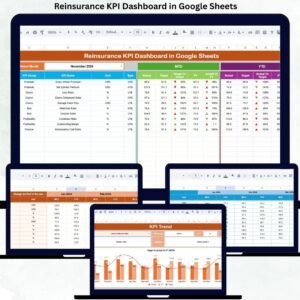
📈 KPI Trend Tab (Detailed Analysis)
-
Dropdown (C3) to select any KPI.
-
Displays KPI Group, Unit, Formula, Type (UTB/LTB), and Definition.
-
Track long-term trends and spot improvement opportunities.
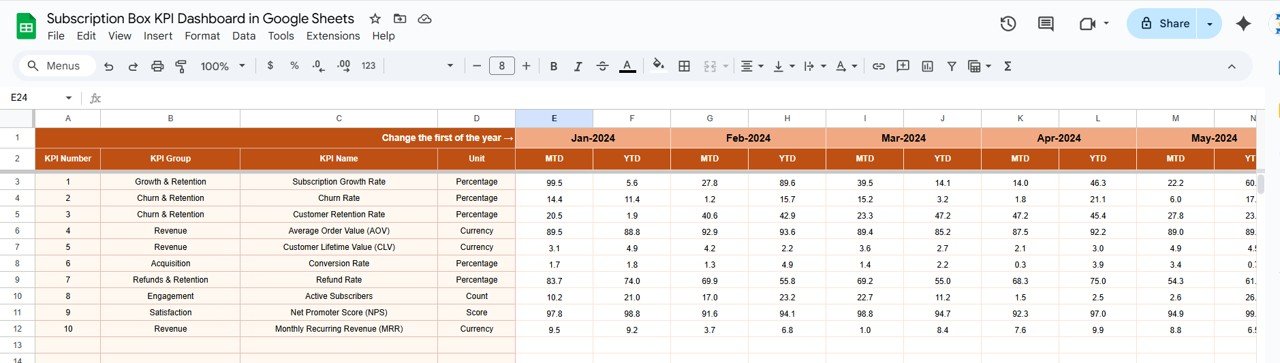
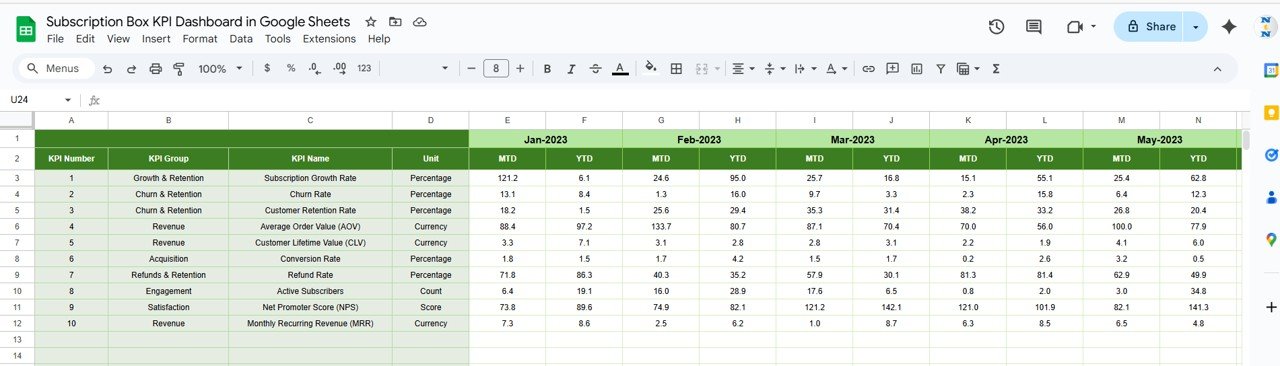
🧾 Actual Numbers Tab (Data Entry)
-
Input monthly and YTD actuals.
-
Month selector (E1) aligns reporting periods.
-
Automatically feeds data into dashboard visuals.
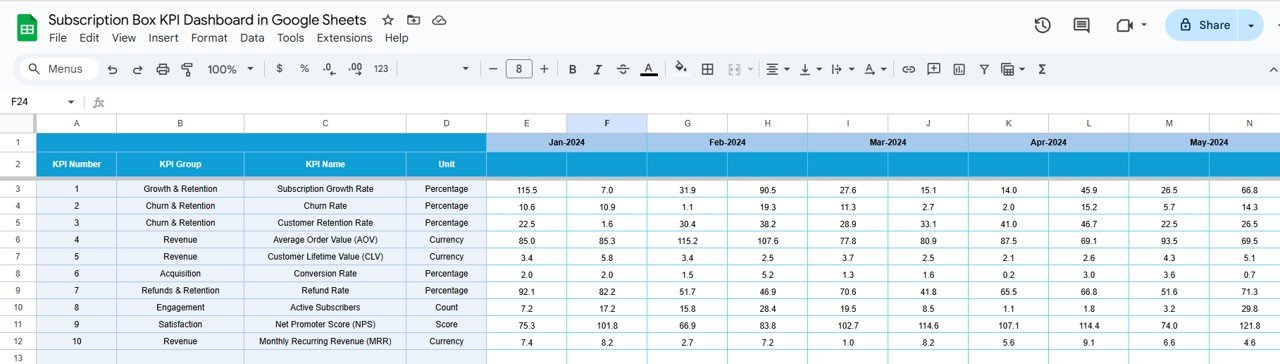
🎯 Target Tab (Goal Setting)
-
Input MTD and YTD targets per KPI.
-
Track variances and achievement rates.
-
Adapt quickly when targets change.
📉 Previous Year Numbers Tab (Benchmarking)
-
Record historical data for comparison.
-
Enables YOY (year-over-year) performance analysis.
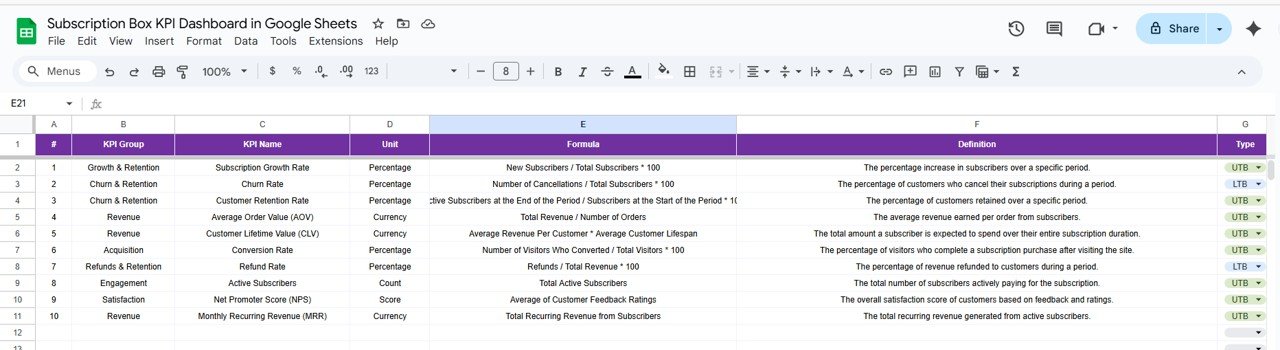
📚 KPI Definition Tab (Reference Guide)
-
Store KPI names, groups, units, formulas, and definitions.
-
Specify UTB (Upper the Better) or LTB (Lower the Better).
-
Keeps your team aligned on metric definitions.
📊 Example KPIs You Can Track
-
📦 New Subscribers (UTB) – Track acquisition growth.
-
🔄 Churn Rate (LTB) – Monitor retention performance.
-
💰 Monthly Recurring Revenue (MRR) (UTB).
-
🛒 Average Order Value (AOV) (UTB).
-
🚚 Fulfillment & Delivery Time (LTB).
-
🌟 Customer Satisfaction Score (UTB).
📦 What’s Inside the Template?
✅ 6 Structured Worksheets (Dashboard, KPI Trend, Actual, Target, Previous Year, KPI Definition)
✅ MTD & YTD comparisons with conditional formatting
✅ Sample data included for easy setup
✅ Cloud-based & collaboration ready
✅ Customizable KPIs and charts for your business needs
👥 Who Can Benefit from This Dashboard?
📦 Subscription Box Owners – Gain visibility into performance.
💻 E-commerce Teams – Track recurring revenue and retention.
📊 Analysts – Spot trends and provide actionable insights.
🎯 Marketing Teams – Measure acquisition vs churn.
🚀 Startups & Scaling Businesses – Ensure sustainable growth.
🧾 How to Use the Dashboard
-
📥 Download & Copy to Google Drive.
-
📝 Input actual numbers in the Actual Tab monthly.
-
🎯 Set targets in the Target Tab for each KPI.
-
📊 Review Dashboard Tab for performance insights.
-
📈 Use KPI Trend Tab to analyze long-term metrics.
-
🔁 Compare with Previous Year for YOY improvements.
-
🎨 Customize KPIs to suit your business goals.
Plug-and-play design means you can start monitoring right away. 🚀
🔗 Click here to read the Detailed blog post
Watch the step-by-step video Demo:


Reviews
There are no reviews yet.