


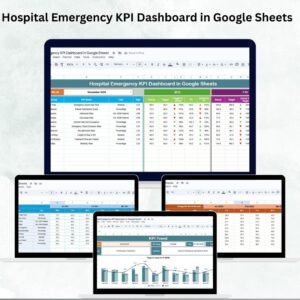
Hospital emergency departments face tremendous pressure daily to provide timely, efficient, and high-quality care. Delays or mismanagement can have serious consequences, making it vital to monitor performance with the right metrics. The Hospital Emergency KPI Dashboard in Google Sheets is a ready-to-use solution designed to help administrators, managers, and staff track, analyze, and visualize emergency KPIs in real time. 📊
This interactive, cloud-based dashboard consolidates all key performance indicators (KPIs) into a single platform. With features like Month-to-Date (MTD) and Year-to-Date (YTD) tracking, comparisons with previous years, trend analysis, and conditional formatting, hospitals can identify bottlenecks, optimize resources, and enhance patient outcomes.
🔑 Key Features of Hospital Emergency KPI Dashboard
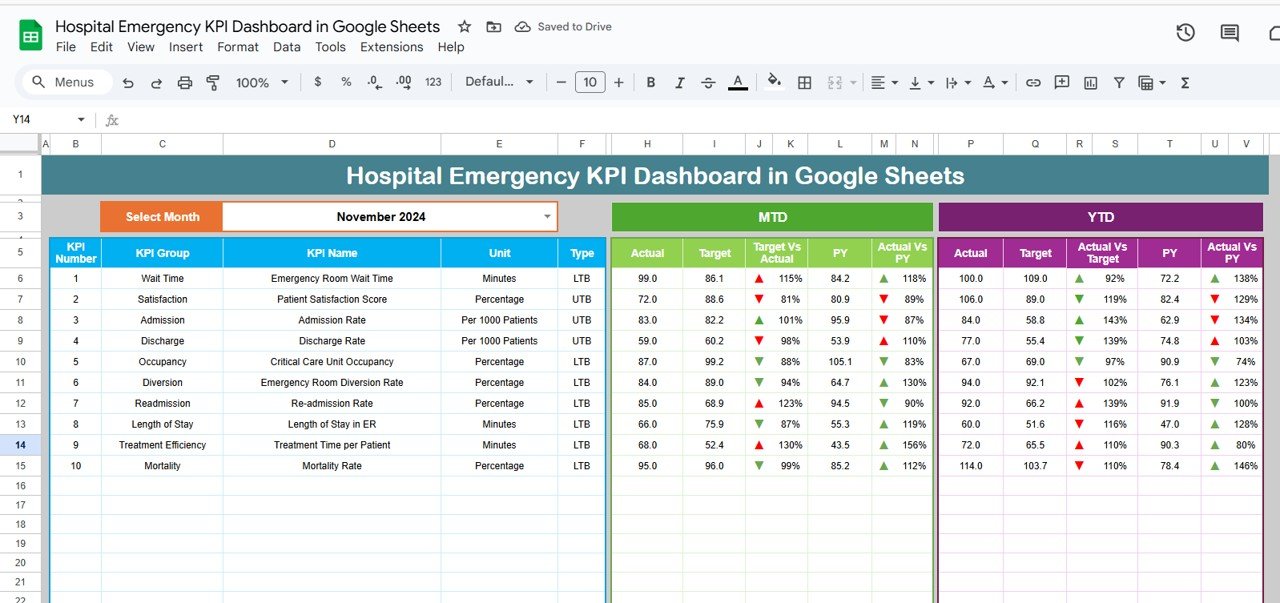
📊 Dashboard Sheet Tab
Central interface to view all KPIs.
Month selector updates the entire dashboard automatically.
MTD Actual vs Target and Previous Year comparisons.
Conditional formatting with arrows to instantly spot underperformance.
YTD analysis for long-term performance review.
📈 KPI Trend Sheet Tab
Dropdown selector to focus on any KPI.
Displays KPI group, unit, type (LTB/UTB), formula, and definition.
Helps staff understand how KPIs are calculated for accurate reporting.
🧾 Actual Number Sheet Tab
Input MTD and YTD actuals.
Auto-updates based on starting month.
Single source of truth for emergency data.
🎯 Target Sheet Tab
Enter monthly and yearly targets.
Aligns departmental goals with hospital objectives.
📉 Previous Year Number Sheet Tab
Store last year’s KPI data.
Compare year-over-year performance.
📑 KPI Definition Sheet Tab
Master list of all KPIs with formulas and explanations.
Ensures standardization and clarity across all users.
📦 What’s Inside the Dashboard
✅ 6 Pre-Built Sheets – Dashboard, KPI Trend, Actual Numbers, Targets, Previous Year, KPI Definitions
✅ Real-Time Tracking – Cloud-based with instant updates
✅ KPI Comparison – MTD, YTD, and YoY analysis
✅ Visual Insights – Conditional formatting with red/green arrows
✅ Plug-and-Play Setup – Just input your data
✅ Customizable KPIs – Add or adjust as per hospital needs
✅ Team Collaboration – Easy sharing and access with Google Sheets
👥 Who Can Benefit from This Dashboard?
🏥 Hospital Administrators – Monitor emergency KPIs in real time.
👩⚕️ Healthcare Managers – Track department efficiency and staff performance.
🚑 Emergency Department Staff – Optimize patient wait times and treatment flow.
📊 Data Analysts – Simplify reporting and performance tracking.
💡 Policy Makers & Regulators – Access standardized reports for compliance.
This dashboard is perfect for hospitals of all sizes looking for an affordable, easy-to-use performance tracking tool.
📋 Best Practices for Using the Dashboard
🔄 Update actual numbers weekly for accuracy.
🎯 Set realistic targets aligned with patient demand.
📊 Review trends to identify recurring issues.
🔎 Use conditional formatting to highlight weak spots.
👩🏫 Train staff to interpret KPIs consistently.
💾 Keep backups of monthly data for historical insights.
✅ Advantages of Hospital Emergency KPI Dashboard
Centralized Data – All KPIs in one sheet for easy monitoring.
Real-Time Insights – Cloud-based updates ensure accuracy.
Comparative Analysis – MTD, YTD, and Previous Year benchmarks.
Visual Indicators – Spot issues instantly with arrows and highlights.
Resource Optimization – Allocate staff and beds more effectively.
Simplified Reporting – Save time with pre-built charts and metrics.
🔗 Click here to read the Detailed blog post
Watch the step-by-step video Demo:















Reviews
There are no reviews yet.