

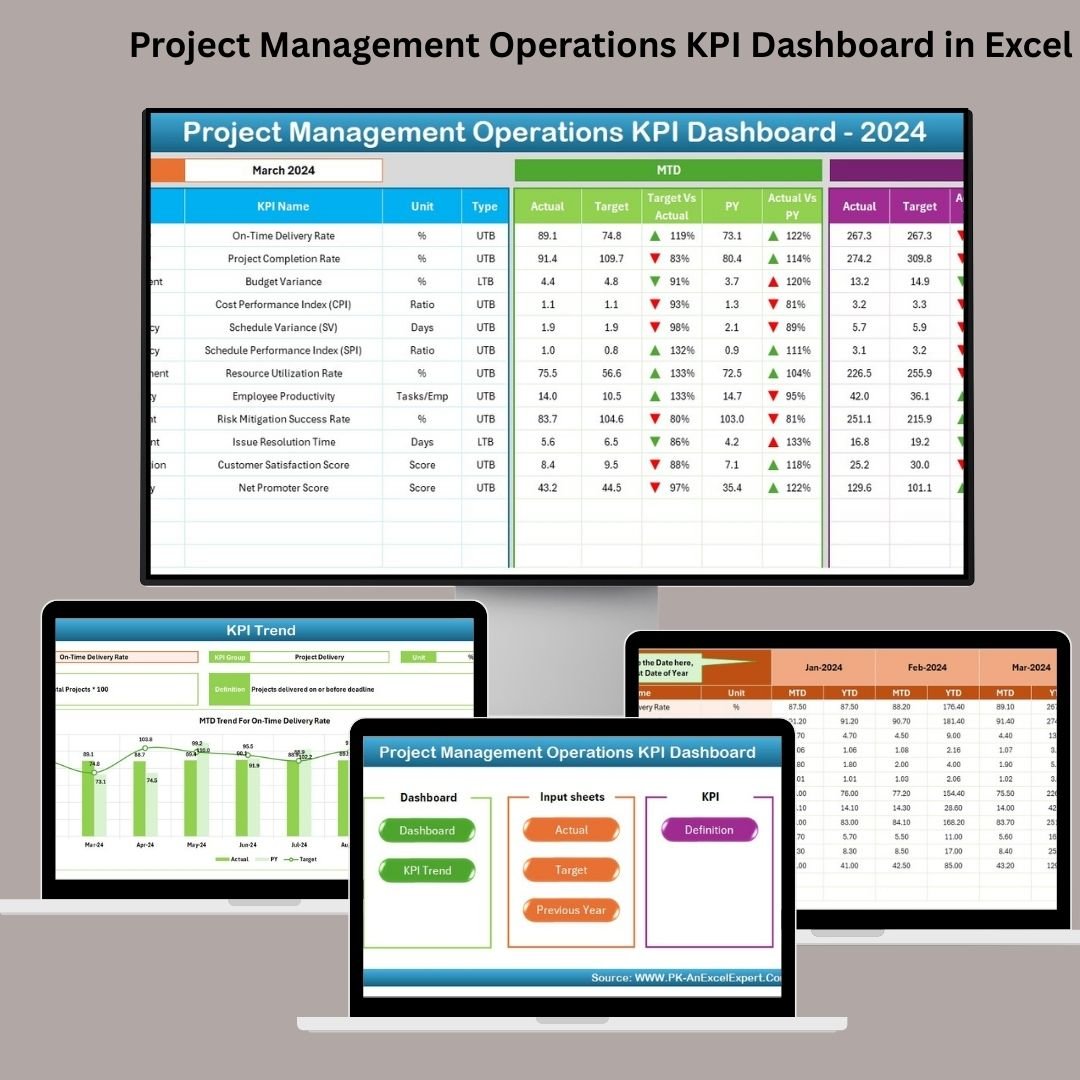
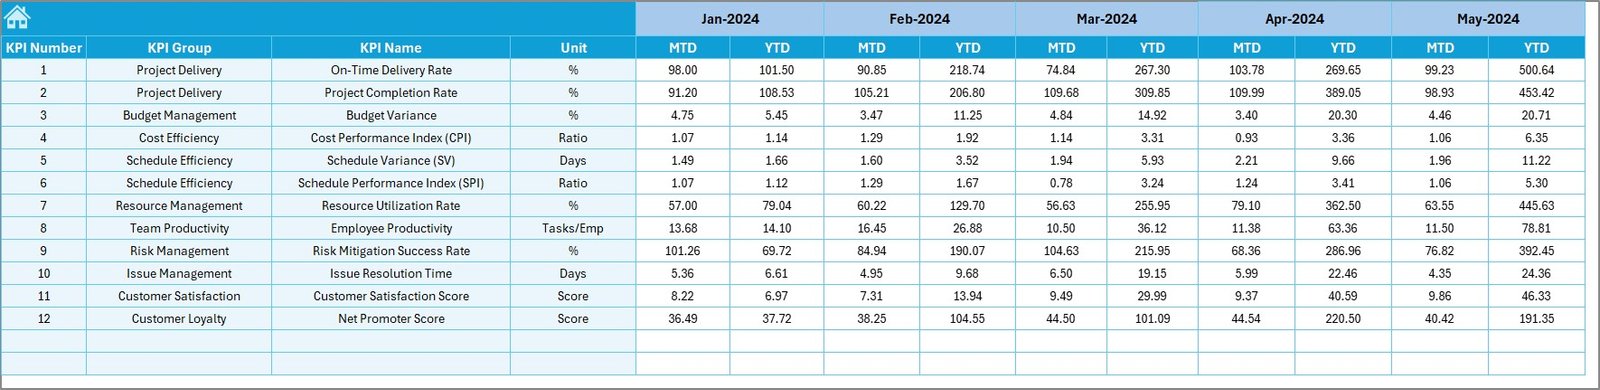
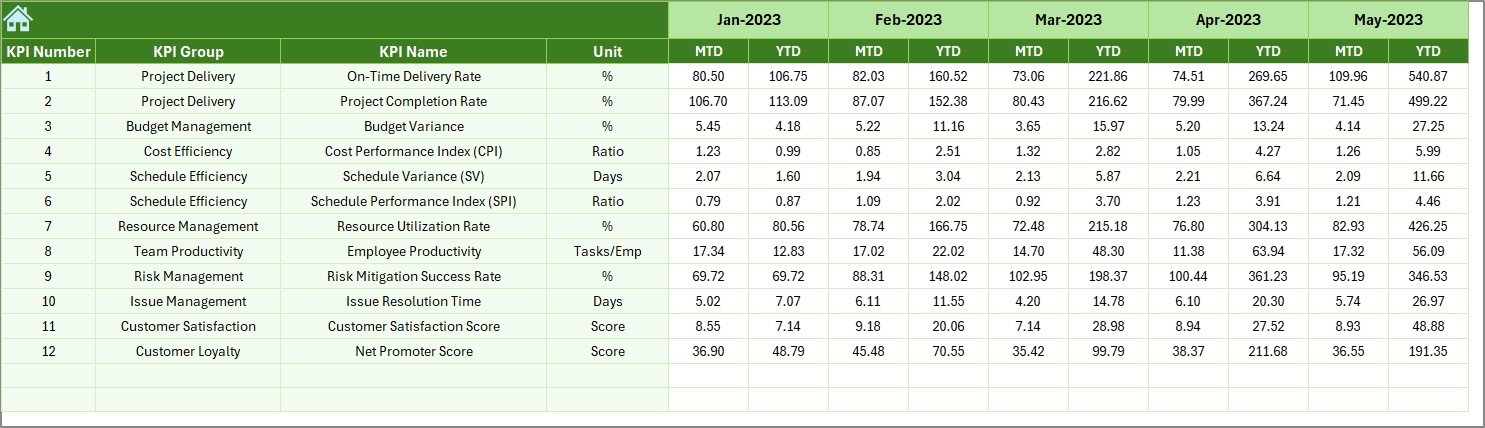
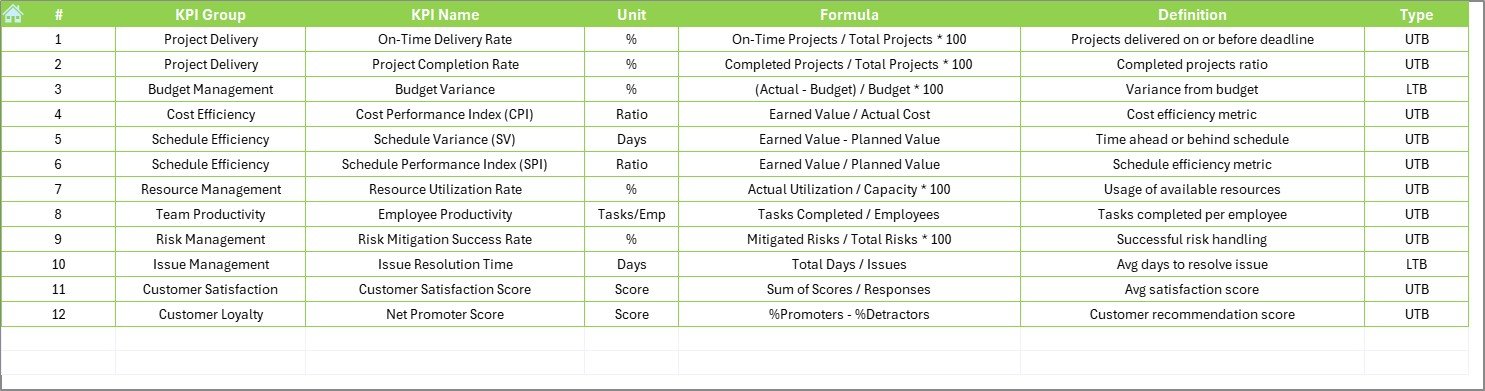

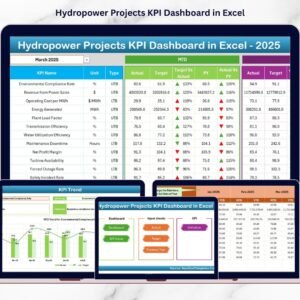
The Project Management Operations KPI Dashboard in Excel is an essential tool for project managers, teams, and organizations seeking to streamline their project management processes. This dashboard empowers you to track and manage all key performance indicators (KPIs) related to project operations, ensuring that projects stay on track, within budget, and meet deadlines.
Whether you’re overseeing a small team or managing large-scale projects, this Excel-based dashboard offers a centralized hub for tracking key metrics such as project timelines, costs, task completion, and resource allocation. With its real-time data updates, customizable features, and intuitive layout, it’s perfect for improving project visibility and driving team performance.
Key Features of the Project Management Operations KPI Dashboard in Excel
📊 Comprehensive Project Tracking
Monitor the overall health of your project with real-time tracking of key metrics like project completion percentage, milestones, and deadlines. Keep an eye on progress and stay ahead of any delays.
💼 Task & Resource Allocation Tracking
Allocate and monitor resources effectively across multiple projects. Ensure that tasks are assigned and completed on time, with a clear view of the team’s workload and availability.
⏰ Time Management & Milestone Tracking
Track critical project milestones and ensure they are met within the allocated timeframes. The dashboard provides clear visuals to help you stay focused on key deadlines.
💰 Budget vs Actual Tracking
Easily compare budgeted vs actual project costs. Monitor expenses, spot discrepancies early, and take corrective actions to prevent cost overruns.
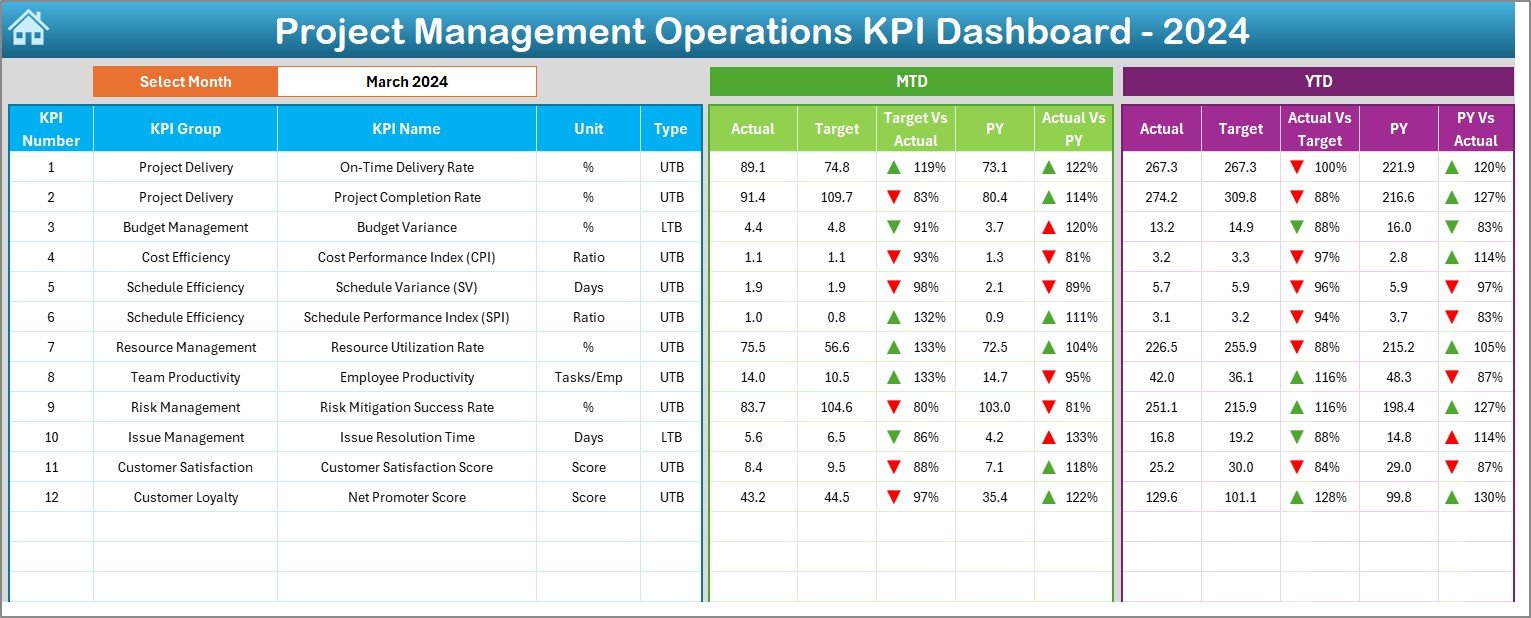
📈 Performance Indicators at a Glance
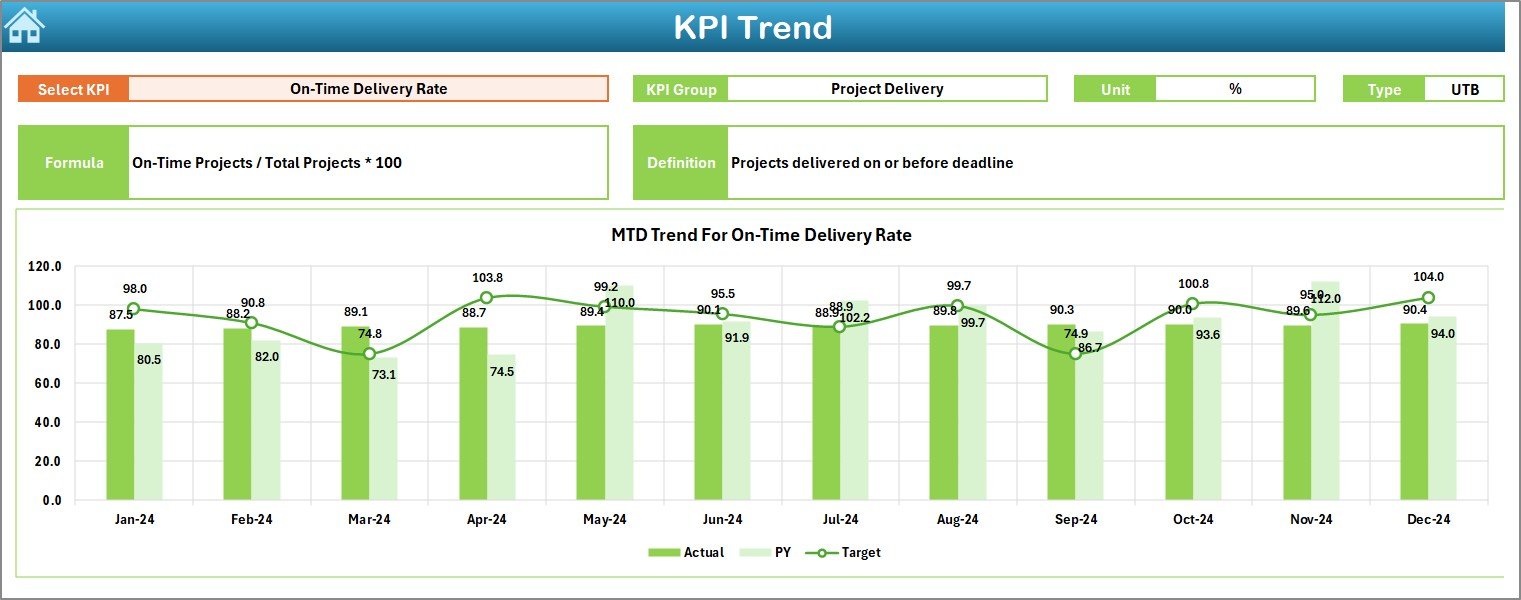
Get an overview of project performance using KPI visuals, including charts and graphs. Make data-driven decisions and proactively identify areas for improvement.
🔄 Customizable Inputs
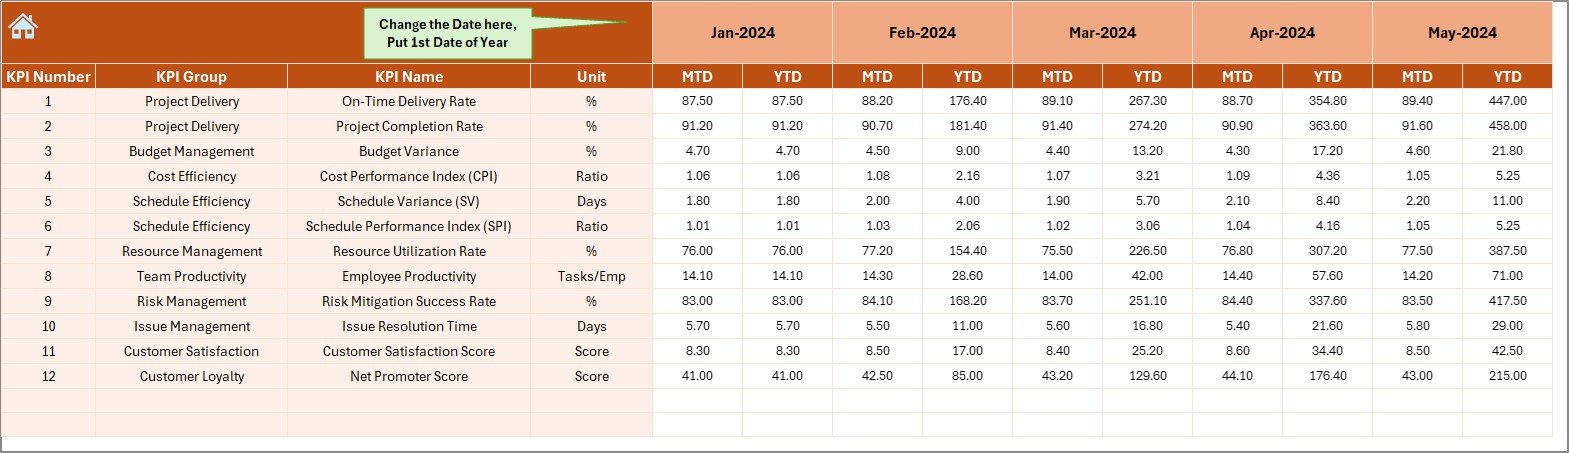
Tailor the dashboard to your specific project management needs. Add custom KPIs, task categories, or any other relevant metrics to ensure that the dashboard aligns perfectly with your operational goals.
Why You’ll Love the Project Management Operations KPI Dashboard in Excel
✅ Streamline Project Monitoring
Keep all your project data in one place, making it easier to monitor, track, and report on key performance metrics, helping to streamline project management.
✅ Improve Decision-Making
With real-time insights into your project’s performance, you can make informed decisions quickly and course-correct as necessary to avoid delays and budget issues.
✅ Enhance Team Productivity
Assign tasks efficiently and track progress against deadlines to ensure that everyone is working on the right priorities and tasks are completed on time.
✅ Save Time & Effort
Eliminate the need for manual tracking and reporting with automated features. The dashboard pulls in data from various sources, saving you time and reducing errors.
✅ Customizable & Scalable
Adapt the dashboard to suit any project size, from small initiatives to large-scale, multi-department projects. Customize it to track specific KPIs and data relevant to your organization.
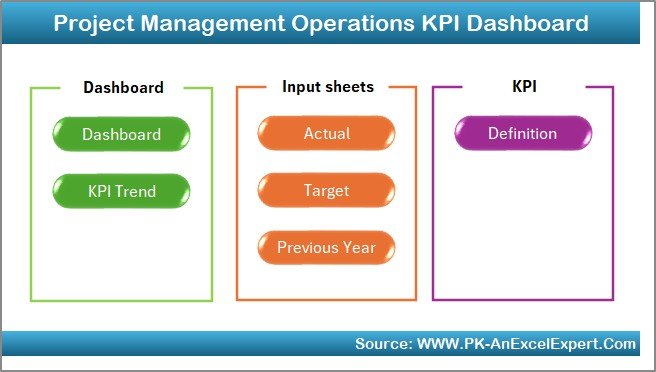
What’s Inside the Project Management Operations KPI Dashboard in Excel?
Project Tracking: Monitor overall project health and progress.
Task & Resource Allocation: Assign and track tasks, ensuring the right resources are allocated to each task.
Milestone & Time Management: Track milestones and deadlines for each project phase.
Budget Tracking: Compare budgeted vs actual project expenses.
KPI Performance Indicators: Visual indicators (charts/graphs) to assess project health.
Customizable Inputs: Add custom KPIs and metrics to suit project requirements.
How to Use the Project Management Operations KPI Dashboard in Excel
1️⃣ Download the Template: Instantly access your Project Management Operations KPI Dashboard in Excel.
2️⃣ Input Project Data: Add details about the project, including milestones, tasks, timelines, and budgets.
3️⃣ Assign Resources & Track Tasks: Allocate tasks and resources, ensuring progress is tracked.
4️⃣ Monitor KPIs & Milestones: Use real-time tracking to monitor progress against set milestones and deadlines.
5️⃣ Analyze & Report: Evaluate project performance, track budgets, and make data-driven decisions.
Who Can Benefit from the Project Management Operations KPI Dashboard in Excel?
🔹 Project Managers & Team Leads
🔹 Business Analysts
🔹 Resource Management Teams
🔹 Operations Managers
🔹 Executive Teams & Stakeholders
🔹 Companies Managing Multiple Projects
🔹 Consulting Firms & Agencies
Ensure your projects are on track and running smoothly with the Project Management Operations KPI Dashboard in Excel. Track tasks, budgets, resources, and timelines with ease and make informed decisions that keep your projects on time and within budget.
Click here to read the Detailed blog post
Visit our YouTube channel to learn step-by-step video tutorials
Youtube.com/@PKAnExcelExpert
























Reviews
There are no reviews yet.