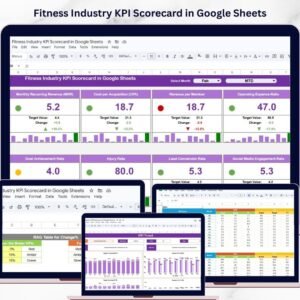
Fitness Industry KPI Dashboard in Google Sheets

Google Sheets - instant download

Original price was: ₹1,999.00.Current price is: ₹1,299.00.
Details, requirements and demo below
Sale!

Fitness Industry KPI Dashboard in Google Sheets

Original price was: ₹1,999.00.Current price is: ₹1,299.00.

Optimize your fitness business operations with our customizable Google Sheets KPI dashboard. Track key metrics like memberships, attendance, revenue, and client satisfaction to make informed, data-driven decisions.

Key Features:

  • Customizable KPIs: Tailor the dashboard to your specific business needs.

  • Real-Time Data Updates: Keep your dashboard current with the latest information.

  • Interactive Visualizations: Utilize charts and graphs for easy data interpretation.

  • User-Friendly Interface: Navigate the dashboard with ease.

  • Collaboration Tools: Share insights with team members and stakeholders.

- +

💡 Buy any 2 templates and save 20% automatically at checkout.

Pricing country
Prices follow your selected country; checkout uses your billing country.
Excel Pivot Tables & Dashboards: Basic to Advanced courseLaunch offer
🎓 NEXTGENTEMPLATES ACADEMY
Like this dashboard? Learn to build your own.
Excel Pivot Tables & Dashboards: Basic to Advanced

From your first Pivot Table to the Data Model, DAX, Power Query and a one-page KPI dashboard. 11h 51m of video by PK, with practice files, quizzes and a capstone.

In the rapidly growing fitness industry, tracking performance through Key Performance Indicators (KPIs) is essential for gym owners, fitness trainers, and wellness organizations. The Fitness Industry KPI Dashboard in Google Sheets is a comprehensive tool designed to help monitor and analyze critical metrics such as memberships, attendance, revenue, and client satisfaction. Utilizing Google Sheets allows for real-time updates, accessibility, and customization to fit specific business needs.
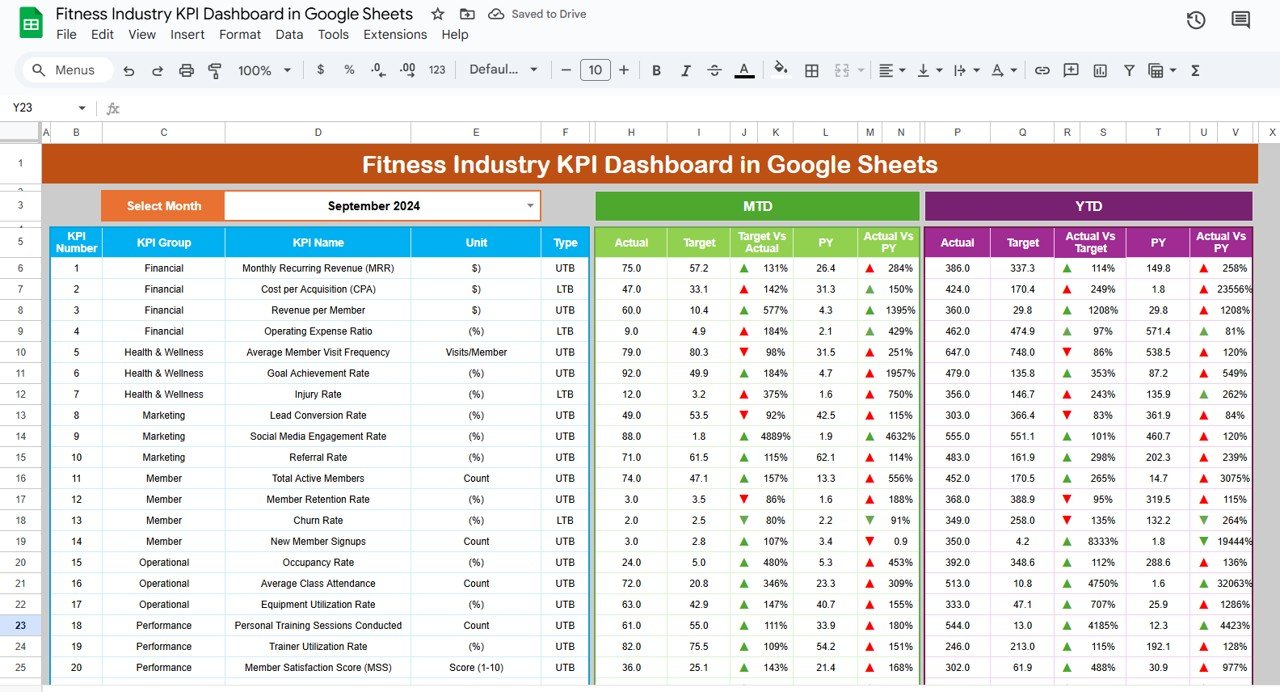
Fitness industry KPI dashboard

Key Features:

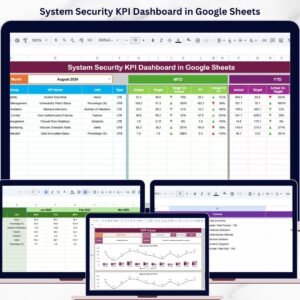
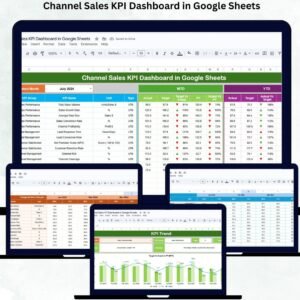
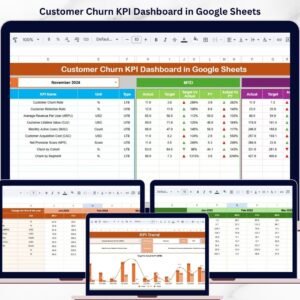
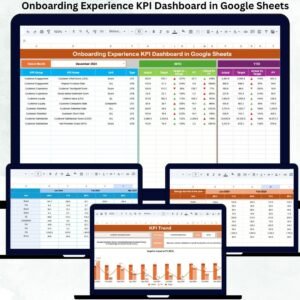
  • Dashboard Sheet Tab: The central hub displaying all key KPIs, including:

    • Month Selector: A dropdown menu to select the desired month, updating all data accordingly.

    • KPIs Display: Shows Month-to-Date (MTD) actual, target, and previous year data, with visual indicators for performance comparisons.

    • Year-to-Date (YTD) Data: Provides cumulative performance metrics for the selected period.

  • KPI Trend Sheet Tab: Offers detailed trends for each KPI, including:

    • KPI Group: Categorization of the KPI.

    • Unit of KPI: Measurement units (e.g., count, percentage, revenue).

    • Actual vs. Target Comparison: Visual representation of performance against goals.

    • Previous Year Comparison: Analysis of current performance against the previous year.

  • Actual Number Sheet Tab: Allows input of actual data for each KPI, facilitating real-time tracking and updates.

  • Target Sheet Tab: Enables setting and adjusting target values for KPIs, aiding in goal management.

  • Previous Year Number Sheet Tab: Stores data from the previous year for comparative analysis.

  • KPI Definition Sheet Tab: Provides definitions and explanations for each KPI, ensuring clarity and consistency in data interpretation.

Benefits:

  • Centralized Data Management: Consolidates all key metrics in one accessible location, streamlining data analysis and decision-making processes.

  • Real-Time Insights: Instantly update data, allowing for timely adjustments and informed decisions.

  • Customization: Tailor the dashboard to fit specific business needs, adding or modifying KPIs as required.

  • Performance Tracking: Monitor both short-term and long-term performance, identifying trends and areas for improvement.

  • Visual Representation: Utilize charts, graphs, and color-coded metrics to quickly understand data and performance levels.

Opportunities for Improvement:

  • Mobile Optimization: Enhance the dashboard’s mobile responsiveness to allow for on-the-go access and updates.

  • Integration with Other Tools: Incorporate data from other platforms or software to provide a more comprehensive view of business performance.

  • Advanced Analytics: Implement advanced analytical tools or features to gain deeper insights into data trends and patterns.

Best Practices for Using the Dashboard:

  • Regular Updates: Consistently input and update data to maintain accuracy and relevance.

  • Set Clear Targets: Define clear and achievable targets for each KPI to guide performance and goal-setting.

  • Analyze Trends: Regularly review trends and comparisons to identify areas of success and opportunities for improvement.

  • Share Insights: Collaborate with team members by sharing the dashboard and discussing insights to foster a data-driven culture.

Frequently Asked Questions (FAQs):

  1. What is a Fitness Industry KPI Dashboard?

    • A visual tool designed to track and analyze key performance metrics for fitness businesses.

  2. Why Should I Use a KPI Dashboard?

    • To monitor performance, make informed decisions, and drive business growth through data-driven insights.

  3. Can I Customize the Dashboard for My Fitness Business?

    • Yes, the dashboard is fully customizable to fit specific business needs and goals.

  4. How Do I Update My KPI Dashboard?

    • Input actual data into the respective sheets, and the dashboard will automatically update to reflect changes.

  5. Is the Fitness Industry KPI Dashboard Free?

    • Yes, the dashboard is available for free, providing a cost-effective solution for performance tracking.

Conclusion:

The Fitness Industry KPI Dashboard in Google Sheets is an invaluable tool for fitness businesses aiming to optimize operations, improve member satisfaction, and achieve financial goals. By consolidating critical metrics into a user-friendly interface, it empowers businesses to make informed, data-driven decisions that drive success.


🔗 Click here to read the Detailed blog post


Visit our YouTube channel to learn step-by-step video tutorials
Youtube.com/@PKAnExcelExpert
Watch the step-by-step video Demo:

Frequently asked questions

How do I get my own copy?
After purchase you get a link to the Google Sheet. Open it while signed in to your Google account and use File > Make a copy - the copy in your Google Drive is fully yours and editable.
Do I need a paid Google account? Will it expire?
No. A free Google account is enough, and your copy lives in your own Google Drive - it never expires and there is nothing to renew.
Does it work on Mac, phone or tablet?
Yes - in any browser on Windows, Mac or Chromebook, and in the Google Sheets mobile app for viewing and quick entries.
Can I share it with my team?
Yes. Share your copy with colleagues using Google's normal sharing, with view or edit rights as you choose.
Can I change the design and formulas?
Yes, your copy is fully editable - colours, labels, logo, formulas and charts. If a range is protected, use Data > Protect sheets and ranges to remove it in your copy.
Are there macros or add-ons?
No macros or add-ons - it uses normal Google Sheets formulas and charts.
Is it a one-time payment or a subscription?
One-time payment. No subscription, no per-user fees and nothing to renew - the file is yours to keep.
How do I get the file after payment?
Instantly. The download link appears on screen after checkout, is emailed to you, and stays under My Account > Downloads on our website. If the email does not arrive within a few minutes, check your spam or promotions folder.
Is a user manual included?
Most of our newer products include a PDF user manual in the download. If yours does not have one, message us with your order number and we will send it.
Do I get free updates?
Bug fixes are always free - if something does not work as described, we fix it and send you the corrected file. New versions with new features are not included in the price, unless this product's description says otherwise.
Can you customise it for me?
Yes. Small changes to this template (your columns, categories, logo, colours, minor layout) cost the template price plus $40-80 (Rs 3,000-6,000 + GST), quoted once you send your list. A fully custom build is usually $100-200 (Rs 8,000-18,000 + GST) with two revision rounds. Email your requirements to [email protected] or message us on WhatsApp.
Can I use it for my business or my clients?
Yes, for your own personal or internal business use, for as long as you like. Reselling or redistributing the template is not allowed.
What is your refund policy?
Because these are digital downloads, they are non-refundable once delivered - except when the product does not match its description (report it within 48 hours of purchase) or there is a technical problem our team cannot fix within 72 hours. Email [email protected] with your order number.
How do I get help?
Email [email protected] (Mon-Fri, 10 AM-7 PM IST) or message us on WhatsApp +91 80770 90260 (chat only, no calls). Please include your order number.

Still have a question? Click Need help? at the bottom-left to ask our assistant, or message us on WhatsApp.

Application

Google Sheets

Template Type

KPI Dashboard

Price

Paid

Business Or Department

Healthcare and Medical Services

Reviews

There are no reviews yet.

Only logged in customers who have purchased this product may leave a review.

Fitness Industry KPI Dashboard in Google SheetsFitness Industry KPI Dashboard in Google Sheets
Original price was: ₹1,999.00.Current price is: ₹1,299.00.
- +
Scroll to Top