

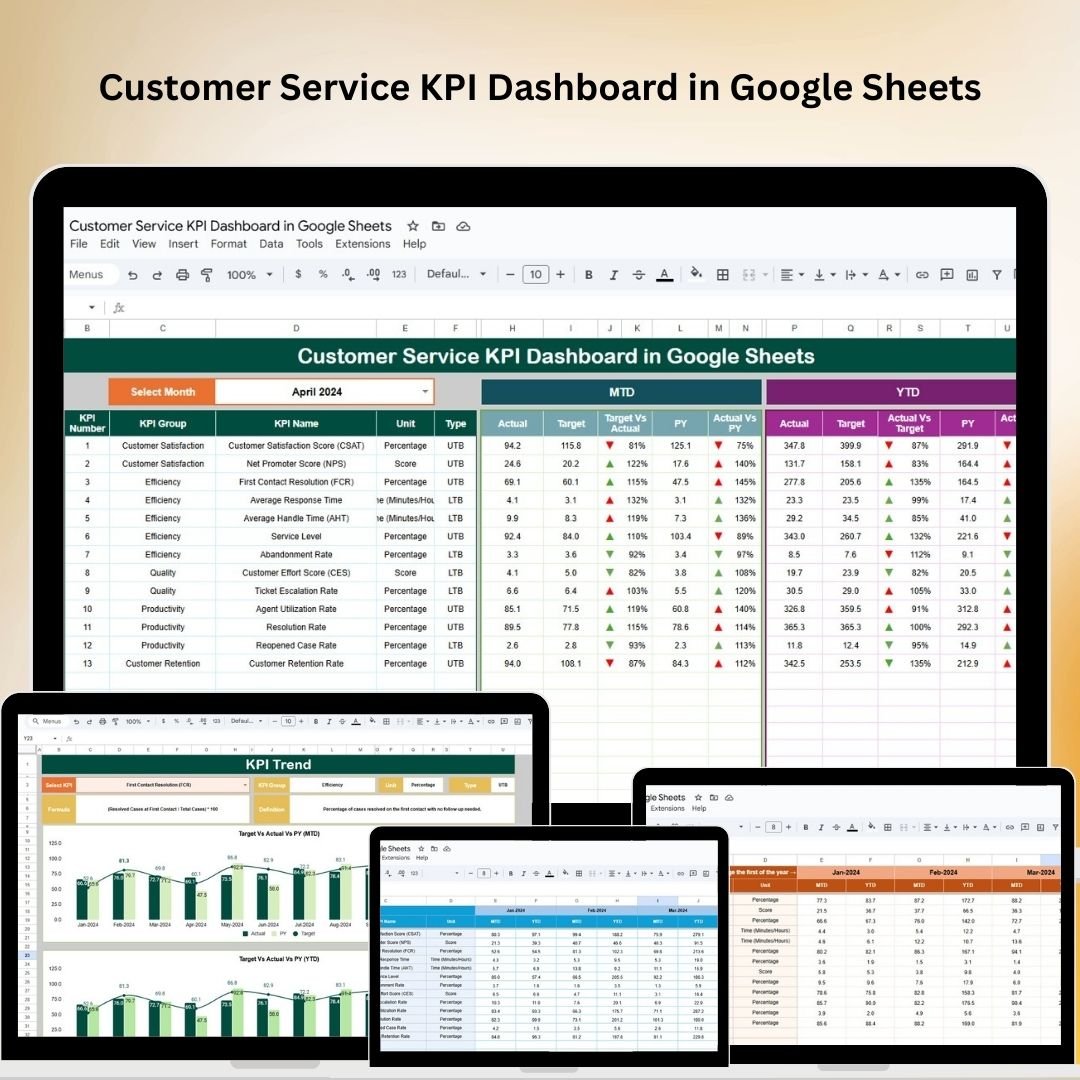
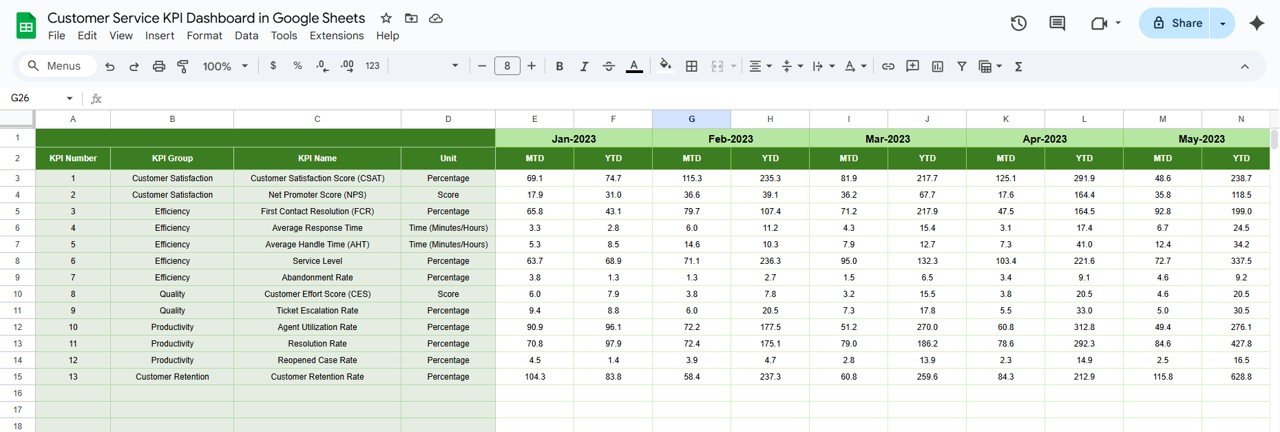
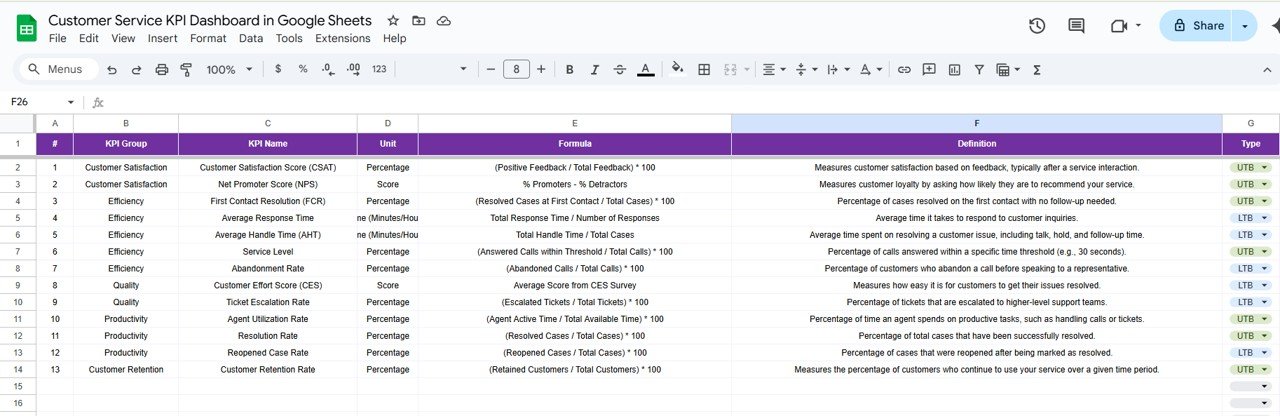

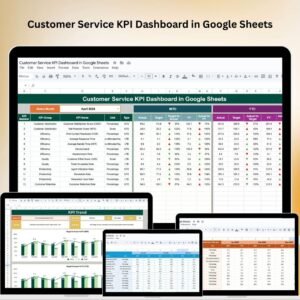
The Customer Service KPI Dashboard in Google Sheets is a powerful tool designed to help businesses monitor and analyze key performance indicators (KPIs) related to customer service operations. By utilizing this dashboard, organizations can gain valuable insights into their customer service performance, identify areas for improvement, and enhance overall customer satisfaction.
This dashboard helps track critical metrics such as response times, resolution times, and customer satisfaction (CSAT), providing businesses with real-time data to optimize their customer service processes. The ability to visualize this data with customizable charts helps teams make informed decisions and improve performance.

Key Features of the Customer Service KPI Dashboard in Google Sheets
📊 Comprehensive Performance Tracking
Response and Resolution Times: Monitor the average time taken to respond to and resolve customer inquiries, ensuring timely support.
Customer Satisfaction Scores: Track customer feedback and satisfaction levels to assess service quality.
Ticket Volume Analysis: Analyze the number of support tickets received over specific periods to identify trends and allocate resources effectively.
📈 Interactive Data Visualization
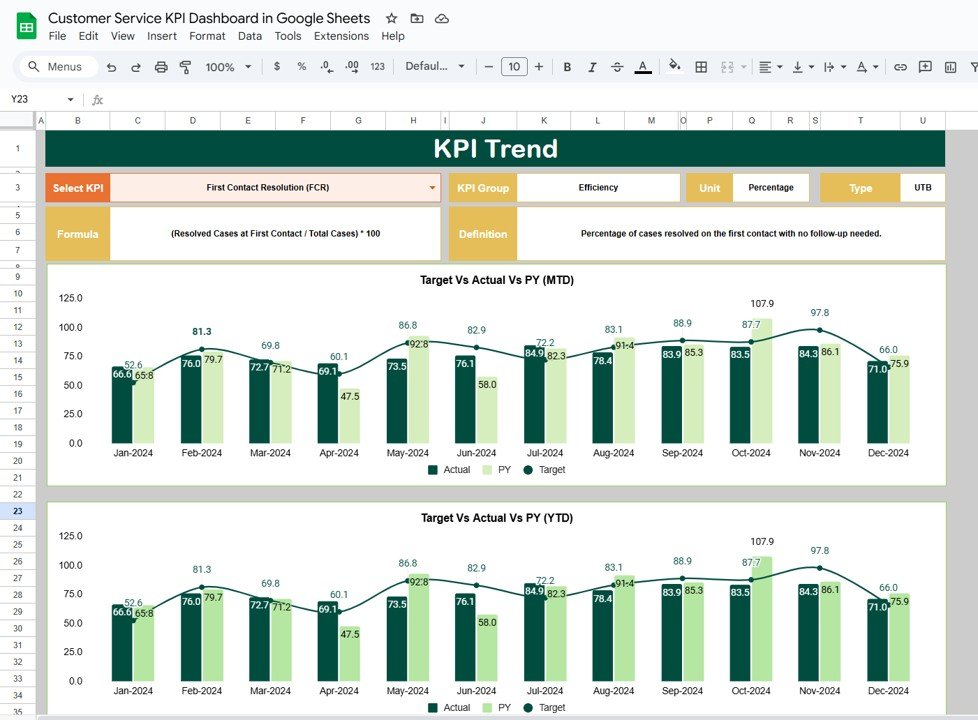
Dynamic Charts and Graphs: Use customizable visualizations, such as bar charts, line graphs, and pie charts, to interpret and present data effectively.
Real-Time Updates: Experience automatic updates as new data is entered, providing up-to-date insights into customer service performance.
🖥 User-Friendly Interface
Customizable Layouts: Adjust the dashboard to highlight metrics and KPIs that align with your specific business objectives.
Collaborative Features: Share the dashboard with your team, fostering transparency and collaborative decision-making.
🔒 Data Integrity and Security
Cloud-Based Accessibility: Access the dashboard securely from any location, ensuring it’s always available when needed.
Permission Settings: Control user access levels to protect sensitive customer data and maintain confidentiality.
Benefits of Using the Customer Service KPI Dashboard in Google Sheets
✅ Enhanced Decision-Making
Real-time data and visualizations allow for quick identification of trends and performance issues, supporting timely and informed decisions.
✅ Improved Operational Efficiency
Automated tracking and data entry reduce manual efforts, allowing your team to focus on strategic activities that drive business growth.
✅ Increased Customer Satisfaction
By closely monitoring customer service metrics, you can identify areas for improvement and enhance the overall customer experience.
✅ Strategic Planning
Access to comprehensive data empowers you to develop effective customer service strategies, driving sustained growth and customer loyalty.
Conclusion
The Customer Service KPI Dashboard in Google Sheets is an indispensable tool for businesses aiming to streamline customer service operations, enhance customer satisfaction, and improve decision-making. Its real-time data updates, customizable features, and user-friendly design make it a valuable asset for any organization looking to optimize their customer service processes.
Click here to read the Detailed blog post
Customer Service KPI Dashboard in Google Sheets
Visit our YouTube channel to learn step-by-step video tutorials
YouTube.com/@PKAnExcelExpert
Watch the step-by-step video Demo:
Compatibility and Requirements
- Works in Google Sheets. You need a free Google account and a web browser.
- Charts include bar charts, line graphs and pie charts. Google explains charts in Add & edit a chart or graph.
Who Is This Dashboard For?
Customer service managers, support team leads and operations managers who need to watch response times, resolution times, satisfaction scores and ticket volume in one place.
How to Use It
- Open the Google Sheets file with your Google account.
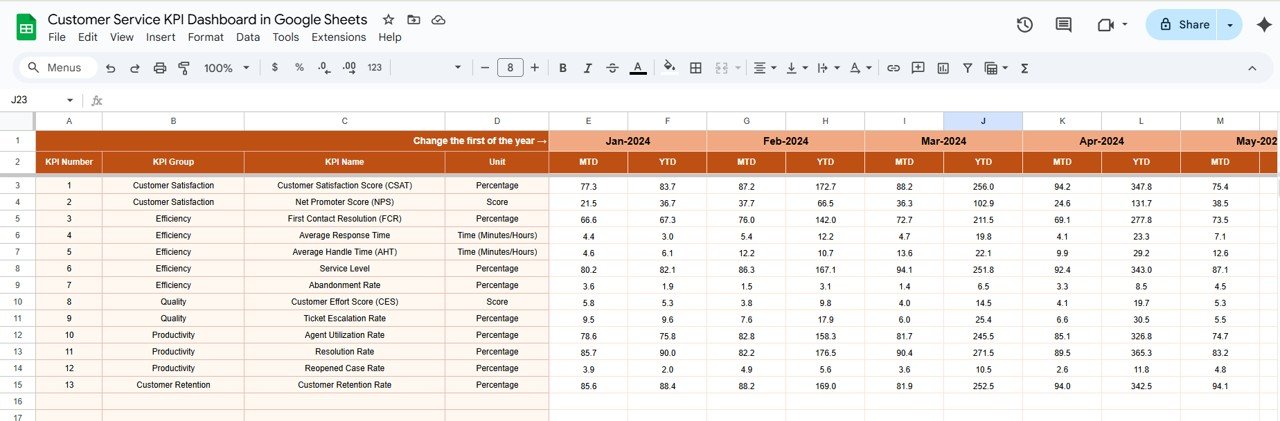
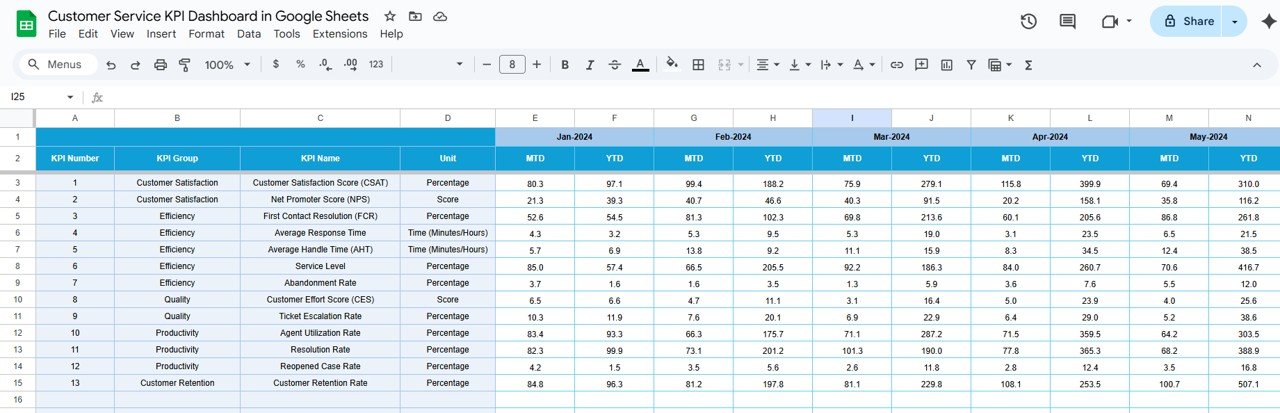
- Enter your support data, such as response and resolution times, customer satisfaction scores and ticket counts.
- Review the charts and graphs, which update as new data is entered.
- Adjust the layout to highlight the KPIs that matter most to your team.
- Share the dashboard with your team, using permission settings to control access.
Frequently Asked Questions
Which KPIs does it track?
Average response time, average resolution time, customer satisfaction scores and ticket volume.
Does it update automatically?
Yes. The charts update as you enter new data.
Can I share it with my team?
Yes. Share it like any Google Sheets file and use permission settings to control who can view or edit it.
Is there an Excel or Power BI version?
Yes. See the Customer Service KPI Dashboard in Excel and the Customer Service KPI Dashboard in Power BI.
Related Customer Service Templates
- Customer Service KPI Dashboard in Excel: the Excel edition
- Customer Service KPI Dashboard in Power BI: the Power BI edition
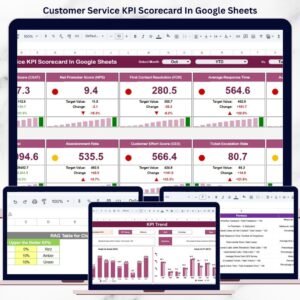
- Customer Service KPI Scorecard In Google Sheets: a scorecard view of support KPIs
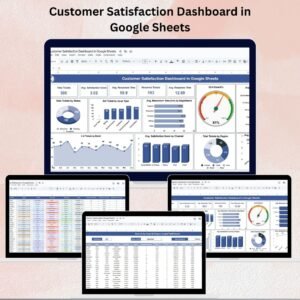
- Customer Service Dashboard In Google Sheets: a full customer service dashboard
- Customer Service Incentive Dashboard and Tracker in Google Sheets: tie support KPIs to incentives
Browse all Google Sheets KPI dashboards.








Reviews
There are no reviews yet.