

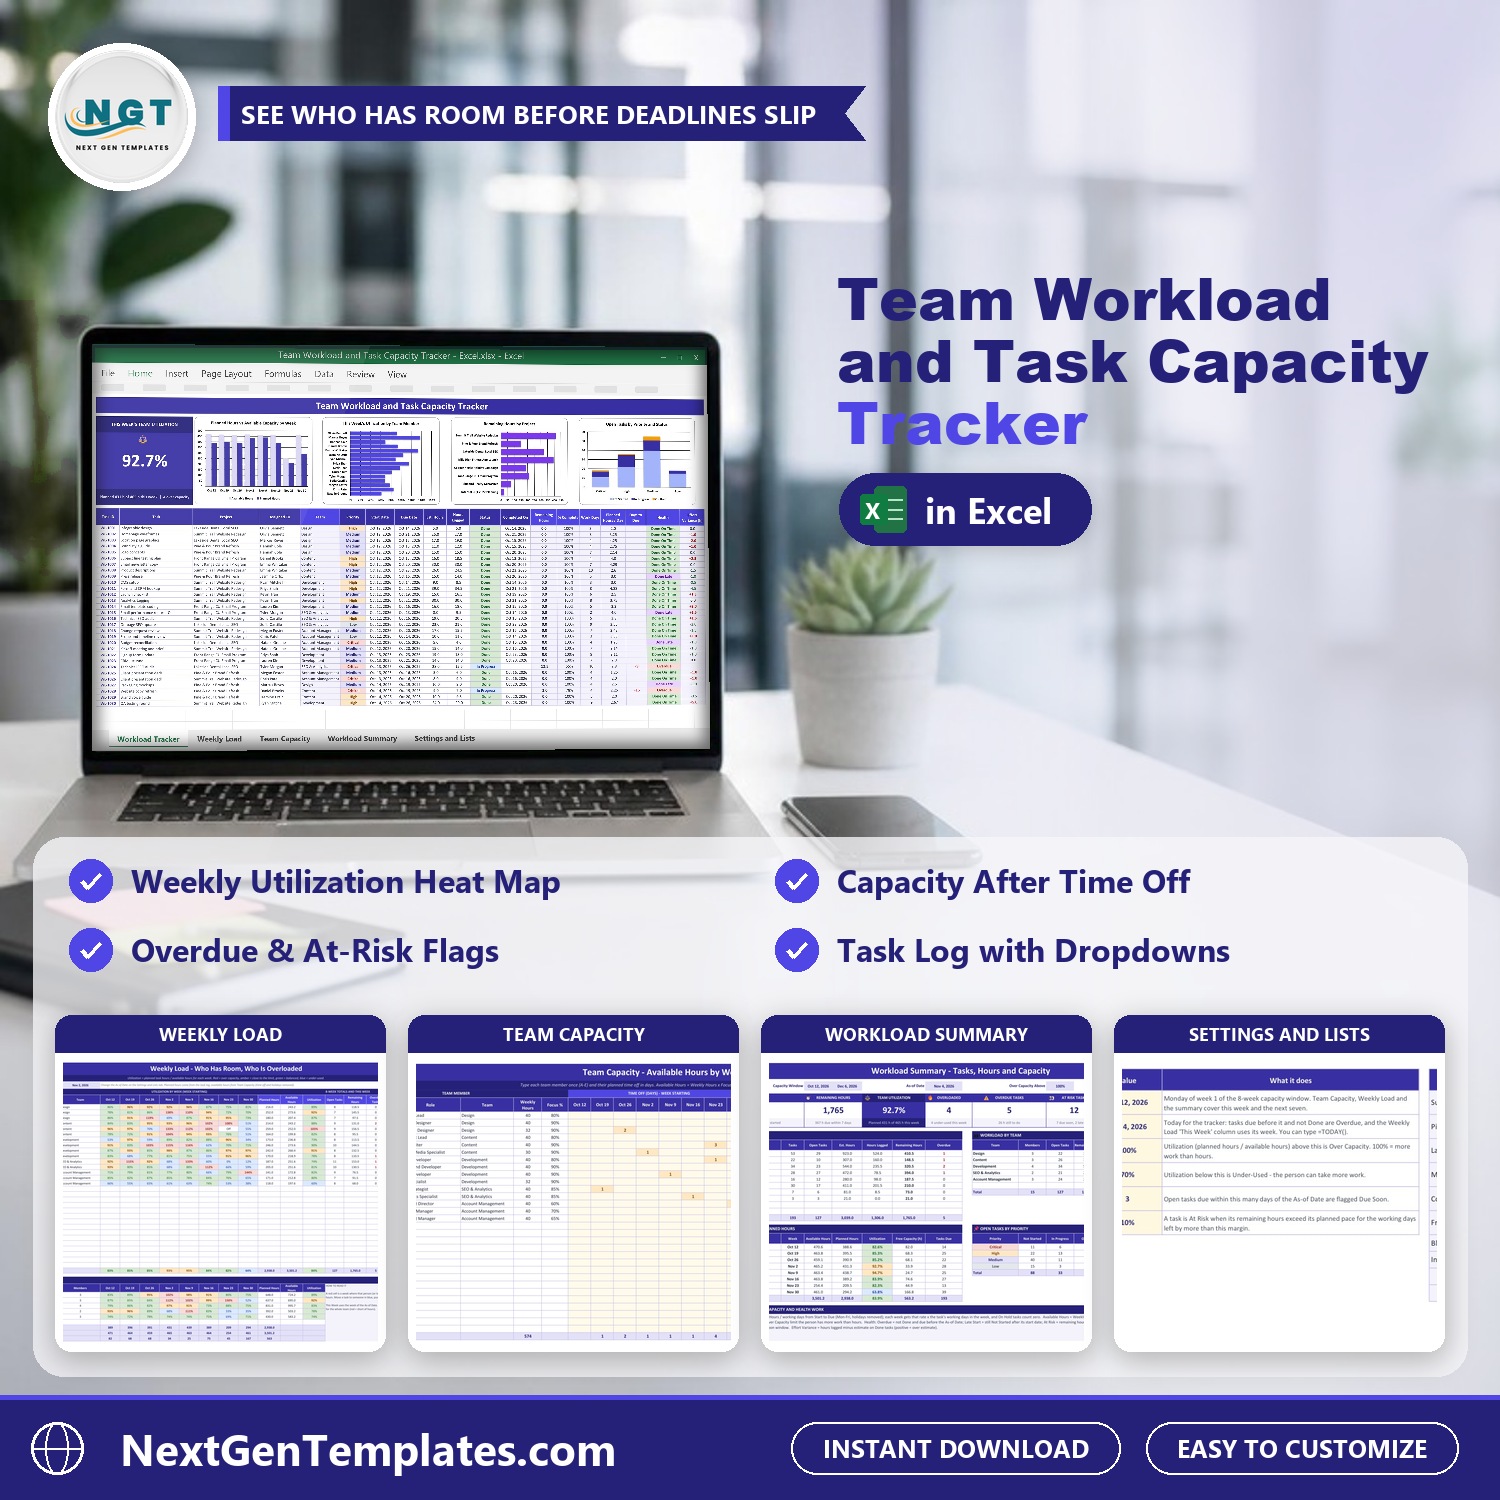
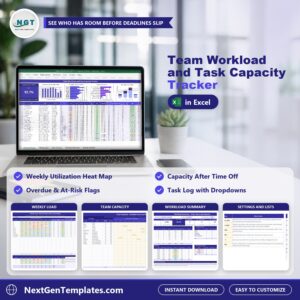
Who on your team has room for one more task, and who is already overloaded? The Team Workload and Task Capacity Tracker in Excel answers it week by week from the tasks you already track. Log every task once and it works out the planned hours for each of the next eight weeks, each person’s available hours after time off and holidays, a utilization heat map and a health flag for every task. It is a desktop Excel workbook with no macros.
Watch the Team Workload and Task Capacity Tracker in Excel walkthrough
Please note: this is a planning tracker for desktop Excel. It spreads each task’s estimated hours evenly over its working days, so it shows a planning view, not a time clock. The sample is a fictional Denver marketing agency with 15 people in 5 teams and 193 tasks over eight weeks. Replace it with your own team. Join 10,000+ customers in 180+ countries.
What You Get
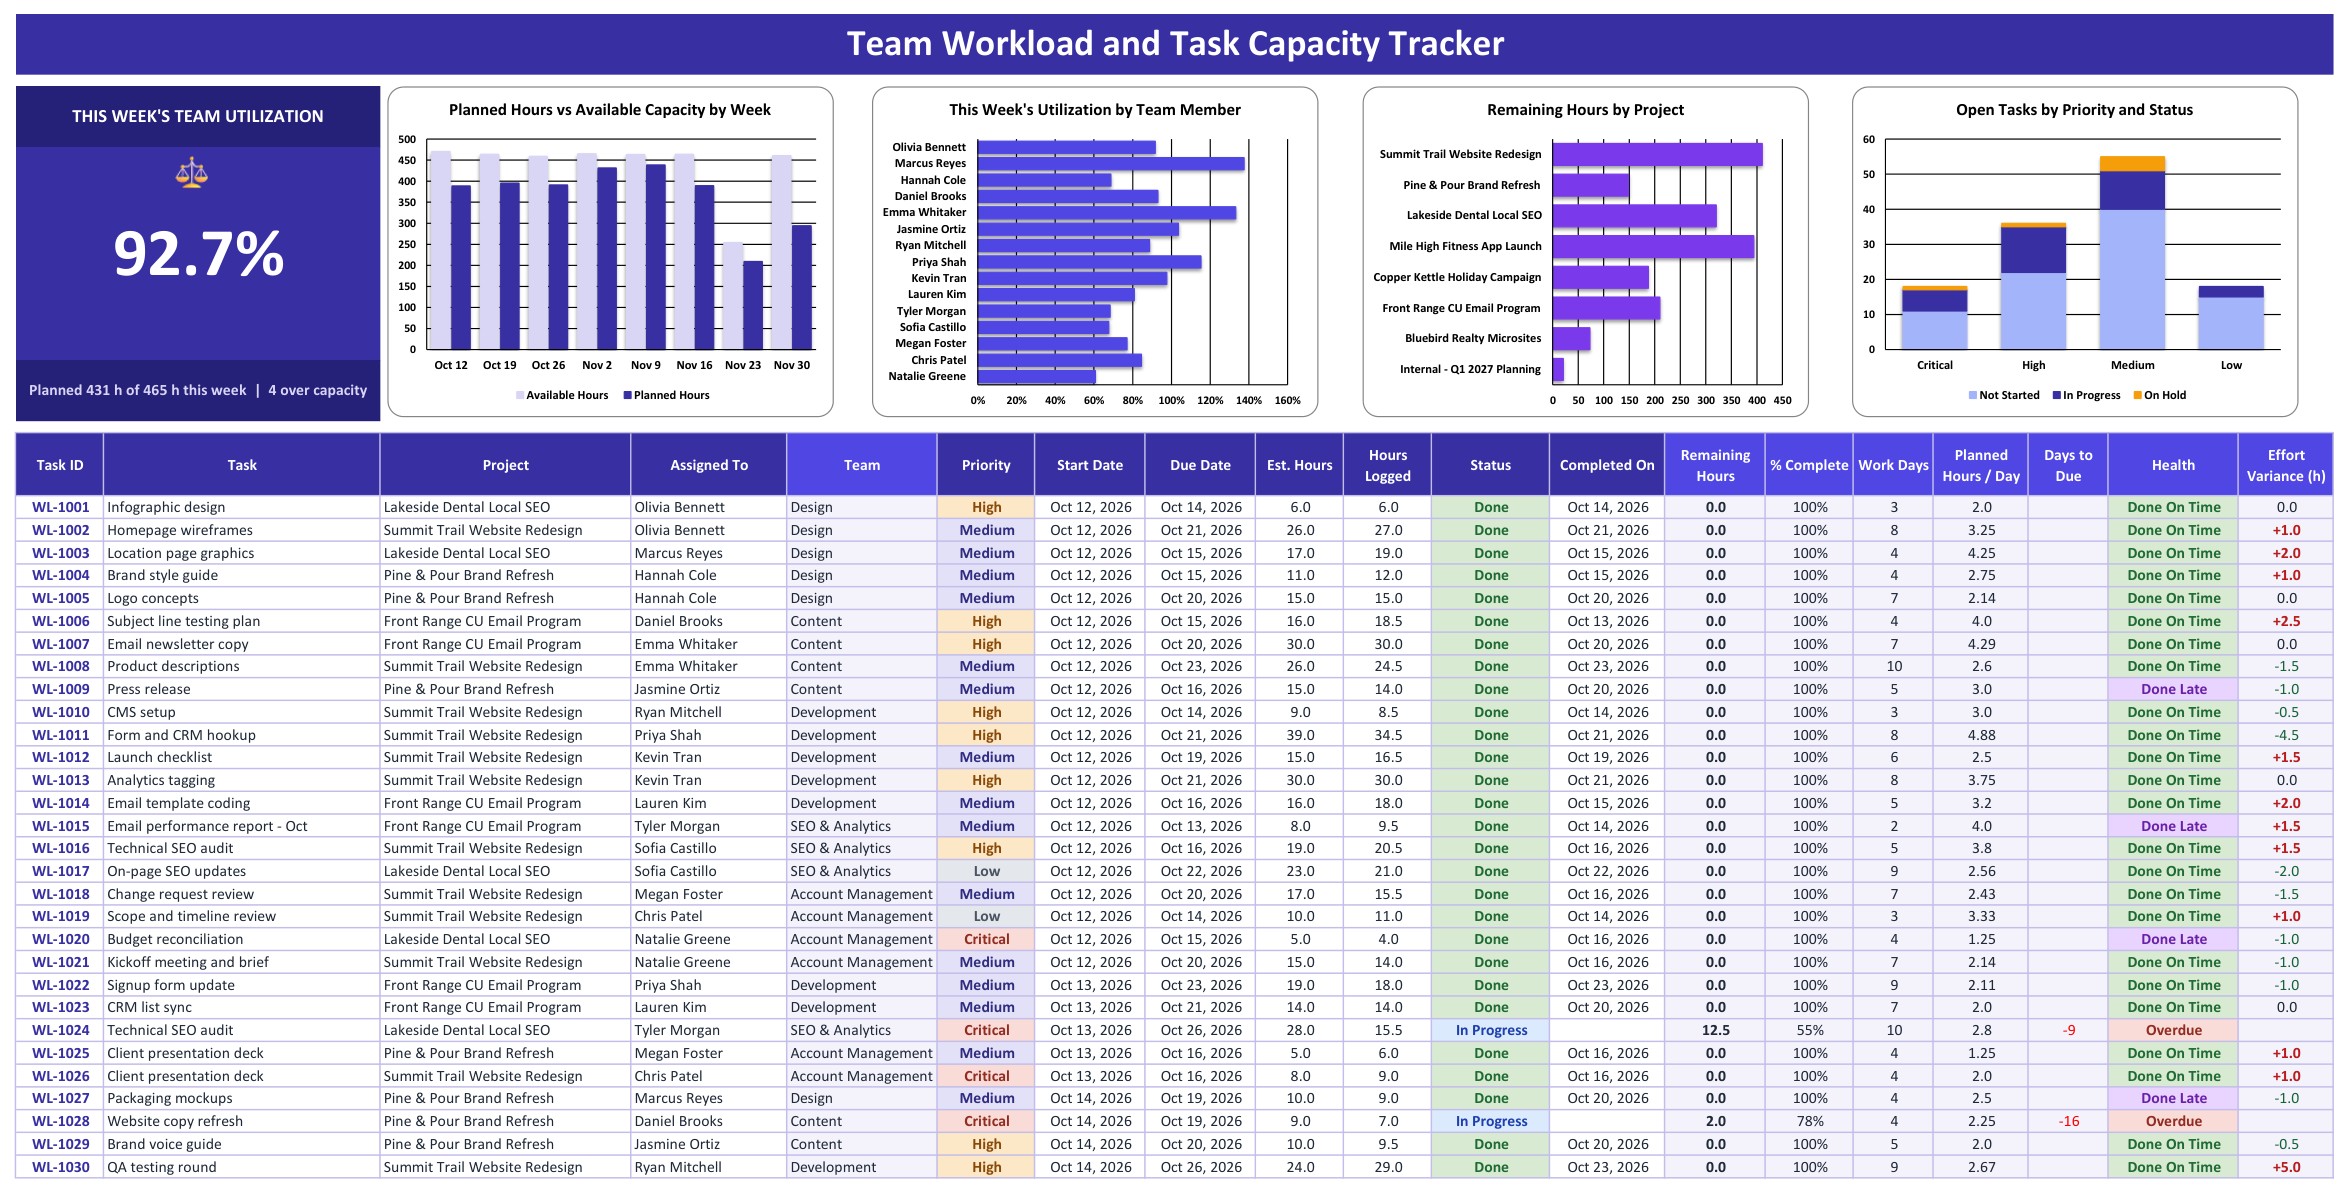
- A Workload Tracker tab with a This Week’s Team Utilization card, four charts and the task log
- Calculated columns for team, remaining hours, % complete, working days, planned hours per day, days to due, health and effort variance
- Eight weekly planned hour columns for every task that feed the heat map
- A Weekly Load heat map of utilization for every person and every week, plus team capacity by week and free capacity in hours
- A Team Capacity tab with weekly hours, focus % and time off in days for each week
- A Workload Summary tab with eight KPI tiles, workload by project, workload by team, weekly capacity vs planned hours and open tasks by priority
- Settings and Lists, Instructions and Explore More Templates tabs
Key Features
Workload Tracker
The big card shows this week’s team utilization, with the planned hours against the available hours and the number of people over capacity. Four charts sit next to it: Planned Hours vs Available Capacity by Week, This Week’s Utilization by Team Member, Remaining Hours by Project and Open Tasks by Priority and Status. Below is the task log. Every task is one row with the task ID, task, project, assigned to, priority, start date, due date, estimated hours, hours logged and status. The shaded columns calculate the team, remaining hours, % complete, working days, planned hours per day and days to due. The Health column flags each task as Done On Time, Done Late, On Hold, On Track, Due Soon, At Risk, Late Start or Overdue, and the Effort Variance column compares the hours logged with the estimate on finished tasks.
Weekly Load
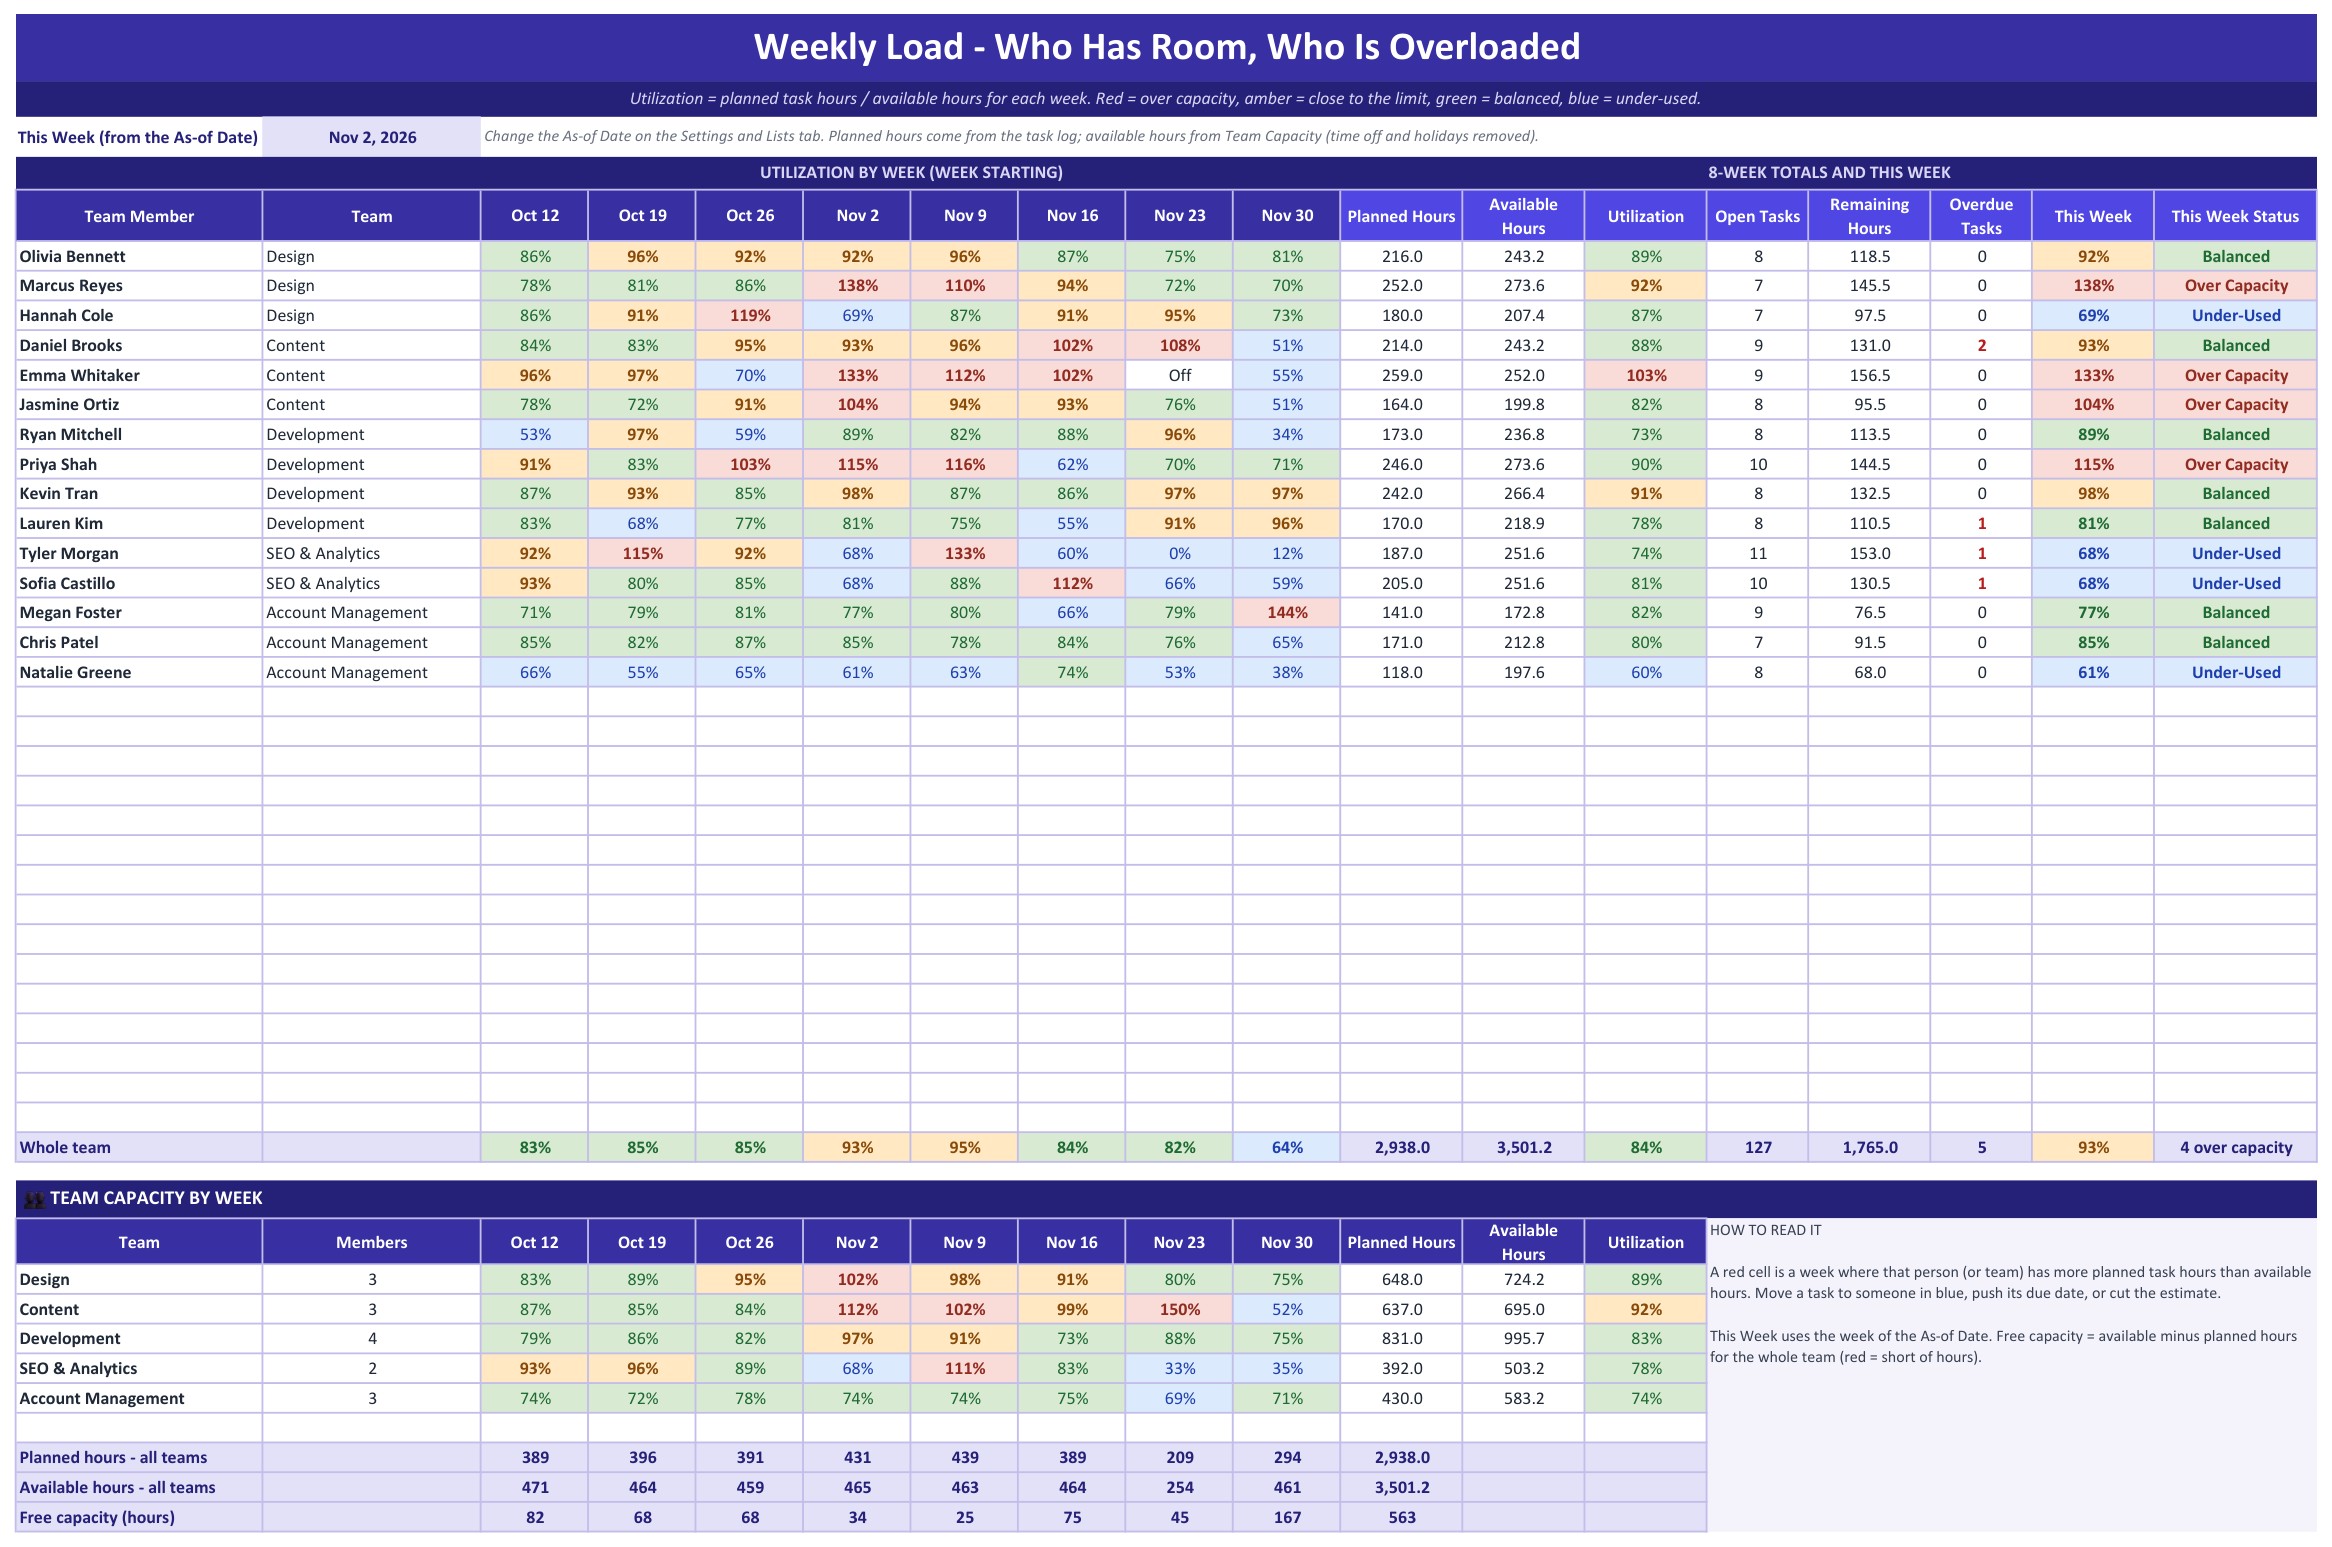
A heat map of utilization for every team member and every week. Red means more planned work than available hours, amber is close to the limit, green is balanced and blue is under used. On the right are the eight week totals for each person: planned hours, available hours, utilization, open tasks, remaining hours and overdue tasks, then this week’s utilization with its status. Below it is the team capacity by week and a free capacity row in hours, so when a task has to move you move it from a red cell to a blue one.
Team Capacity
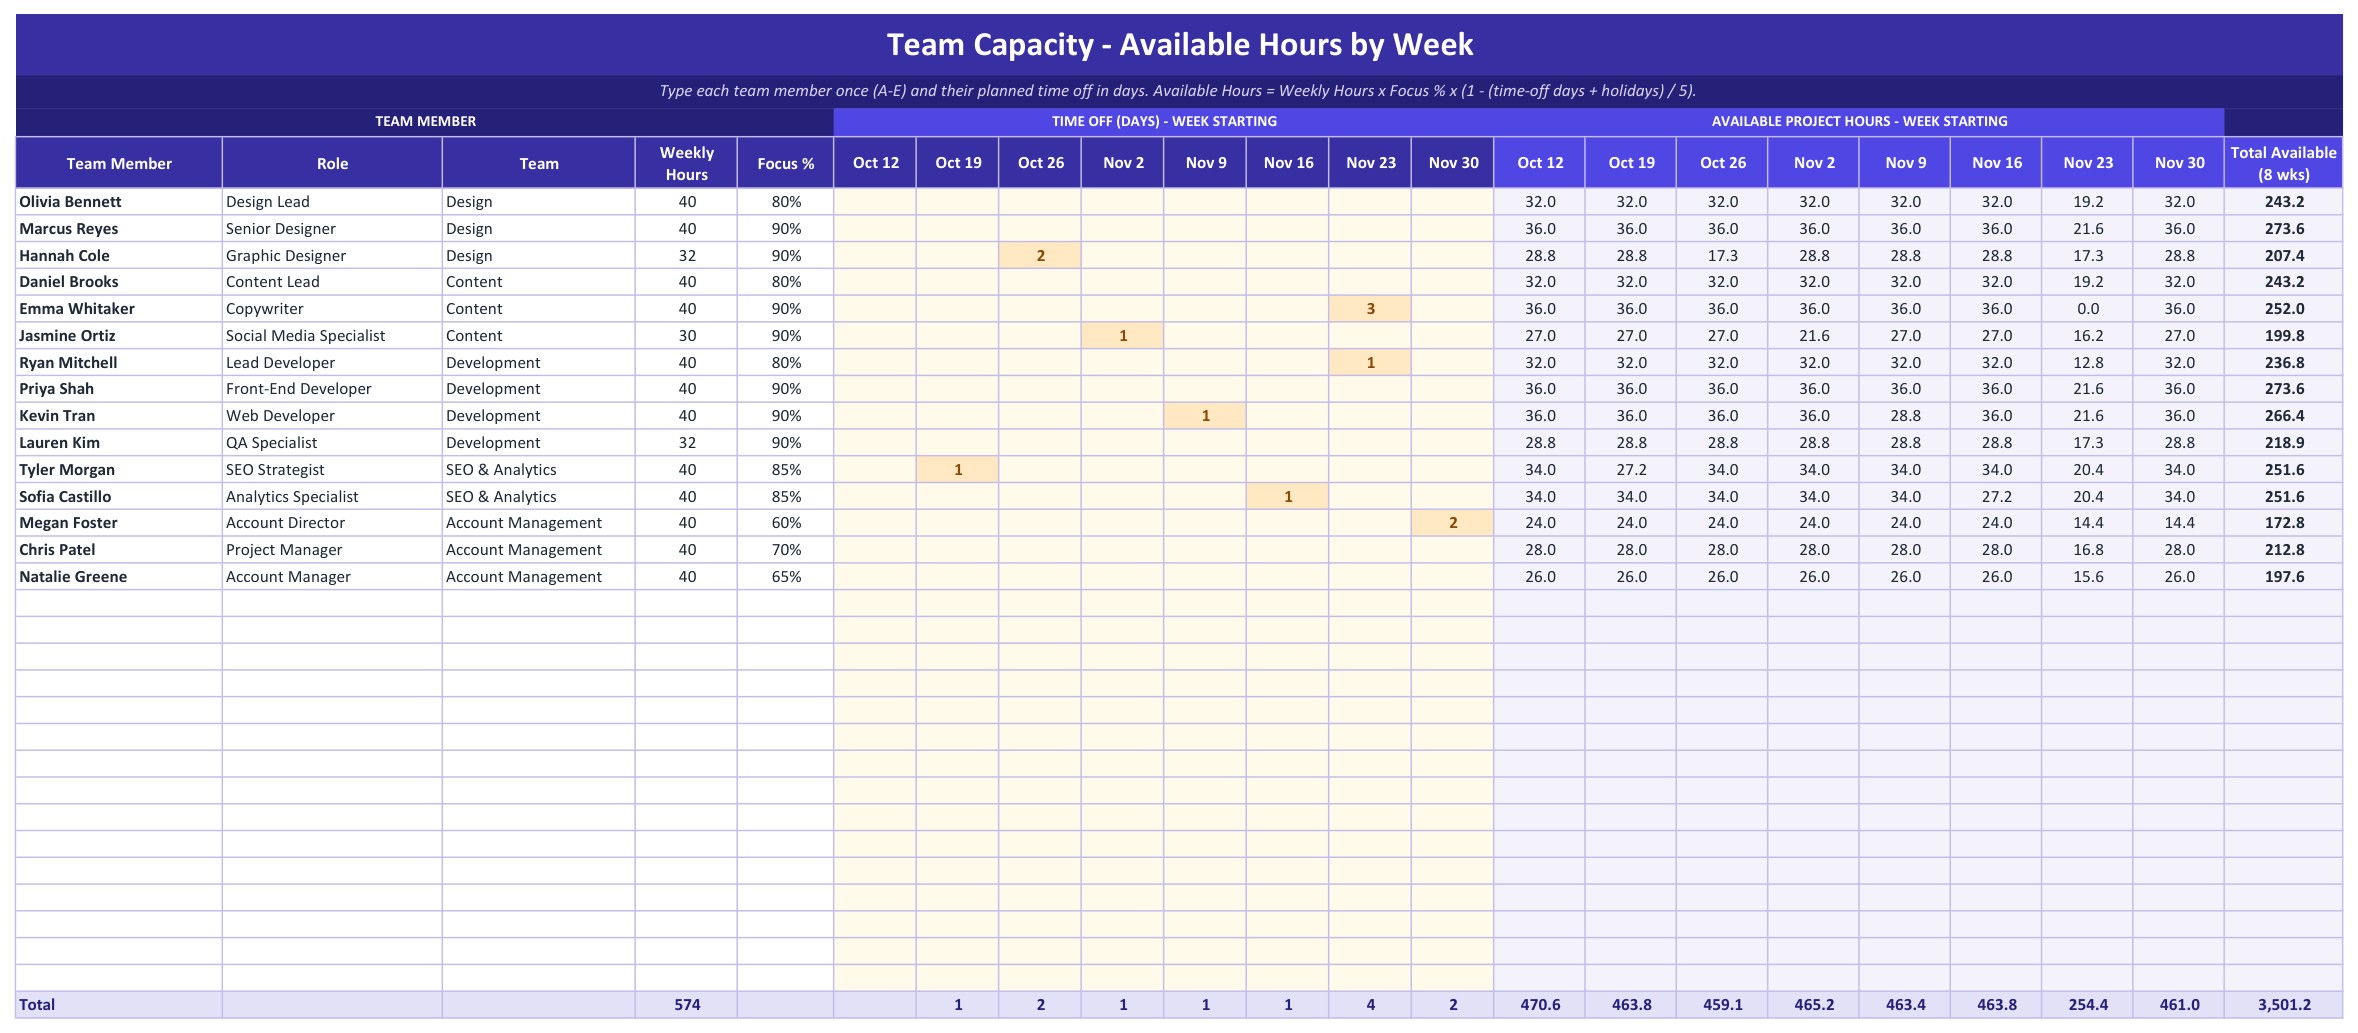
List each person once with the role, team, weekly hours and focus %, the share of the week left for project work after meetings and admin. In the middle you type planned time off in days for each week. On the right the tracker calculates the available project hours, with company holidays taken out. Two days off for one person lowers that person’s capacity for the week right away.
Workload Summary
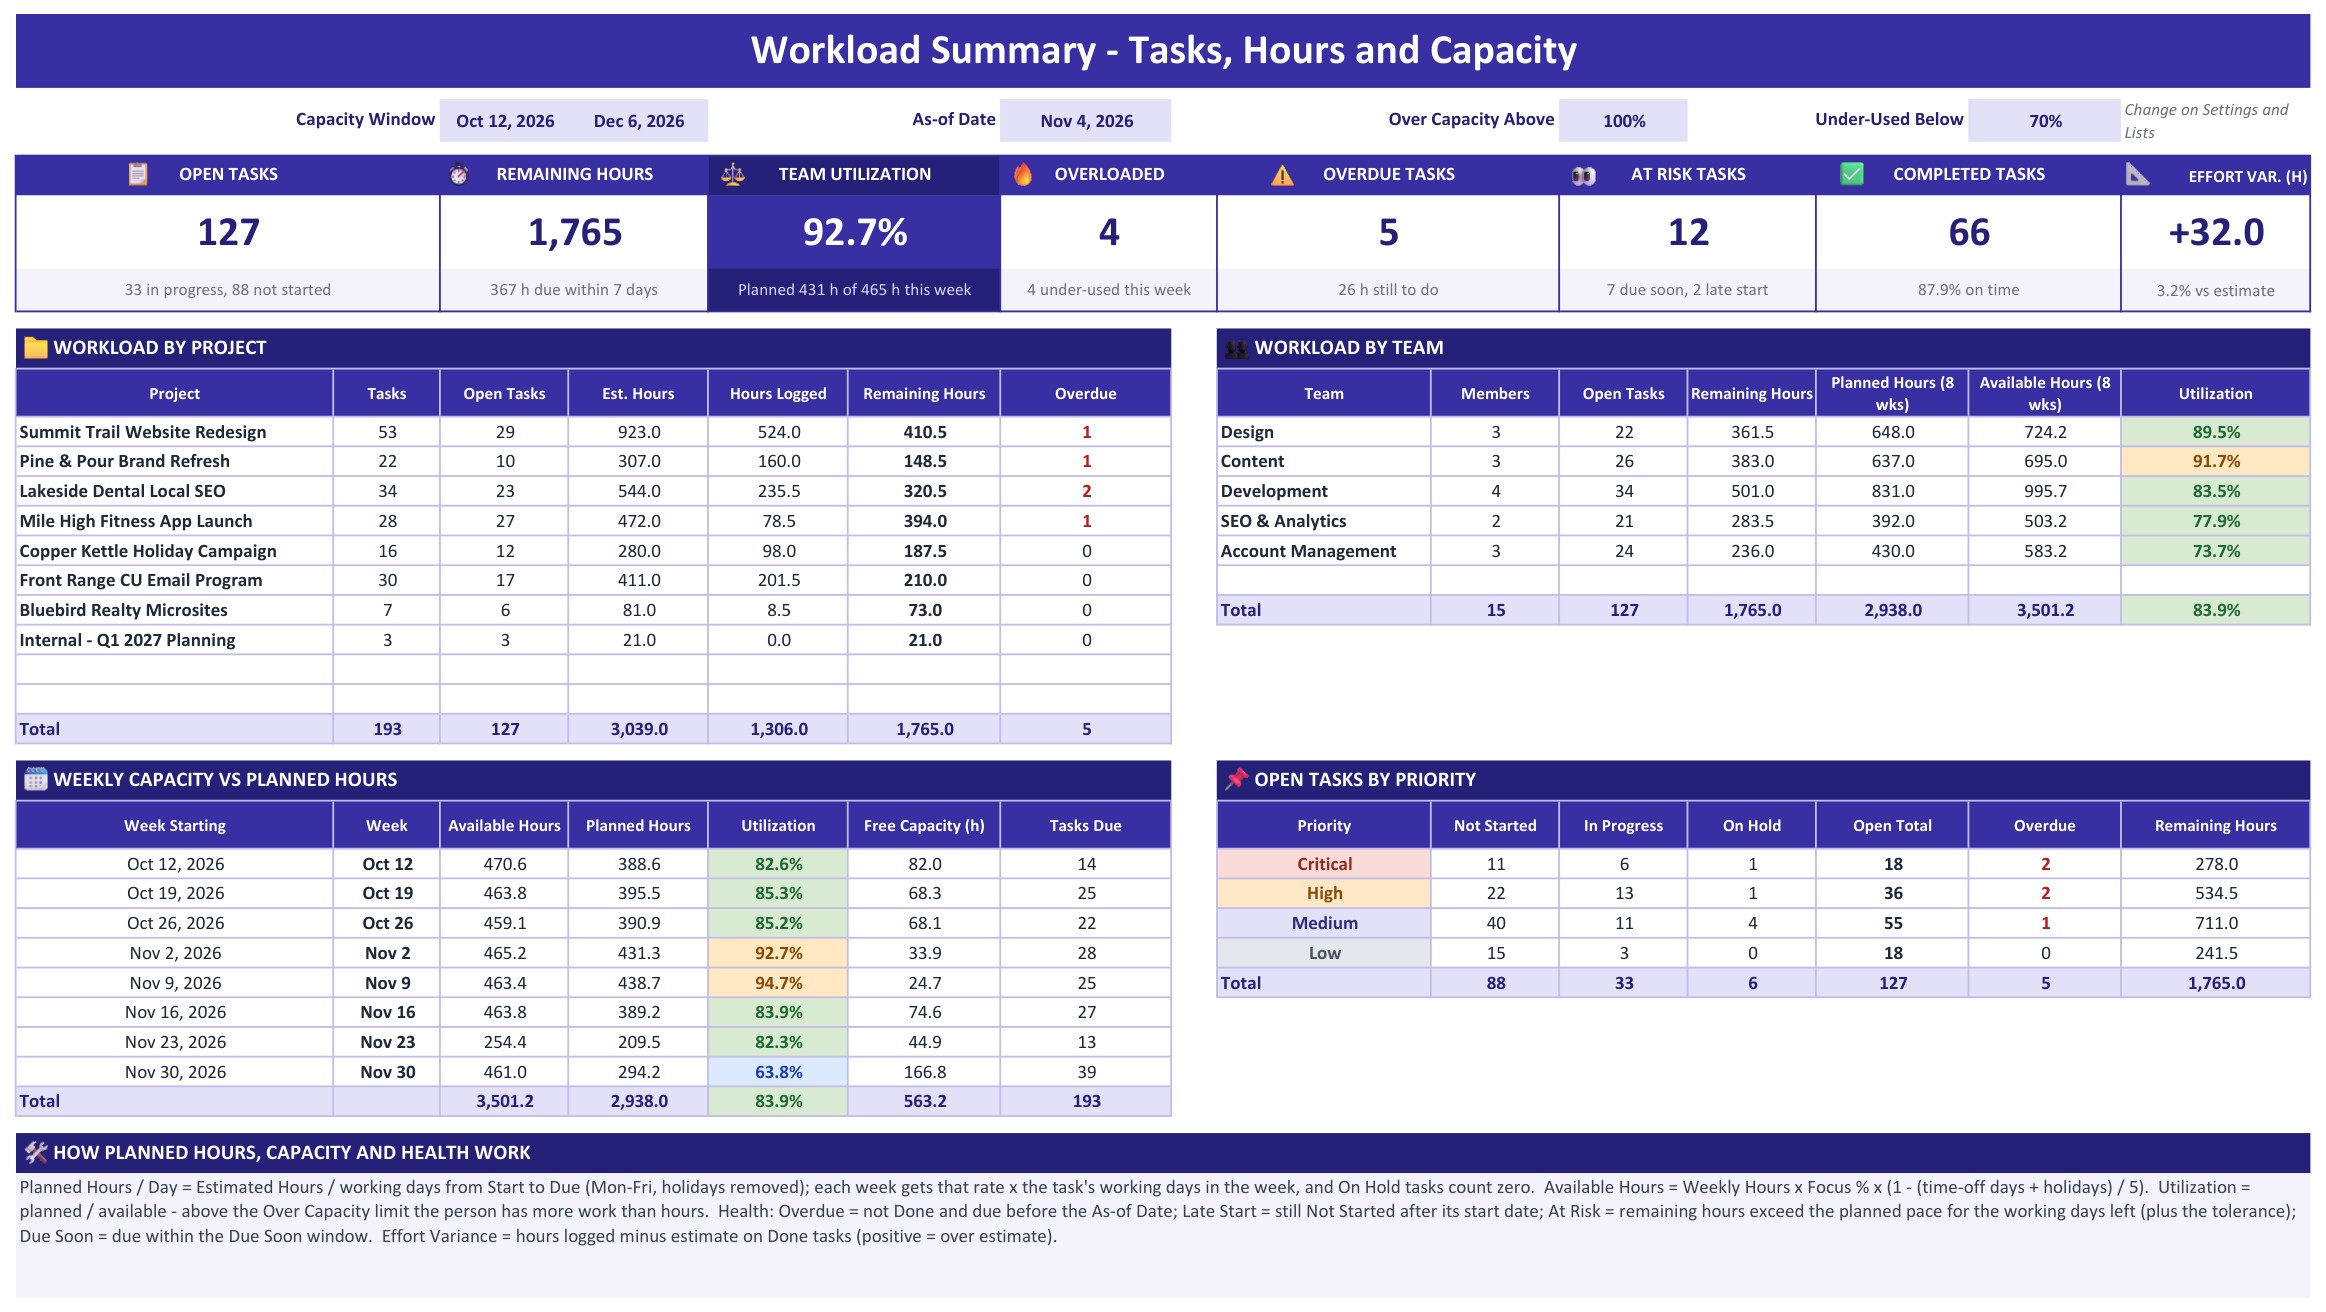
Eight KPI tiles show Open Tasks, Remaining Hours, Team Utilization, Overloaded people, Overdue Tasks, At Risk Tasks, Completed Tasks with the share done on time, and Effort Variance. Below them are the workload by project, the workload by team, the weekly capacity vs planned hours with free capacity, and the open tasks by priority.
Settings and Lists
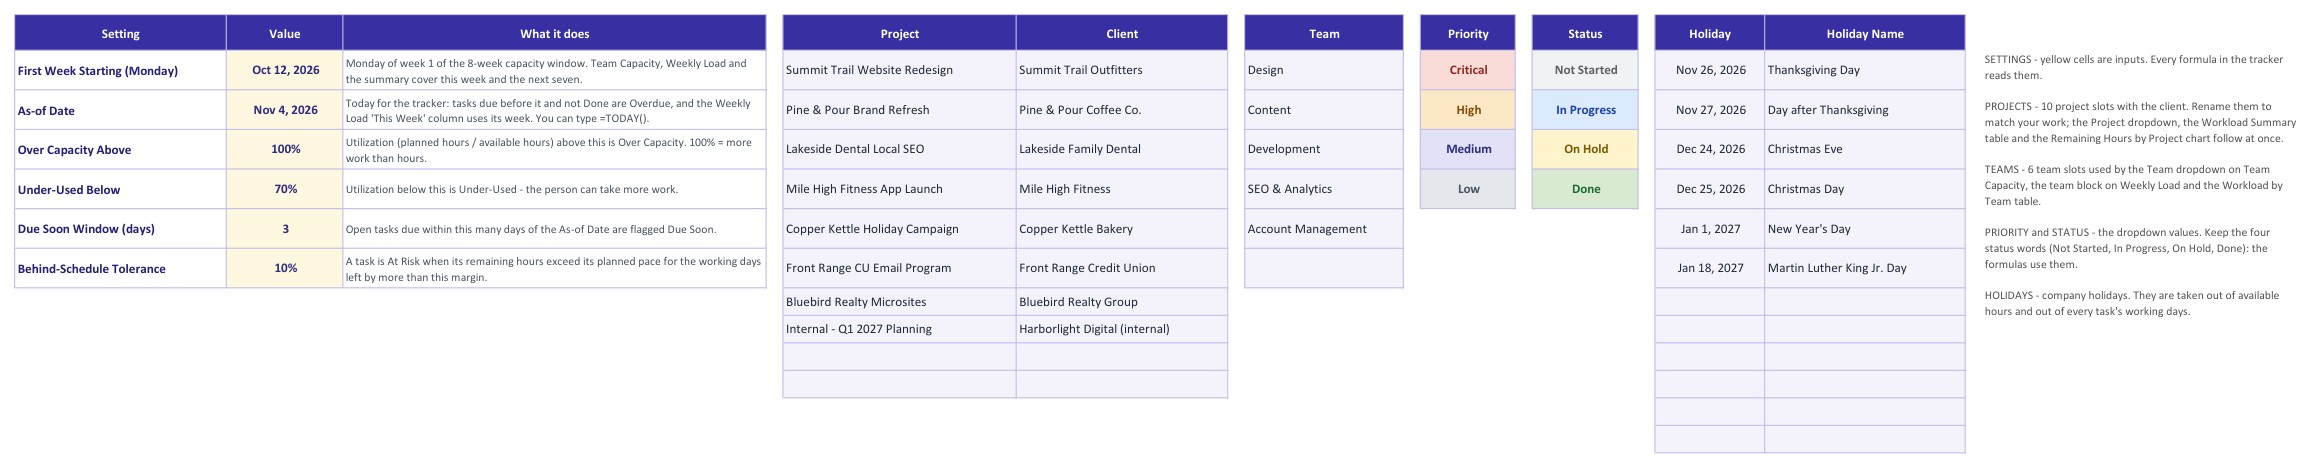
Set the first week, the as-of date, the over capacity limit, the under used limit, the due soon window in days and the behind schedule tolerance. Rename the projects with their clients, the teams, the priorities and the statuses, and list your company holidays. Every dropdown and formula reads these cells.
Instructions
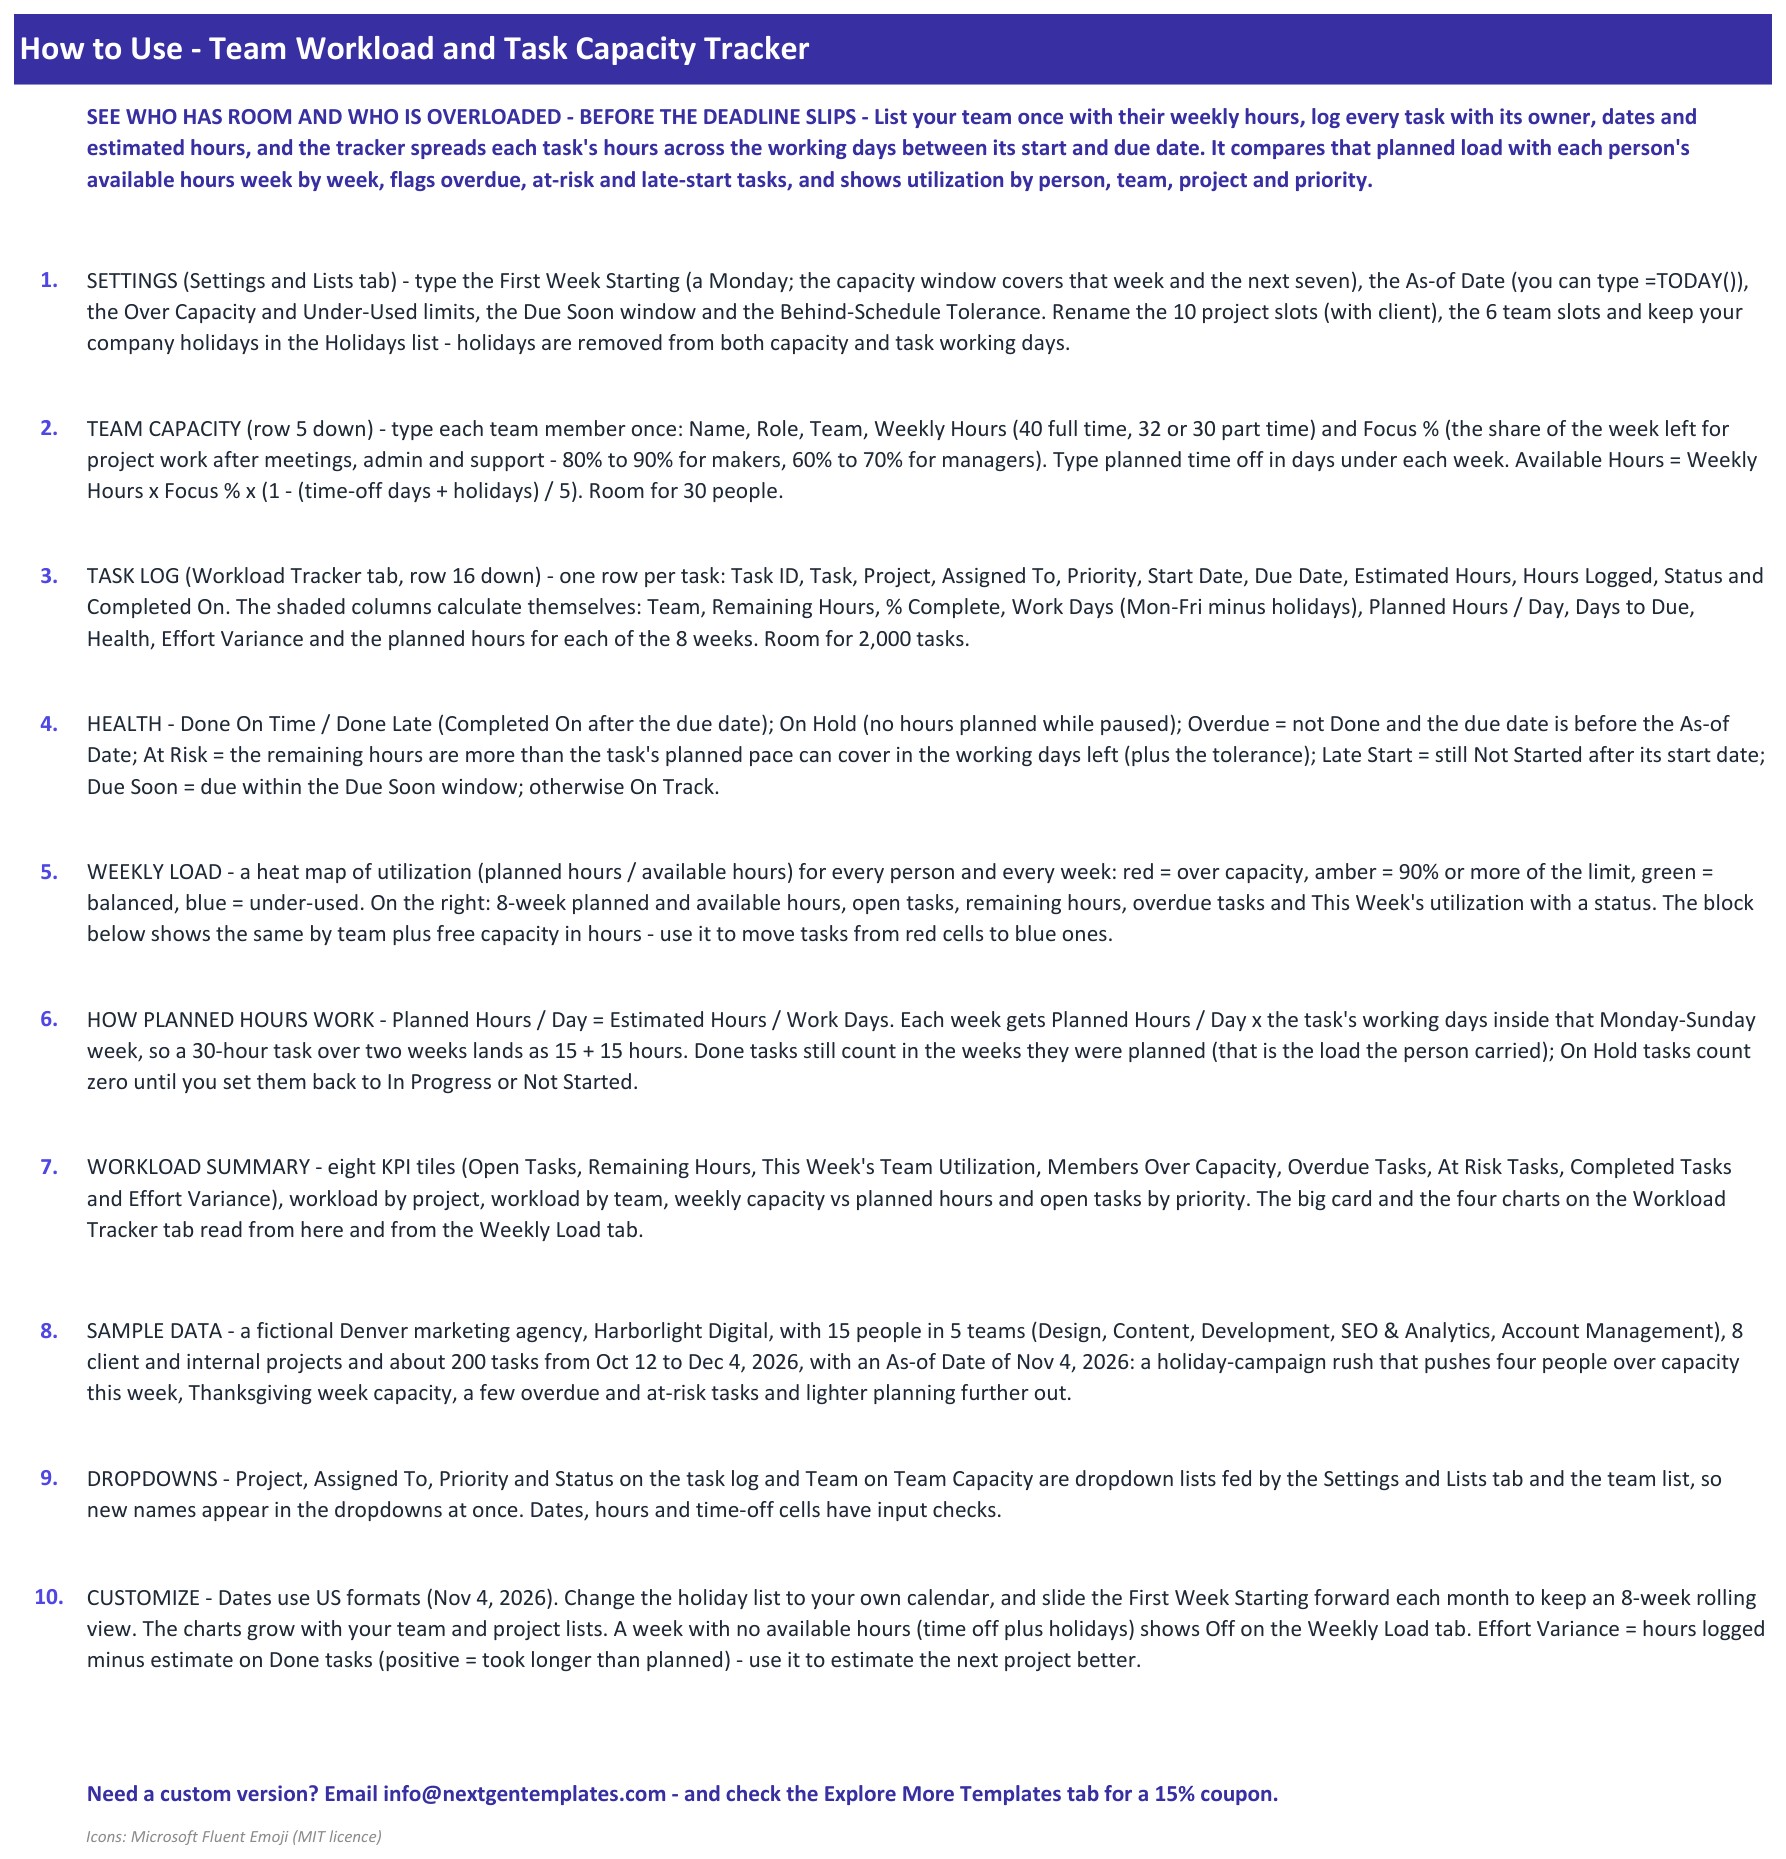
A step by step guide to setting up the file, logging tasks, reading the heat map and understanding how planned hours, capacity and health are worked out.
Who Is It For?
Use it as a team workload tracker in Excel for simple resource capacity planning. Team leads, agency owners, project managers and department heads who assign work every week and want to see who has room before they hand out the next task. It suits marketing agencies, software and design teams, consultancies and internal departments that already list their tasks with an owner, dates and estimated hours. The sample data is a fictional Denver marketing agency with 15 people in 5 teams and 193 tasks, with an as-of date of November 4, 2026.
How to Use
- Download the ZIP and open the Excel workbook in desktop Excel.
- On the Settings and Lists tab set the first week, which should be a Monday, the as-of date, the limits and your holidays, then rename the projects, teams, priorities and statuses.
- On the Team Capacity tab list each person once with the role, team, weekly hours and focus %, and type planned time off in days.
- Add one row per task on the Workload Tracker with the owner, dates, estimated hours, hours logged and status.
- Open the Weekly Load tab to find who is over capacity and who has free hours, then the Workload Summary for the team view.
Comparison
| Feature | This template | Blank task list |
|---|---|---|
| Planned hours spread over eight weeks | Calculated for every task | Manual |
| Available hours after time off and holidays | Calculated per person | Manual |
| Utilization heat map by person and week | Built in | Build yourself |
| Task health flags and effort variance | Built in | Manual |
| Macros or add-ons needed | None | None |
| Live link to a time clock or project tool | No | No |
Frequently Asked Questions
How does the tracker work out utilization?
Utilization is the planned hours divided by the available hours for each person and week. Planned hours come from the task log. Each task’s estimated hours are spread over its working days between the start date and the due date, with company holidays removed. Available hours are the weekly hours times the focus % minus time off and holidays.
How do I see who has room for another task?
Open the Weekly Load tab. Blue cells are under used and the free capacity row shows the hours left for the whole team. Move a task from a red cell to a blue one.
What do the health flags mean?
Done On Time and Done Late compare the completed date with the due date. On Hold tasks are paused. Overdue means not done and past the due date. Late Start means not started after the start date. At Risk means the remaining hours exceed what the plan can carry in the working days left. Due Soon means due within the window you set, and everything else is On Track.
Can I change the projects, teams and priorities?
Yes. The Settings and Lists tab holds the project, team, priority and status lists. Rename them and the dropdowns follow.
How many tasks does it hold?
The task log has room for 2,000 tasks. The sample has 193.
Does it include a Google Sheets version?
This listing is the Excel edition. It is a macro free .xlsx workbook that opens in desktop Excel.
Does it need macros or add-ons?
No. It uses formulas, dropdowns and charts only.
Get the Template
Download the Team Workload and Task Capacity Tracker in Excel and see who has room before you assign the next task. For a simple task list, see the Task Management Monitoring Template in Excel, or browse all Excel templates.












Reviews
There are no reviews yet.