


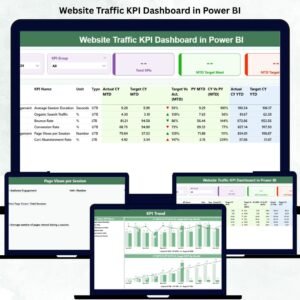
The Website Traffic KPI Dashboard in Power BI helps businesses transform complex web analytics data into clear, actionable insights. Built for marketers, analysts, and website owners, it tracks every key performance indicator — from visitor behavior and traffic sources to conversions and engagement — all in one interactive, easy-to-use platform.
Instead of switching between Google Analytics, Excel sheets, and reports, this ready-to-use Power BI template consolidates your website metrics into a single dashboard with dynamic slicers, clean visuals, and automatic KPI tracking.
Whether you manage an e-commerce store, a content-driven platform, or a corporate website, this dashboard empowers you to make faster, smarter, data-driven decisions that improve traffic quality, user engagement, and ROI.
✨ Key Features of the Website Traffic KPI Dashboard in Power BI
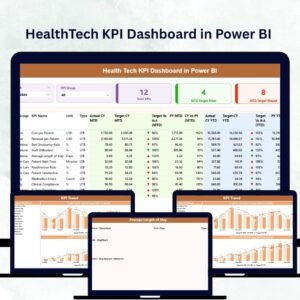
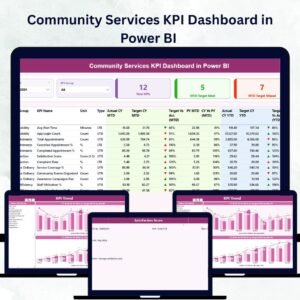
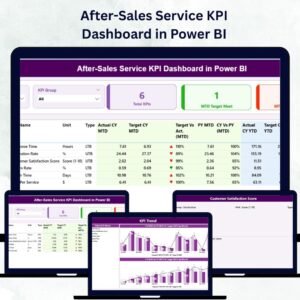
✅ 📊 Summary Page – Your Central Control Hub
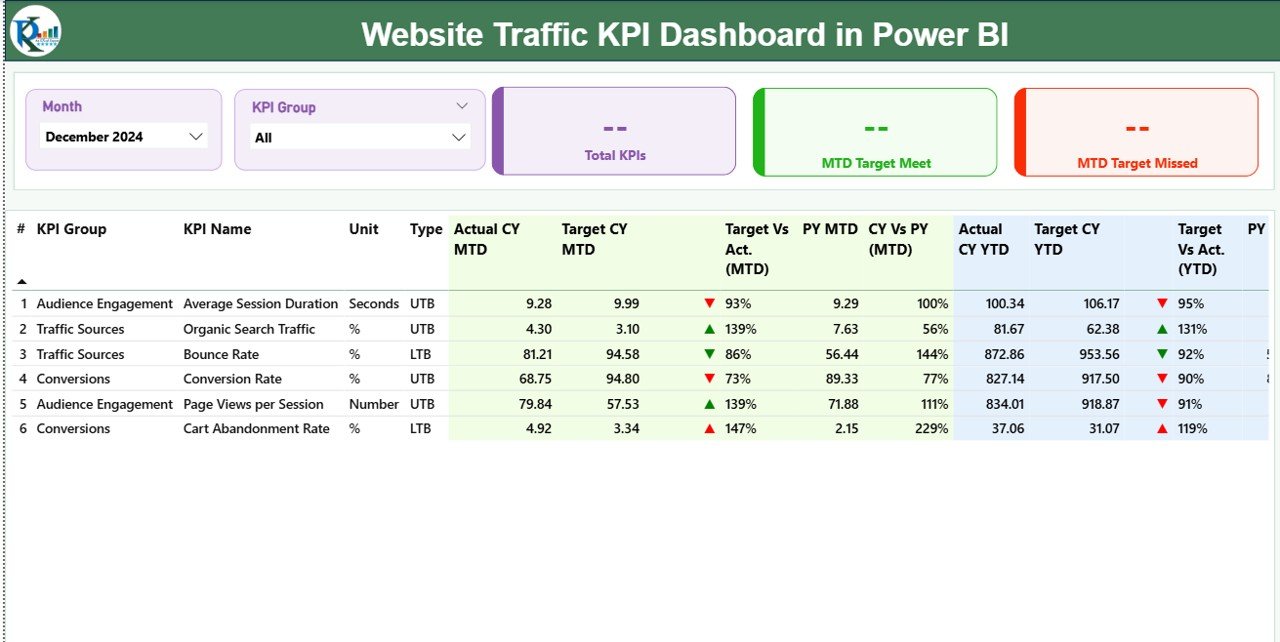
The main performance overview displays all your website KPIs at a glance.
-
Slicers: Filter by Month and KPI Group (Traffic / SEO / Engagement / Conversion).
-
KPI Cards: Total KPIs Count | MTD Target Met | MTD Target Missed.
-
Detailed Table: Shows Actual vs Target, MTD vs YTD, and CY vs PY comparisons for each KPI.
💡 Identify trends instantly — see which KPIs are performing above or below target.
✅ 📈 KPI Trend Page – Visual Performance Tracking
Two interactive combo charts display:
-
MTD Actual vs Target vs Previous Year
-
YTD Actual vs Target vs Previous Year
🧭 Use the KPI Name slicer to analyze specific metrics such as Bounce Rate %, Page Views, or Conversion Rate over time.
🎯 Spot patterns and seasonal trends to guide future marketing strategies.
✅ 📚 KPI Definition Page – Clear Data Transparency
Drill through from any KPI on the Summary Page to see its:
-
Formula (e.g., Conversions ÷ Visitors × 100)
-
Definition and Purpose
-
Type (UTB / LTB)
This ensures your entire team understands how each metric is calculated and interpreted.
✅ 📊 Excel Integration – Simple Data Management
The dashboard connects to an Excel data source with three structured sheets:
-
Input_Actual – Current performance data (MTD & YTD).
-
Input_Target – Target values for each KPI.
-
KPI Definition – Formulas, Units, and KPI Metadata.
🔄 Update your Excel file and refresh Power BI — all visuals update instantly.
📦 What’s Inside the Website Traffic KPI Dashboard
📁 Three Analytical Pages:
1️⃣ Summary Page – Overall website performance snapshot.
2️⃣ KPI Trend Page – Analyze MTD and YTD performance trends.
3️⃣ KPI Definition Page – View formulas and metric definitions.
🎯 Core KPIs Tracked:
-
Page Views / Unique Visitors
-
Bounce Rate (%)
-
Average Session Duration (Minutes)
-
Conversion Rate (%)
-
Organic vs Paid Traffic Ratio
-
Returning Visitor %
-
Click-Through Rate (CTR)
💡 All KPIs are categorized by Traffic, SEO, Conversion, and Engagement groups.
⚙️ How to Use the Dashboard
1️⃣ Connect your Excel data source.
2️⃣ Refresh the Power BI file to load latest metrics.
3️⃣ Use Month and KPI Group slicers to filter results.
4️⃣ Drill down to individual KPIs for detailed analysis.
5️⃣ Track trends and compare current vs previous performance.
6️⃣ Share the report via Power BI Service for team access.
💡 Pro Tip: Schedule automatic refreshes to keep your data real-time and decision-ready.
👥 Who Can Benefit from This Dashboard
💻 Digital Marketing Teams – Track campaign impact and conversion trends.
📈 SEO Analysts – Monitor organic traffic growth and keyword effectiveness.
🛒 E-Commerce Managers – Analyze visitor behavior and checkout conversion.
🧠 Content Strategists – Identify which content drives highest engagement.
🏢 Business Owners & Executives – Get a clear view of digital performance in minutes.
This Power BI template brings clarity and speed to web analytics — helping you optimize marketing spend and maximize ROI.


Reviews
There are no reviews yet.