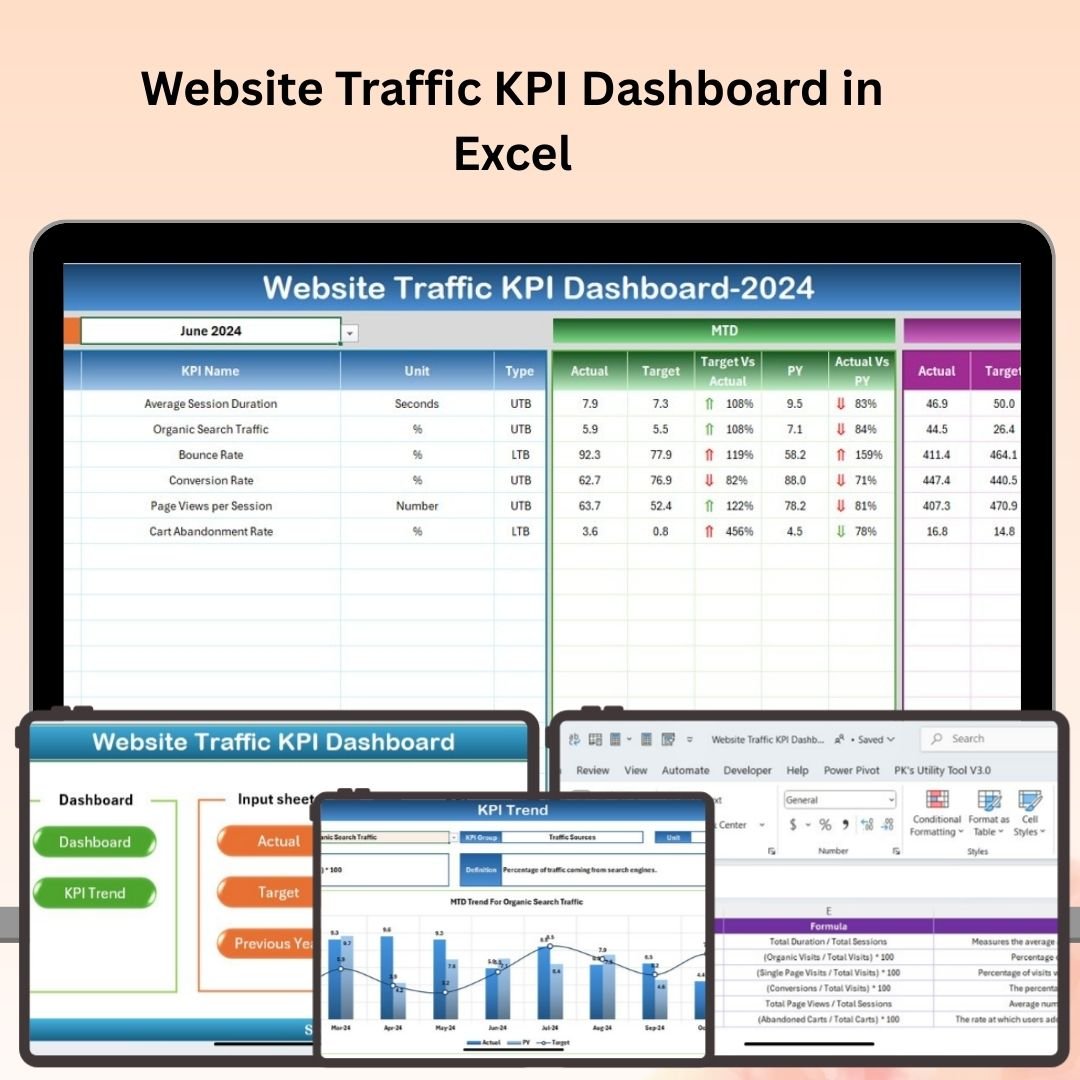


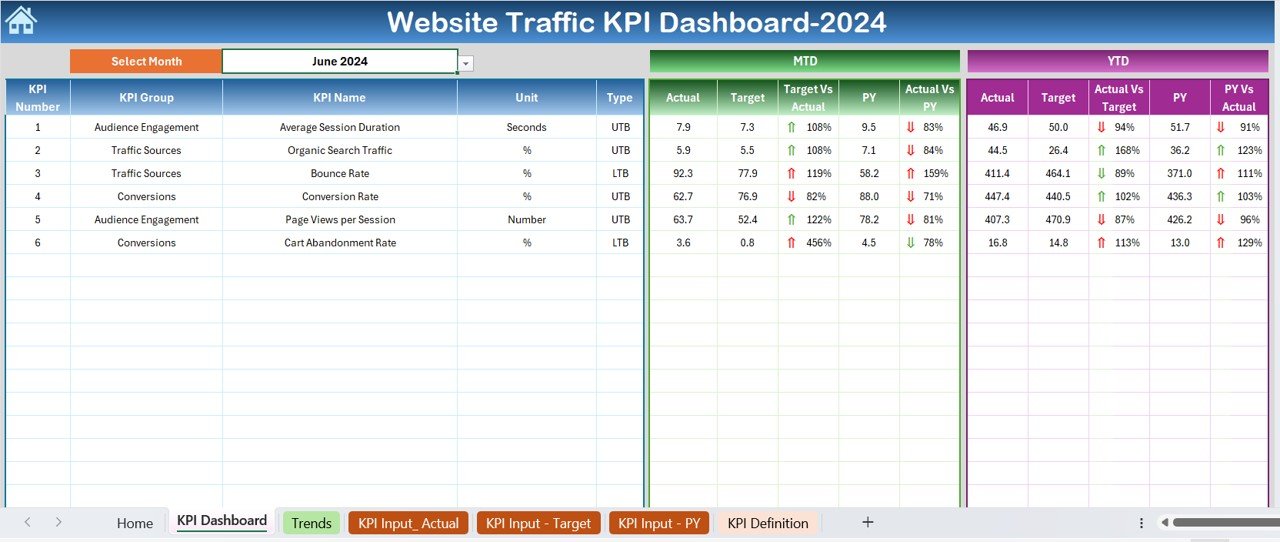
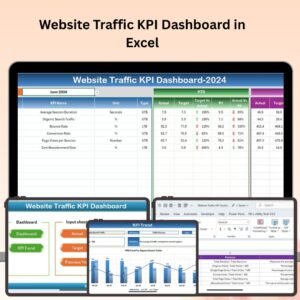
The Website Traffic KPI Dashboard in Excel is a powerful tool designed for digital marketers, website managers, and business owners who want to track, analyze, and optimize website performance. This comprehensive Excel dashboard allows you to monitor key performance indicators (KPIs) like website visits, bounce rate, conversion rate, traffic sources, and user engagement, all in one place.
With real-time tracking, interactive charts, and detailed reports, this dashboard helps you gain valuable insights into your website’s performance, identify trends, and optimize your marketing strategies to increase traffic and conversions. Whether you’re managing a blog, e-commerce site, or corporate website, this tool ensures that your site’s performance is always at its best.
Key Features of the Website Traffic KPI Dashboard in Excel:
📊 Comprehensive Traffic Tracking
Monitor essential KPIs like page views, unique visitors, sessions, and bounce rate, giving you a complete overview of your website’s traffic performance.
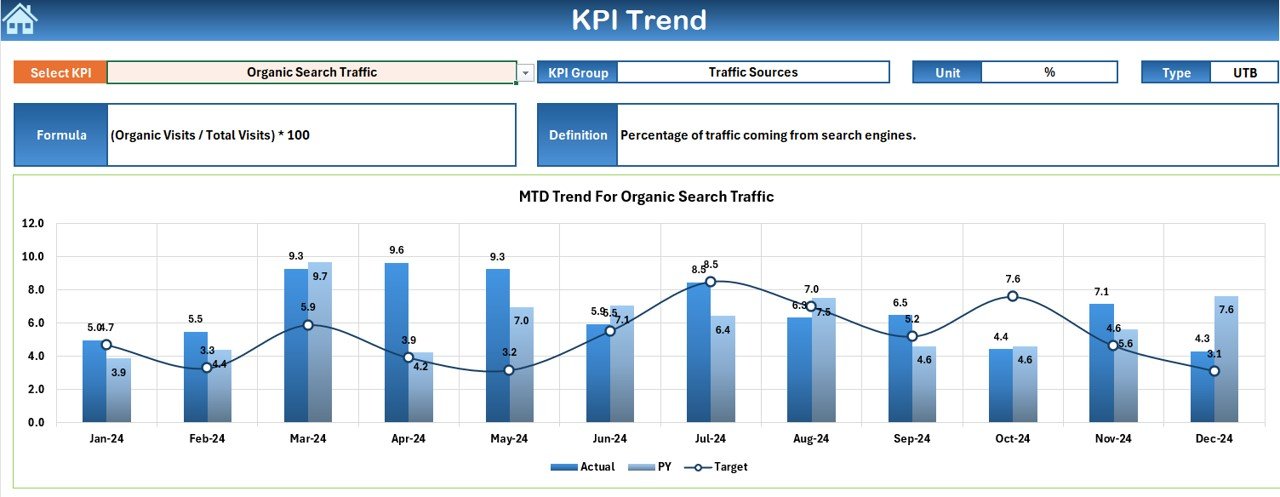
🌐 Traffic Source Analysis
Track where your visitors are coming from, including organic search, paid ads, social media, and direct traffic. Analyze which sources are driving the most traffic to your website.
🔄 Conversion Rate Tracking
Monitor your website’s conversion rates, helping you understand how well your website is turning visitors into leads or sales.
📈 User Engagement Metrics
Track metrics like average session duration, pages per session, and user behavior to understand how engaged your visitors are with your content.
📅 Customizable Reporting
Generate tailored reports to present website performance insights to stakeholders, team members, or clients. Use charts and graphs to visualize the data.
🚀 Why You’ll Love the Website Traffic KPI Dashboard in Excel:
✅ Track Website Performance – Monitor key metrics such as traffic, conversion rates, and user engagement to evaluate website performance.
✅ Optimize Traffic Sources – Identify the best-performing traffic sources, allowing you to focus your marketing efforts on the most profitable channels.
✅ Improve Conversion Rates – Track conversion rates and analyze user behavior to optimize your website for better lead generation or sales.
✅ Data-Driven Decision Making – Use real-time insights to make informed decisions about your website and marketing strategies.
✅ User-Friendly – With Excel’s easy-to-use interface, this dashboard is simple to navigate, even for beginners, while providing in-depth analysis for advanced users.
✅ Customizable and Flexible – Tailor the dashboard to suit your specific website goals and key performance metrics, making it perfect for any business type.
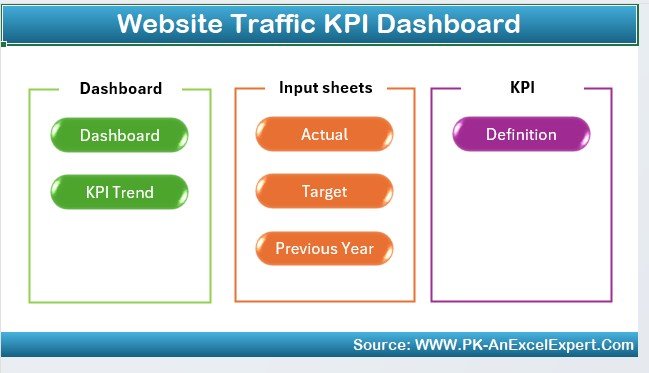
What’s Inside the Website Traffic KPI Dashboard in Excel:
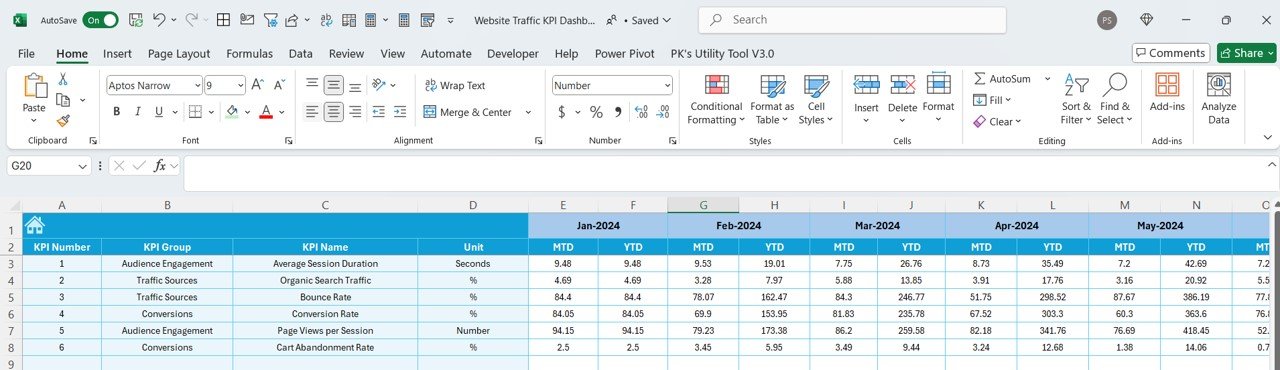
- Website Traffic Metrics: Track essential traffic metrics such as sessions, page views, bounce rate, and unique visitors to monitor overall website performance.
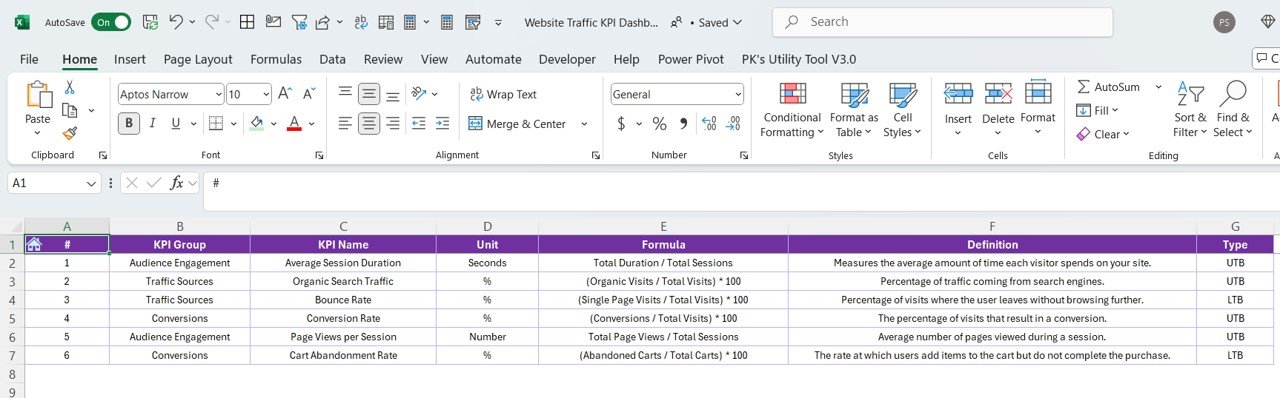
- Traffic Source Breakdown: Monitor traffic from different sources like organic search, paid ads, social media, and direct traffic to see which channels are performing best.
- Conversion Rate Tracker: Measure how well your website is converting visitors into leads, customers, or other desired actions.
- User Engagement Insights: Track key engagement metrics like average session duration and pages per session to understand how visitors are interacting with your site.
- Customizable Charts and Reports: Create reports and visualizations based on your chosen KPIs to help you communicate website performance insights effectively.
How to Use the Website Traffic KPI Dashboard in Excel:
1️⃣ Download the Template – Instantly access your Excel file upon purchase.
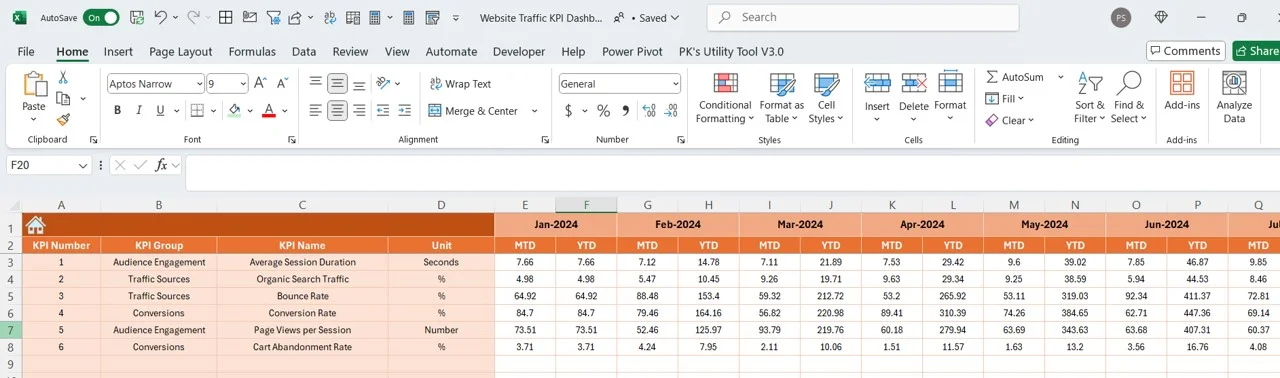
2️⃣ Input Traffic Data – Enter your website data such as sessions, page views, bounce rate, and traffic sources into the dashboard.
3️⃣ Track KPIs – Monitor key metrics like conversion rates, user engagement, and traffic sources to track your website’s performance.
4️⃣ Analyze Trends – Use the dashboard’s interactive charts to analyze trends in traffic, conversion, and user behavior.
5️⃣ Generate Reports – Create customized reports and share them with stakeholders to present website performance insights.
Who Can Benefit from the Website Traffic KPI Dashboard in Excel:
- Digital Marketers
- Website Managers
- Business Owners
- Content Creators and Bloggers
- E-commerce Managers
- Social Media Managers
- Data Analysts
- SEO and PPC Managers
The Website Traffic KPI Dashboard in Excel is the ideal tool for anyone looking to track, analyze, and optimize website performance. With real-time tracking and easy-to-read reports, it helps you monitor traffic, improve user engagement, and maximize conversions to ensure that your website achieves its full potential.
Click here to read the Detailed blog post
https://www.pk-anexcelexpert.com/website-traffic-kpi-dashboard-in-excel/
Visit our YouTube channel to learn step-by-step video tutorials
Youtube.com/@PKAnExcelExpert


Reviews
There are no reviews yet.