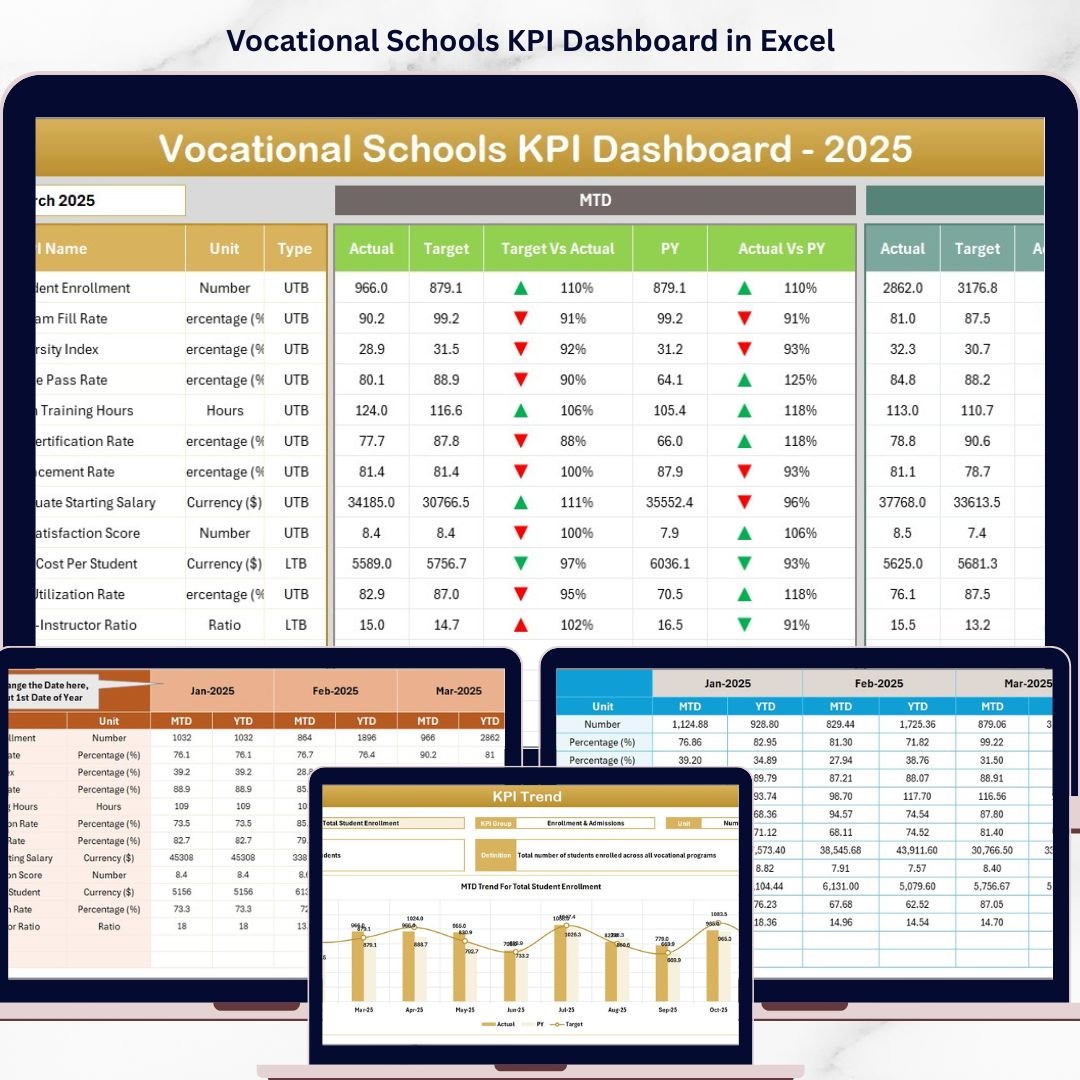
Key Features of Vocational Schools KPI Dashboard
Discover the power of data-driven decision-making with our Vocational Schools KPI Dashboard, a comprehensive digital tool designed specifically to help educational institutions monitor, analyze, and improve their key performance indicators (KPIs) efficiently. This dashboard consolidates all vital metrics into one interactive, easy-to-use platform, making it perfect for administrators and educators aiming to optimize school performance.
This dashboard is intelligently divided into 7 interactive worksheets that streamline your data tracking and reporting processes:
- 🏠 Home Sheet: Acts as a centralized index with 6 navigation buttons, allowing instant access to all other sheets for seamless workflow management.
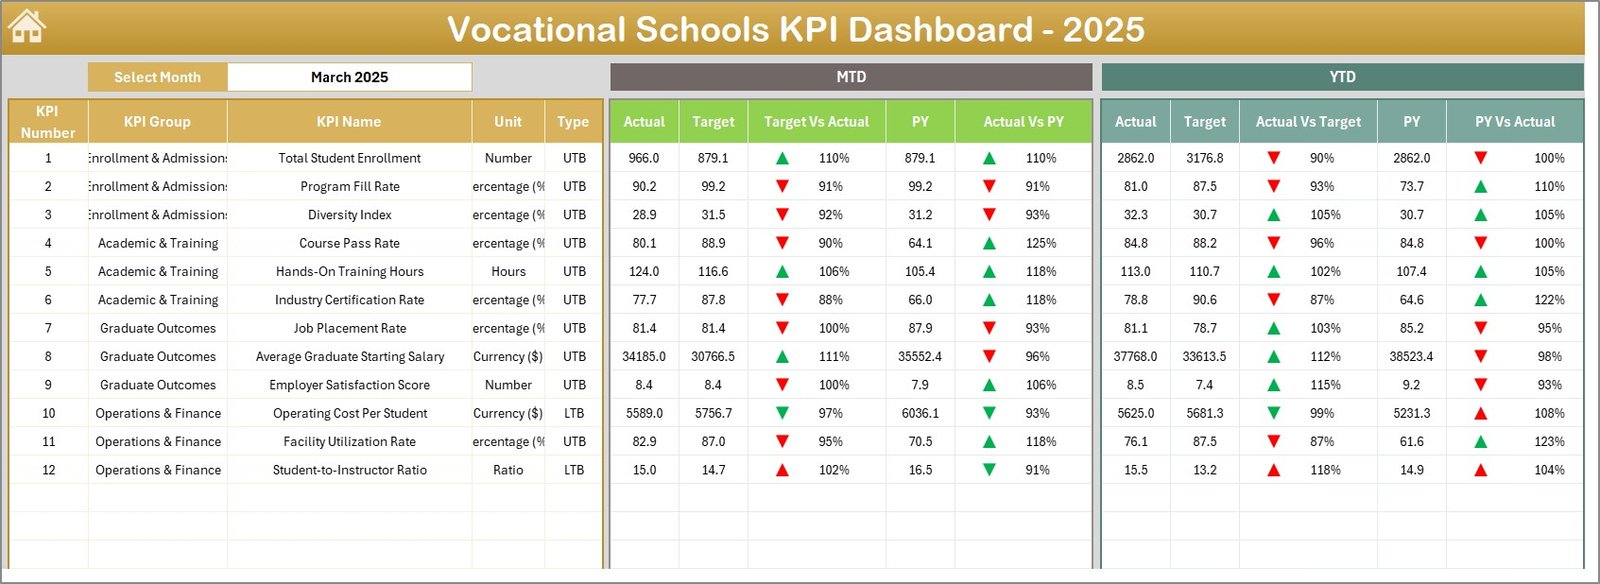
- 📊 Dashboard Sheet: The heart of the dashboard, showcasing all KPIs with dynamic month selection via a drop-down menu. Instantly view MTD (Month-To-Date) and YTD (Year-To-Date) actuals, targets, and previous year data accompanied by intuitive conditional formatting with up/down arrows for quick performance insights.
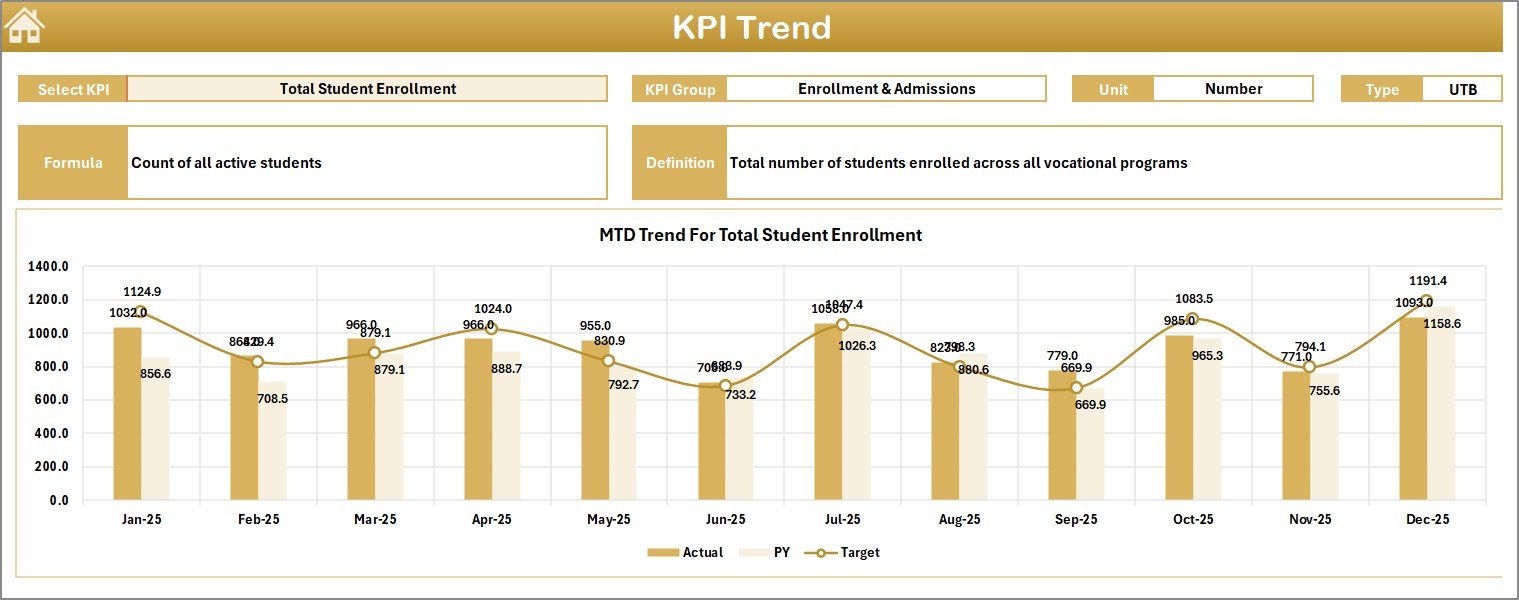
- 📈 KPI Trend Sheet: Dive deeper into individual KPIs by selecting any KPI name from the drop-down. Understand trends with detailed charts comparing actual vs. target and previous year data, along with KPI definitions, formulas, and types (Lower The Better or Upper The Better).
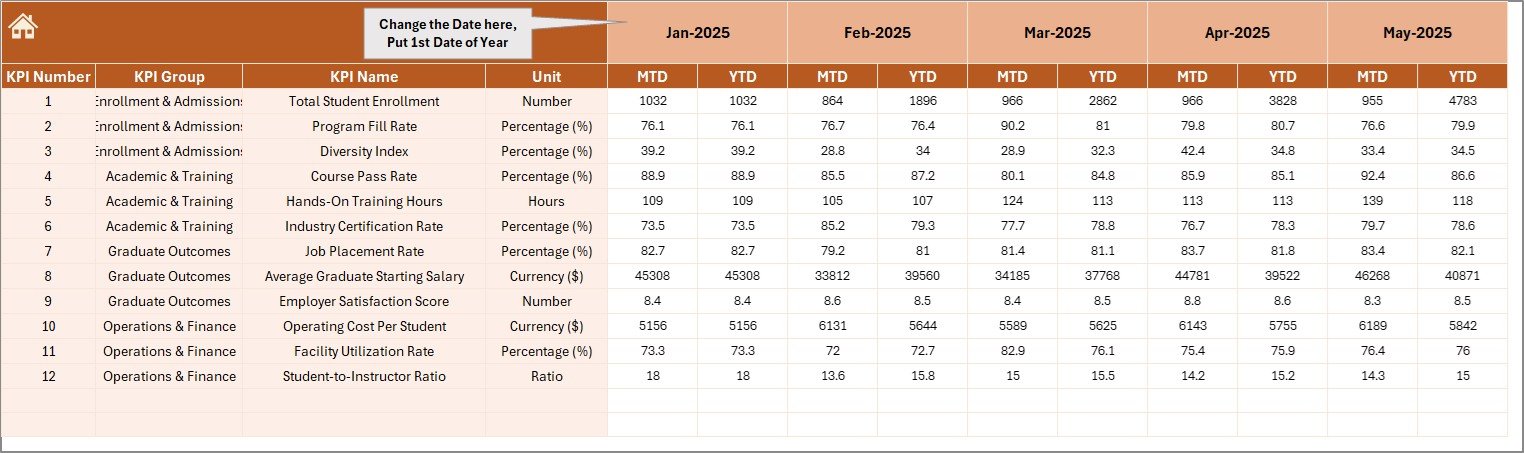
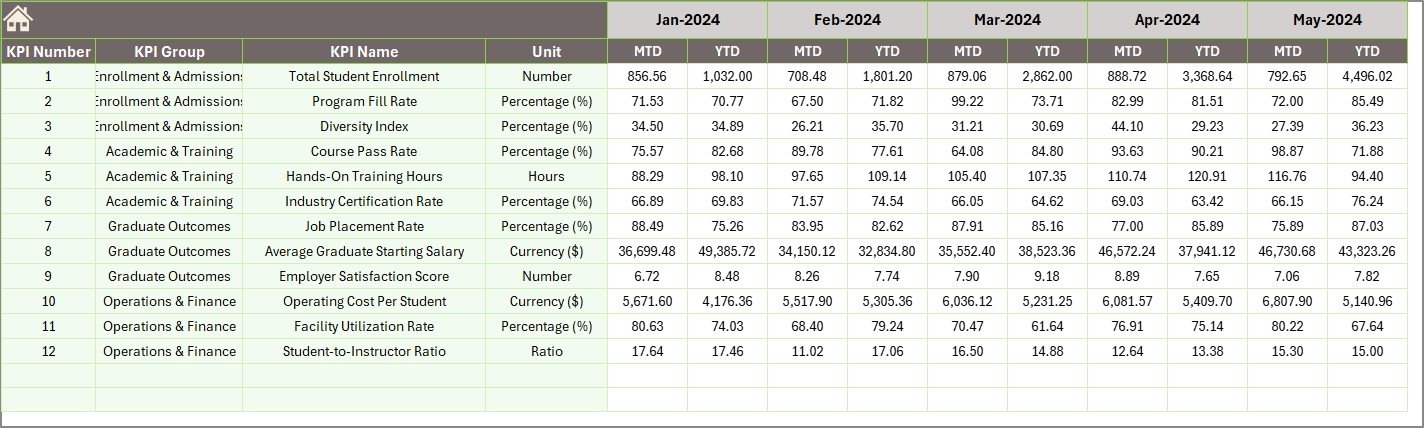
- ✍️ Actual Numbers Input Sheet: Easily input the actual numbers for MTD and YTD, with flexibility to adjust the month starting point.
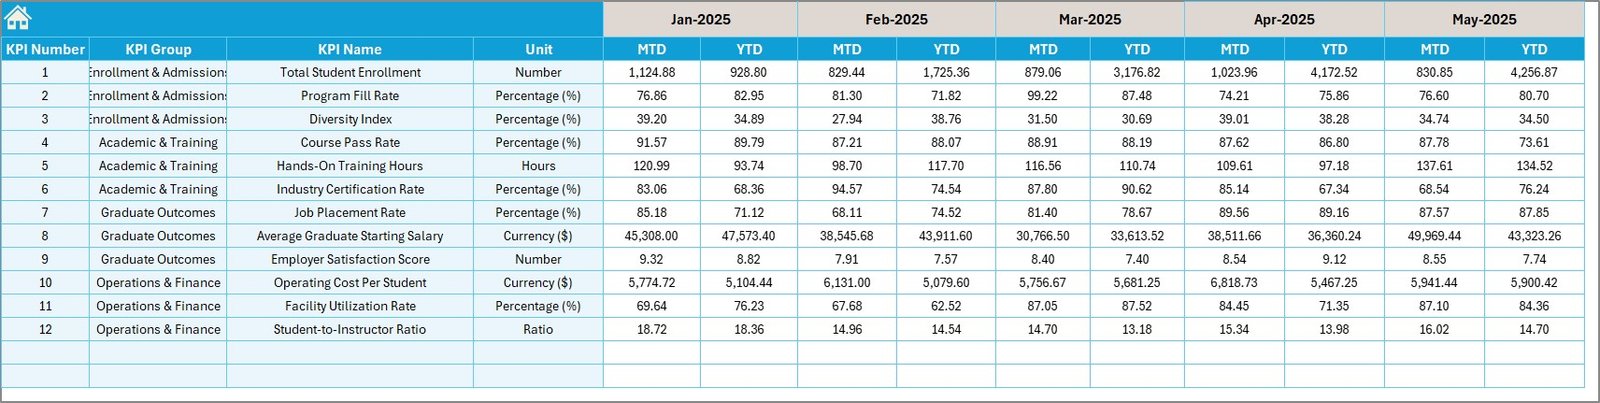
- 🎯 Target Numbers Input Sheet: Set and adjust your target values monthly for all KPIs, helping you stay focused on goals.
- 📅 Previous Year Numbers Sheet: Record prior year data to benchmark current performance effectively.
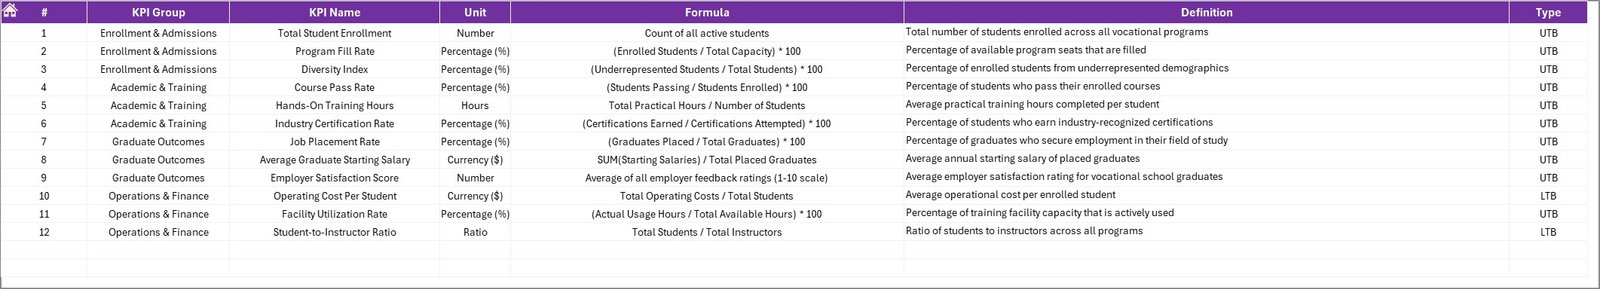
- 📚 KPI Definition Sheet: Maintain a clear and comprehensive KPI repository including names, groups, units, formulas, and KPI types, ensuring consistent understanding across your team.
What’s Inside the Vocational Schools KPI Dashboard
Our Vocational Schools KPI Dashboard is a fully digital, ready-to-use Excel-based tool designed for seamless integration into your existing workflow. It includes:
- 📁 7 Organized Worksheets: Each sheet has a dedicated purpose ensuring clarity and ease of use.
- 🔄 Dynamic Month Selection: Customize your reports instantly for any month with drop-down menus.
- 🎨 Conditional Formatting: Visual cues like up/down arrows make performance tracking intuitive at a glance.
- 📊 Trend Analysis Charts: Visualize KPI progress and compare actuals to targets and previous years.
- 📝 Input Fields for Actuals, Targets & Previous Data: Simple data entry points allow for continuous updates and monitoring.
- 📖 Comprehensive KPI Definitions: Understand each KPI’s context and calculation method clearly.
How to Use the Vocational Schools KPI Dashboard
Getting started with the Vocational Schools KPI Dashboard is straightforward and user-friendly. Follow these steps:
- 🚀 Step 1: Open the Dashboard. Start with the Home Sheet to navigate across different sections quickly.
- 🗓️ Step 2: Select the Month. Use the drop-down on the Dashboard sheet to pick the month you want to analyze.
- ✍️ Step 3: Input Data. Enter actual, target, and previous year numbers into their respective input sheets.
- 📊 Step 4: Analyze KPIs. Review the Dashboard sheet’s summary numbers and conditional formatting for quick insights.
- 📈 Step 5: Explore Trends. Use the KPI Trend sheet to deep dive into specific KPIs and observe historical performance patterns.
- 📚 Step 6: Maintain KPI Definitions. Keep your KPI definitions updated in the dedicated sheet to ensure clarity and consistency.
This dashboard is designed to be intuitive even for users with basic Excel knowledge, enabling you to focus on strategic decision-making rather than complicated data handling.
Who Can Benefit from This Vocational Schools KPI Dashboard
The Vocational Schools KPI Dashboard is an essential tool for a wide variety of stakeholders within educational institutions, including:
- 🎓 School Administrators: Gain real-time insights into school performance and identify areas for improvement.
- 📋 Vocational School Directors: Monitor targets versus actuals to ensure institutional goals are met.
- 📊 Data Analysts & Educational Planners: Analyze trends and prepare comprehensive reports with ease.
- 👩🏫 Teachers & Department Heads: Understand KPIs related to their departments to align efforts and strategies.
- 📈 Education Consultants: Support clients with detailed performance dashboards tailored to vocational education.
Whether you are managing a large vocational school or a network of institutions, this dashboard empowers you to make data-driven decisions that enhance operational efficiency and educational outcomes.


Reviews
There are no reviews yet.