



In today’s competitive veterinary industry, success isn’t just about quality care — it’s about tracking performance with precision. 🩺🐶
The Veterinary Services KPI Dashboard in Excel is your all-in-one solution to monitor, analyze, and improve clinical, financial, and operational performance.
Built for veterinary clinics, hospitals, and multi-location service providers, this interactive Excel template simplifies complex data into beautiful visuals and actionable insights. 📊
From patient outcomes to profit margins, this dashboard helps you make smarter, data-driven decisions that improve both animal care and business efficiency.
⚙️ Key Features of Veterinary Services KPI Dashboard in Excel
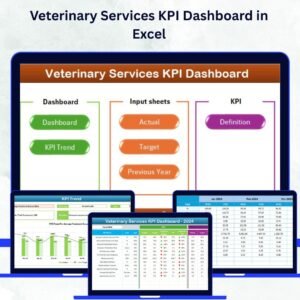
📋 7 Organized Worksheet Tabs – Home, Dashboard, KPI Trend, Actual, Target, Previous Year, and KPI Definition sheets for complete management.
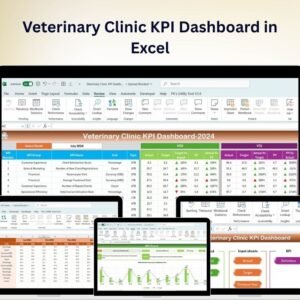
📈 Interactive Dashboard – View real-time Month-to-Date (MTD) and Year-to-Date (YTD) metrics with one click.
📅 Smart Month Selector – Instantly update all visuals for your selected reporting month.
🟢 Conditional Icons – Green ▲ for achieved targets, Red ▼ for underperformance.
📊 MTD vs YTD vs PY Comparison – Track progress and year-over-year performance.
💡 Dropdown-Based Navigation – User-friendly Home sheet with clickable buttons.
🔢 Comprehensive KPI Library – Covers clinical, operational, and financial KPIs.
📤 Customizable and Scalable – Add or edit KPIs to match your clinic’s needs.
💰 Cost-Effective Solution – Built entirely in Excel — no Power BI or macros needed!
📦 What’s Inside the Veterinary KPI Dashboard

1️⃣ Home Sheet
Your command center! 🏠 Navigate seamlessly to different sections (Dashboard, KPI Trend, Target, etc.) with one click.
2️⃣ Dashboard Sheet
The visual heart ❤️ of the system. Choose a month (cell D3) to automatically refresh all KPI charts and cards.
View MTD and YTD performance side-by-side — Actual, Target, and Previous Year — with instant red/green feedback icons.
3️⃣ KPI Trend Sheet
Dive deeper into performance over time. 📉
Select a KPI name (cell C3) to see trend charts for MTD, YTD, and PY data, along with KPI details like formula, group, and unit.
4️⃣ Actual Numbers Input Sheet
Enter monthly data in a simple, structured format. Once entered, the dashboard automatically calculates MTD/YTD metrics.
5️⃣ Target Sheet
Define monthly goals for each KPI — track whether your clinic is meeting or missing its objectives. 🎯
6️⃣ Previous Year Numbers Sheet
Maintain a record of last year’s data for trend comparison and growth analysis.
7️⃣ KPI Definition Sheet
Ensure transparency with a dedicated reference sheet containing KPI Name, Unit, Formula, and Definition — helping teams stay aligned and consistent.
🧭 How to Use the Veterinary KPI Dashboard in Excel
1️⃣ Input Data: Add monthly Actual, Target, and Previous Year values.
2️⃣ Select Month: Choose your reporting month on the Dashboard sheet.
3️⃣ Analyze Performance: Review charts, arrows, and cards for instant insight.
4️⃣ Track Trends: Explore the KPI Trend sheet for long-term analysis.
5️⃣ Update Regularly: Enter new data each month to keep your dashboard fresh.
In just a few clicks, your Excel file becomes a performance intelligence system for veterinary excellence. 🐕💼
👥 Who Can Benefit from This Dashboard
🏥 Clinic Owners: Monitor profitability, growth, and patient inflow across branches.
👩⚕️ Veterinarians: Track patient recovery rates, treatment efficiency, and satisfaction.
📊 Managers & Administrators: Analyze operations, optimize resources, and identify bottlenecks.
💰 Finance Teams: Compare revenue, expenses, and profit margins for informed budgeting.
📈 Consultants & Analysts: Evaluate trends to enhance business and service performance.
Whether you manage one clinic or multiple locations, this Excel dashboard helps transform data into actionable veterinary insights.
🔗 Click here to read the Detailed Blog Post
🎥 Visit our YouTube channel to learn step-by-step video tutorials
Watch the step-by-step video tutorial:
Compatibility and Requirements
- Works in Microsoft Excel desktop (Excel 2016 or later, or Microsoft 365).
- The month selector and KPI picker are dropdown lists. Microsoft explains them in Create a drop-down list.
Frequently Asked Questions
Which sheets are included?
Seven: Home, Dashboard, KPI Trend, Actual Numbers, Target, Previous Year Numbers and KPI Definition.
How do I change the reporting month?
Pick a month in cell D3 on the Dashboard sheet and all KPI charts and cards refresh.
How do I see a KPI over time?
On the KPI Trend sheet, select a KPI name in cell C3 to see MTD, YTD and previous year trend charts with its formula, group and unit.
What do the red and green icons mean?
A green up arrow shows a target was met. A red down arrow shows underperformance.
Can I add my own KPIs?
Yes. You can add or edit KPIs to match your clinic’s needs.
Related Veterinary Templates
- Veterinary Services KPI Dashboard in Power BI: the same topic for Power BI users
- Veterinary Clinic KPI Dashboard in Excel: KPIs for a single clinic
- Veterinary Clinic KPI Dashboard in Google Sheets: clinic KPIs in Google Sheets
- Veterinary Services Dashboard in Excel: a full dashboard for veterinary data
- Veterinary Clinic Dashboard in Excel: clinic operations at a glance
Browse all Excel KPI dashboards or the Excel dashboards.












Reviews
There are no reviews yet.