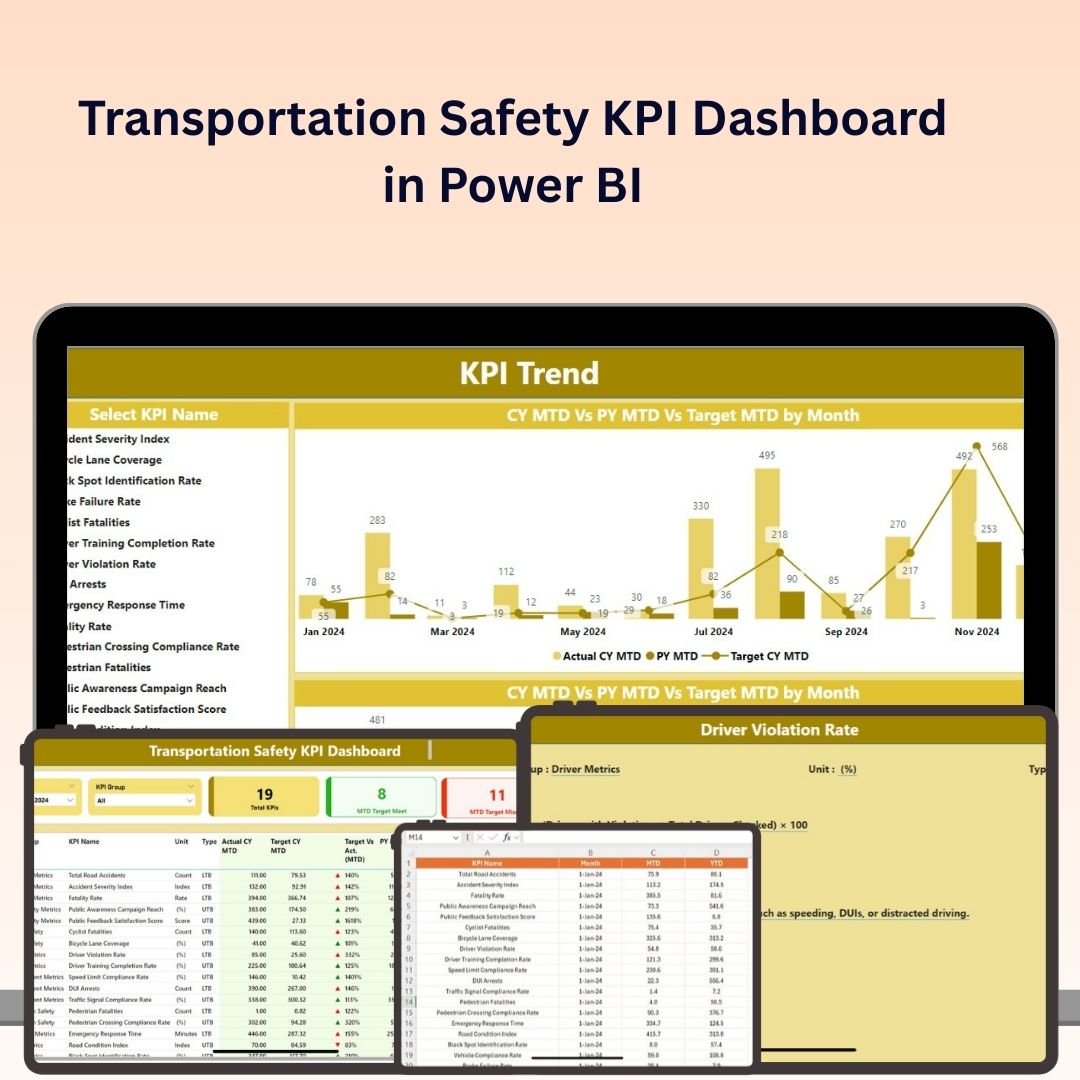

The Transportation Safety KPI Dashboard in Power BI is an essential tool for fleet managers, safety officers, and business owners who need to monitor and optimize safety performance in transportation and logistics operations. This Power BI-based dashboard allows you to track key performance indicators (KPIs) such as accident rates, incident response times, driver performance, vehicle safety inspections, and compliance, enabling you to improve safety measures and reduce risks within your transportation fleet.
With real-time tracking, interactive visualizations, and customizable reports, this dashboard provides valuable insights into safety performance, allowing you to make informed decisions, prevent accidents, and ensure regulatory compliance across your fleet.
Key Features of the Transportation Safety KPI Dashboard in Power BI:
🚚 Accident and Incident Tracking
Track the frequency and severity of accidents and incidents, including the number of accidents per mile and accident types, to monitor safety performance.
🛠 Vehicle Safety Inspections
Monitor vehicle inspections, ensuring that your fleet is compliant with safety regulations and operating at peak efficiency.
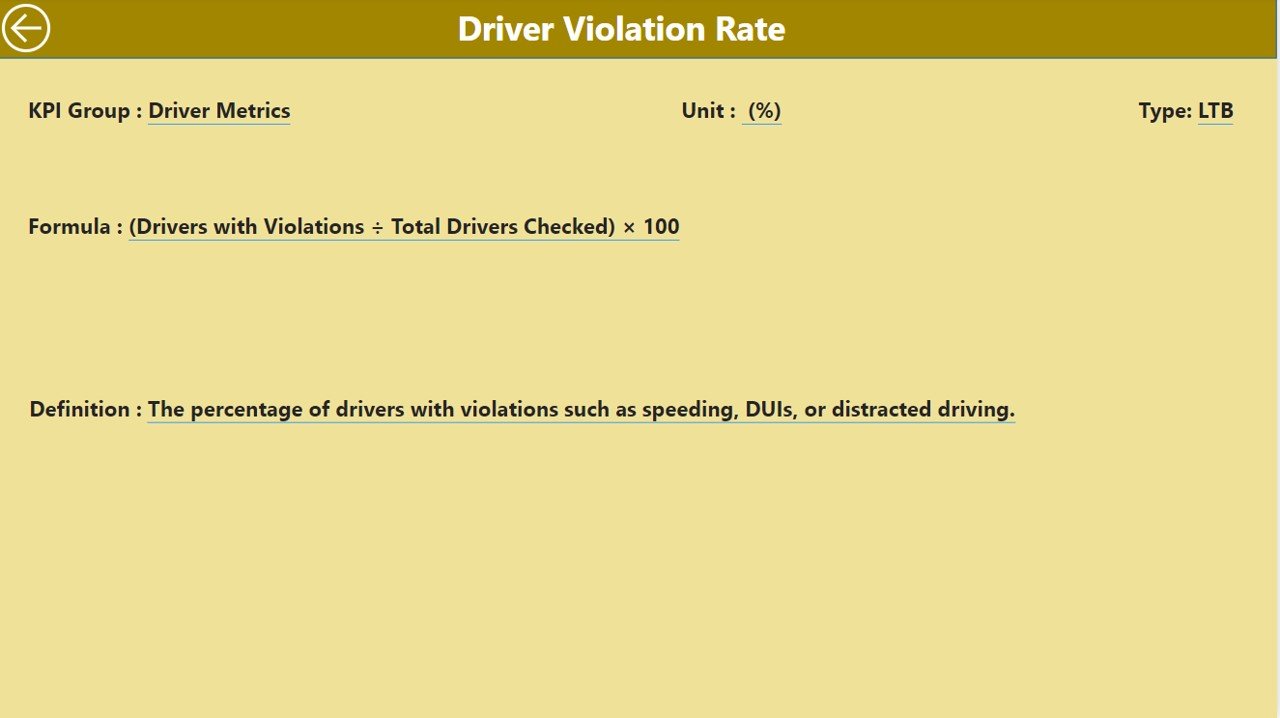
👨✈️ Driver Performance Metrics
Evaluate driver safety performance, including speeding violations, seatbelt usage, and adherence to safety protocols, to ensure safe driving practices.
⏱ Incident Response and Resolution Time
Track how long it takes to respond to and resolve safety incidents, helping you optimize response times and improve incident management processes.
💡 Compliance and Regulatory Monitoring
Ensure that your fleet is compliant with transportation regulations, including vehicle maintenance standards, safety inspections, and driver certifications.
🚀 Why You’ll Love the Transportation Safety KPI Dashboard in Power BI:
✅ Monitor Fleet Safety – Track accident rates, incident responses, and driver behavior to ensure your fleet is operating safely.
✅ Optimize Incident Management – Use response time data to improve how quickly and effectively incidents are managed and resolved.
✅ Enhance Driver Safety – Monitor driver performance to ensure adherence to safety protocols, reduce violations, and prevent accidents.
✅ Ensure Regulatory Compliance – Keep track of vehicle safety inspections, driver certifications, and other compliance-related KPIs to meet industry regulations.
✅ Customizable and Interactive – This Power BI dashboard is fully customizable, allowing you to adjust it to meet the unique needs of your transportation operations.
✅ Data-Driven Decisions – Use real-time data to make informed decisions about fleet safety, vehicle maintenance, and driver training.
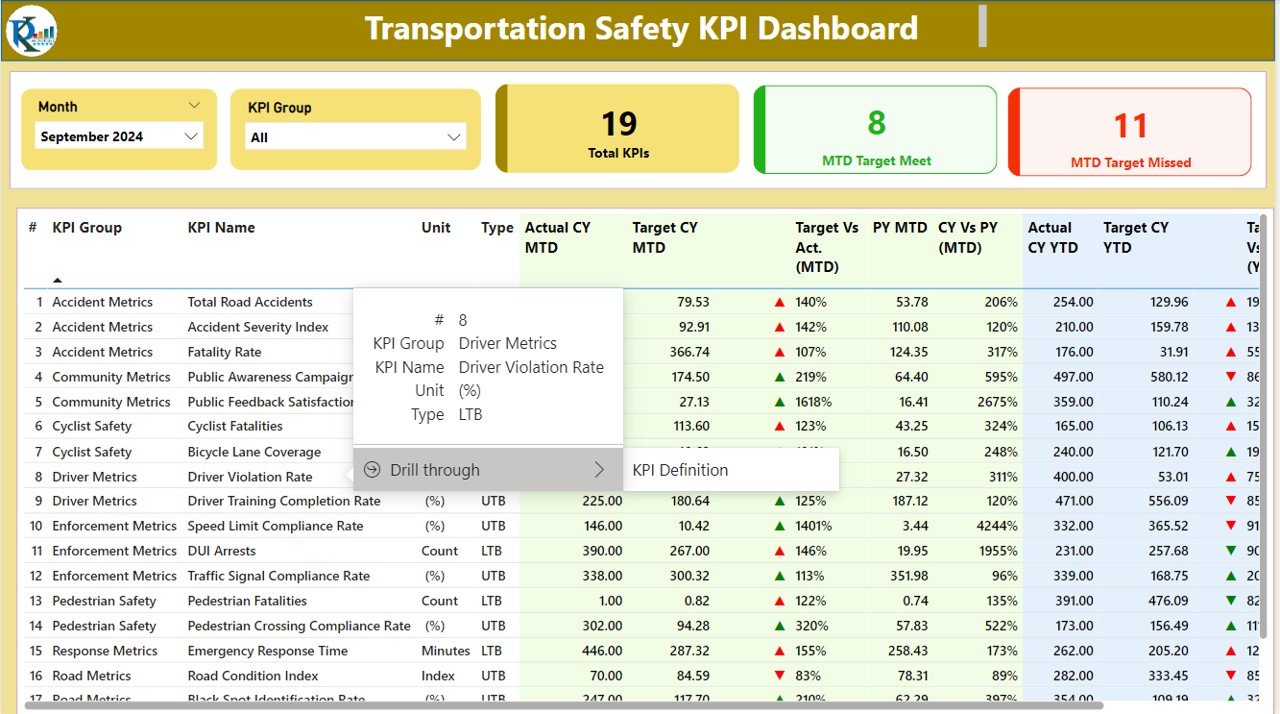
What’s Inside the Transportation Safety KPI Dashboard in Power BI:
- Accident and Incident Tracking: Monitor the number of accidents per mile, accident types, and severity to evaluate safety trends and areas for improvement.
- Driver Performance Metrics: Track driver behavior, including speeding violations, seatbelt usage, and other safety practices.
- Vehicle Safety Inspections: Ensure that your fleet is regularly inspected and compliant with transportation safety regulations.
- Response Time Tracking: Measure incident response times to assess how quickly your team reacts to safety issues and incidents.
- Compliance Monitoring: Track whether your fleet is in compliance with industry regulations and safety standards, including vehicle maintenance and driver certifications.
- Custom Reports: Generate customized safety reports for stakeholders, management, or compliance purposes to communicate your fleet’s safety performance.
How to Use the Transportation Safety KPI Dashboard in Power BI:
1️⃣ Download the Template – Instantly access your Power BI file upon purchase.
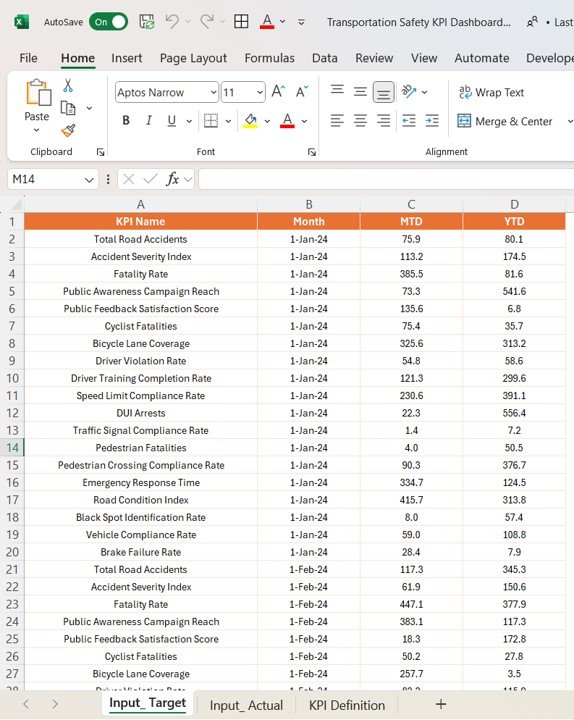
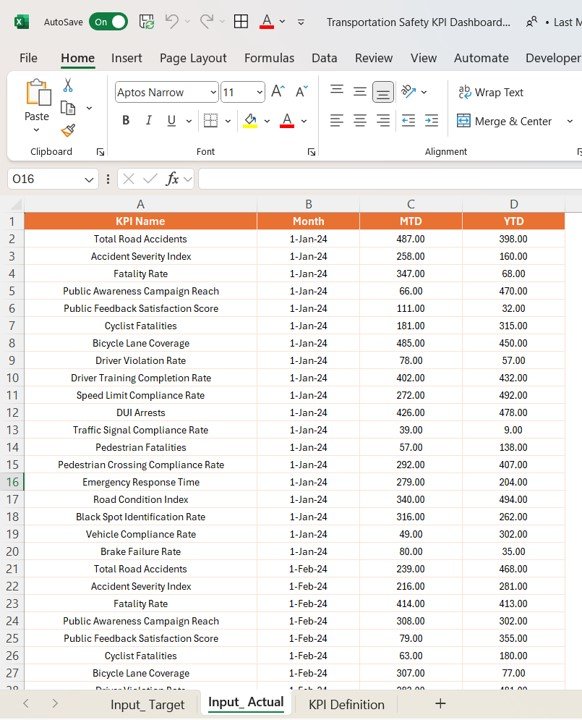
2️⃣ Input Safety Data – Enter data such as accident reports, vehicle inspection records, driver performance, and compliance information into the dashboard.
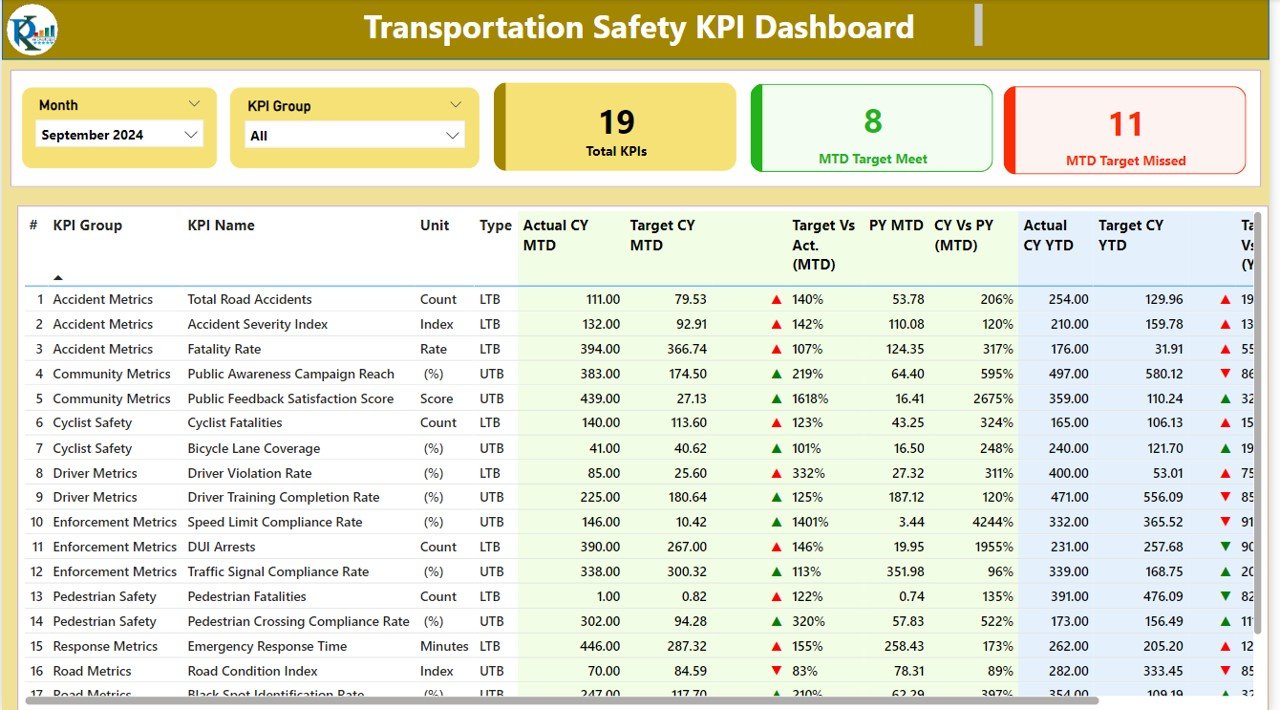
3️⃣ Track Key Metrics – Monitor safety KPIs in real-time, including accidents, response times, vehicle inspections, and driver behavior.
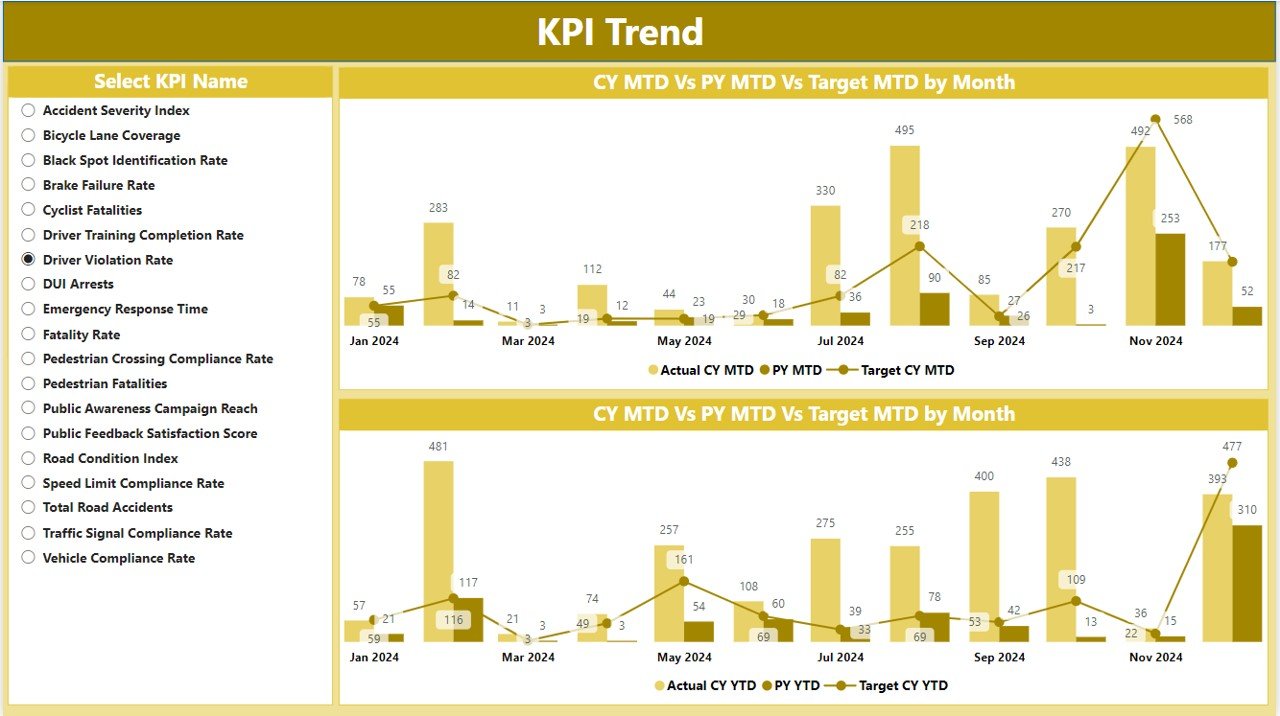
4️⃣ Analyze Trends – Use interactive charts to visualize trends in safety incidents, compliance, and driver performance across different time periods and vehicle types.
5️⃣ Generate Reports – Create customized reports to share with stakeholders or use for compliance purposes, ensuring that safety goals are being met.
Who Can Benefit from the Transportation Safety KPI Dashboard in Power BI:
- Fleet Managers
- Safety Officers
- Logistics Managers
- Operations Managers
- Compliance Officers
- Driver Training Managers
- Business Owners in Transportation
- Data Analysts in the Logistics and Transportation Sector
The Transportation Safety KPI Dashboard in Power BI is an essential tool for anyone managing a fleet of vehicles or overseeing transportation operations. It helps you improve safety, reduce risk, optimize driver performance, and ensure compliance with safety regulations.
Click here to read the Detailed blog post
https://www.pk-anexcelexpert.com/transportation-safety-kpi-dashboard-in-power-bi/
Visit our YouTube channel to learn step-by-step video tutorials
Youtube.com/@PKAnExcelExpert


Reviews
There are no reviews yet.