The Telecommunications Dashboard in Excel is a comprehensive tool designed to help telecom companies, customer service managers, and technicians track and manage essential service-related data. From ticket resolution times to customer satisfaction and technician performance, this dashboard helps you stay on top of your metrics and improve operational efficiency. With its powerful visualizations and real-time data tracking, this tool is crucial for making data-driven decisions that optimize telecom operations.
🔑 Key Features of the Telecommunications Dashboard:
-
Comprehensive KPI Tracking: Track key metrics such as ticket volume, response times, resolution times, customer satisfaction, and technician performance.
-
Real-Time Data Updates: Automatically update charts and KPIs as new data is entered into the system, ensuring you’re always working with the latest information.
-
Customizable Dashboard: Easily customize the dashboard to match your organization’s unique needs, with flexible options to modify data views, charts, and themes.
-
Data Visualizations: Use pie charts, bar charts, and line charts to gain a deeper understanding of your telecom operations and trends.
-
Slicers for Easy Filtering: Use slicers to filter data by region, service type, priority, and other categories to gain more granular insights.
What’s Inside the Telecommunications Dashboard in Excel 📅📊
The Telecommunications Dashboard is packed with multiple worksheets and charts, each focusing on different aspects of telecom operations:
-
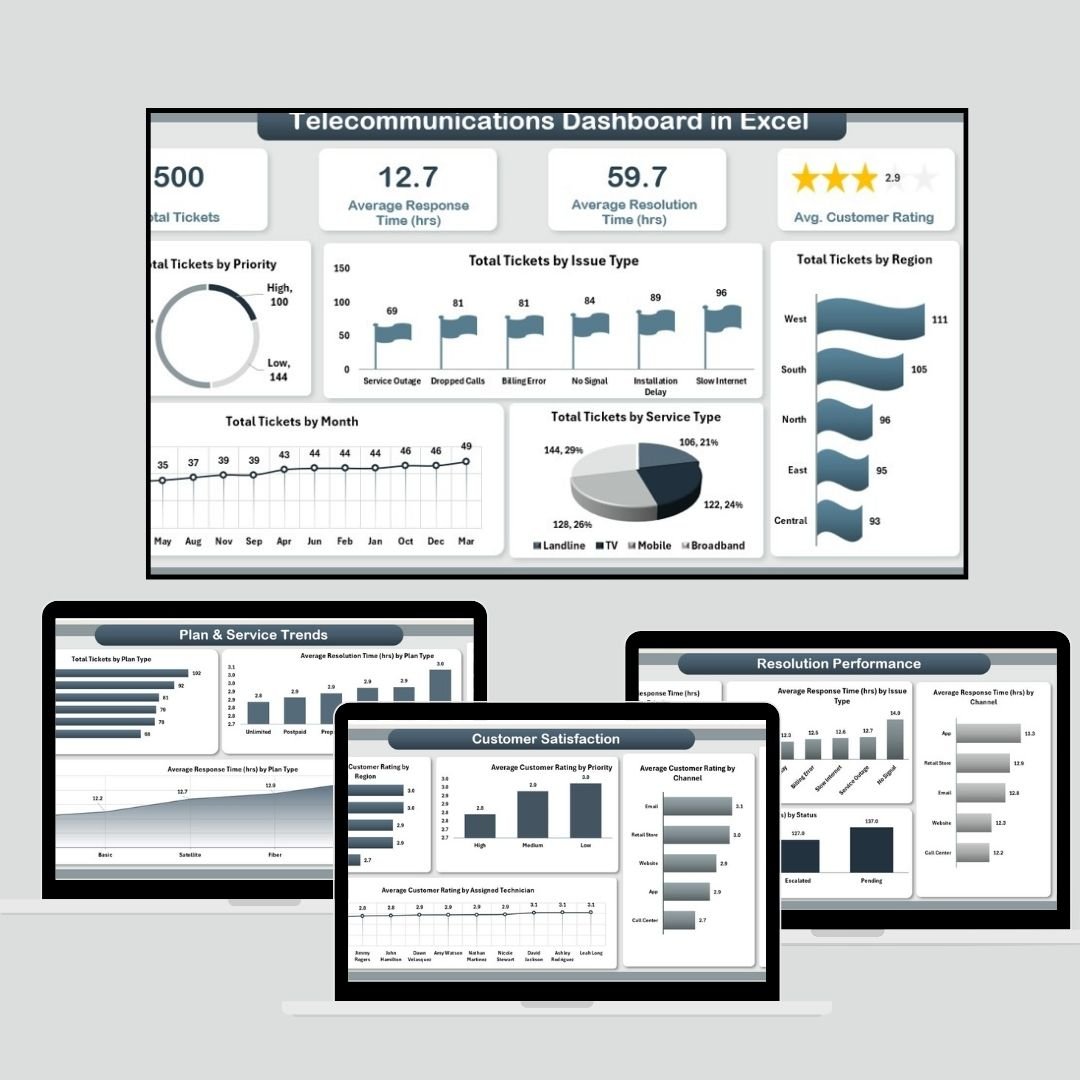
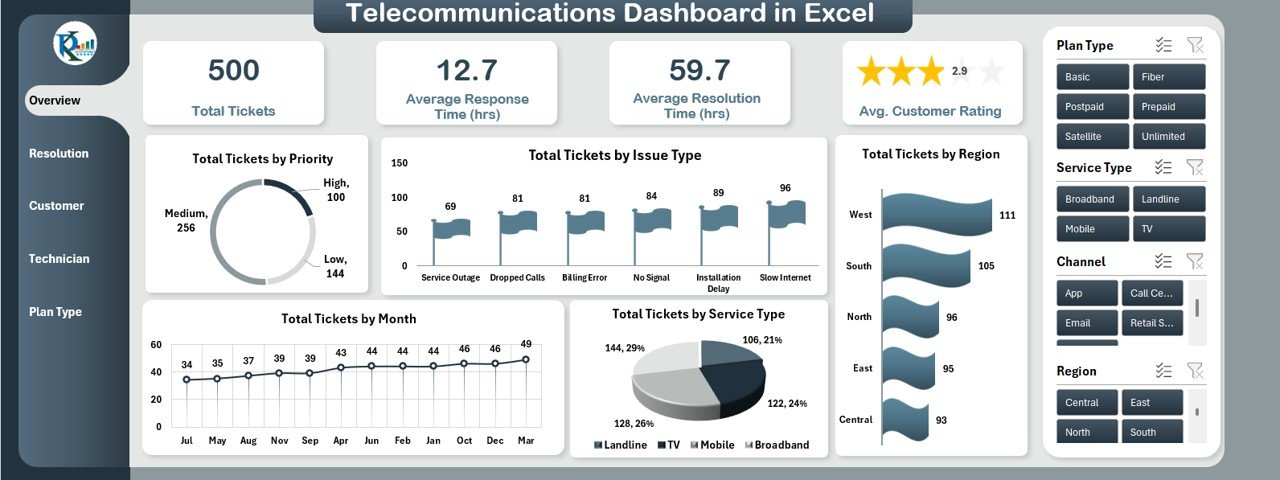
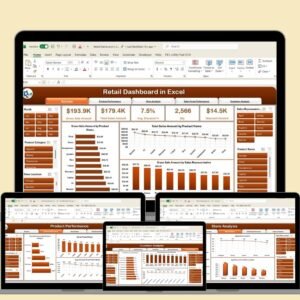
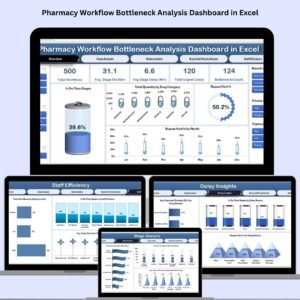
Overview Sheet: This is the landing page of the dashboard, where you can track key metrics such as:
-
Total Tickets: View the total number of tickets raised.
-
Avg. Resolution Time: Monitor the average time it takes to resolve tickets.
-
Avg. Response Time: Track the average response time for tickets.
-
Avg. Customer Rating: See the average rating customers give for your services.
-
Charts: Visualize ticket distribution by priority, issue type, region, service type, and monthly trends.
-
-
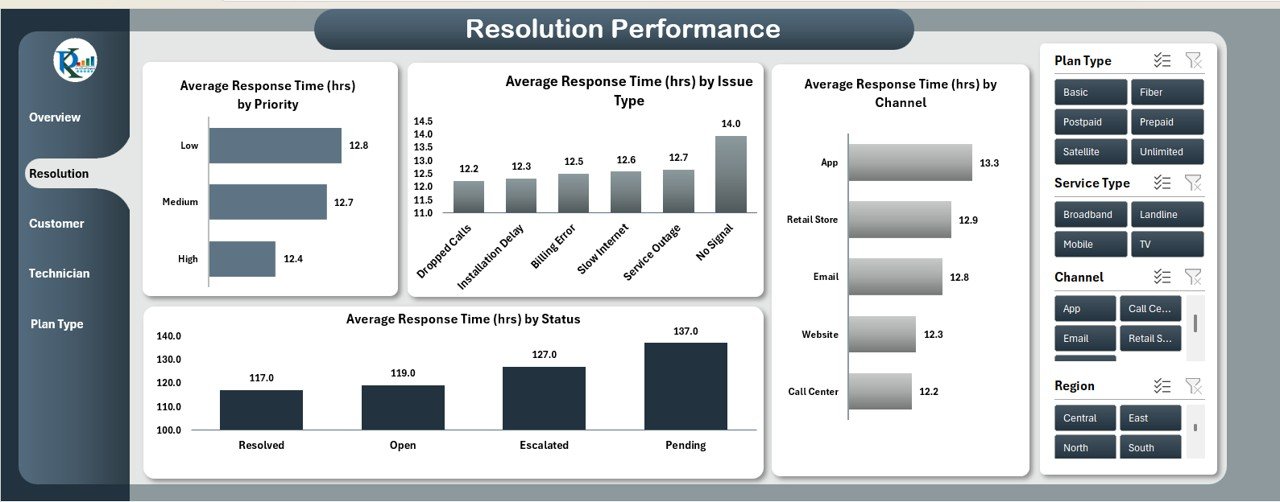
Resolution Performance Sheet: Focuses on the efficiency of your ticket resolution process with:
-
Response Times by Priority, Issue Type, Status, and Channel: View how efficiently tickets are being handled across various metrics.
-
-
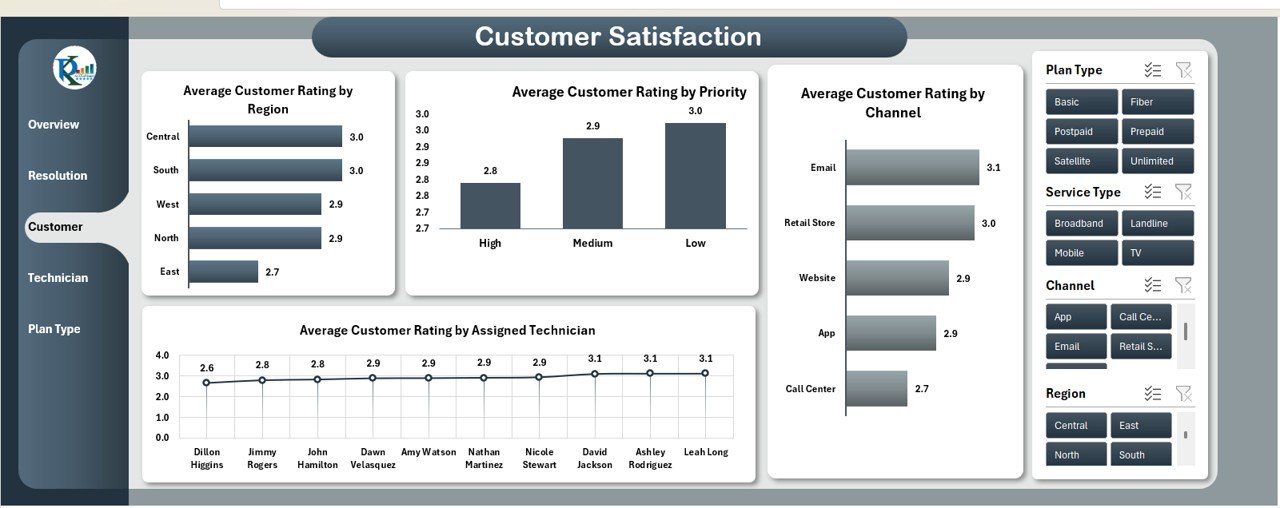
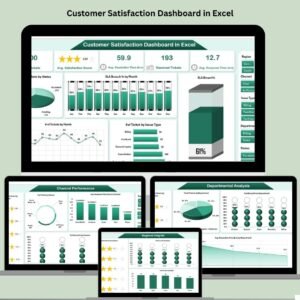
Customer Satisfaction Sheet: Track customer satisfaction and ratings with:
-
Ratings by Region, Priority, Channel, and Technician: See how customers rate your service in different regions, by ticket priority, and by communication channel.
-
-
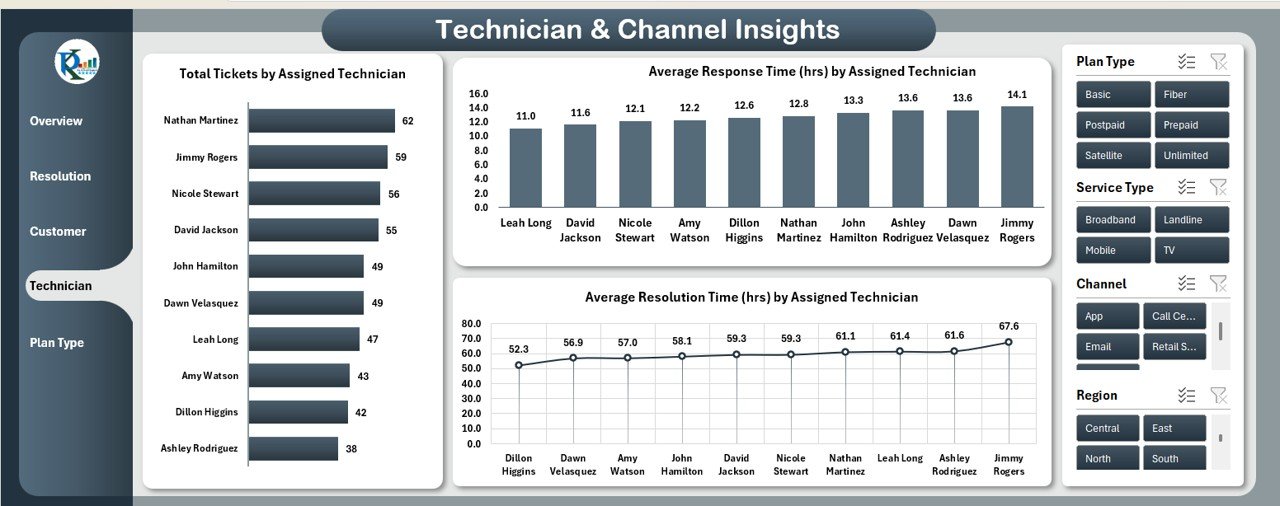
Technician & Channel Insights Sheet: Analyze technician and communication channel performance with:
-
Total Tickets by Technician: Track the number of tickets handled by each technician.
-
Response and Resolution Times by Technician: Monitor individual technician performance across different service metrics.
-
-
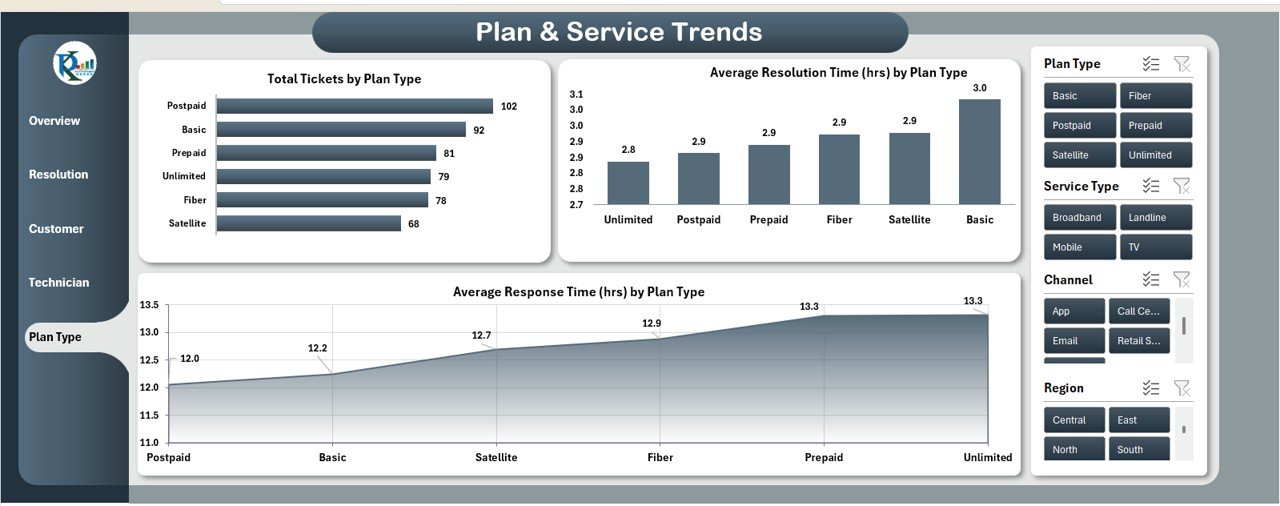
Plan & Service Trends Sheet: Analyze service and plan-specific trends to understand how different service plans and issues affect customer satisfaction and operational efficiency.
-
Tickets by Plan Type: See the number of tickets raised per service plan.
-
Response and Resolution Times by Plan Type: Monitor performance across different service plans.
-
-
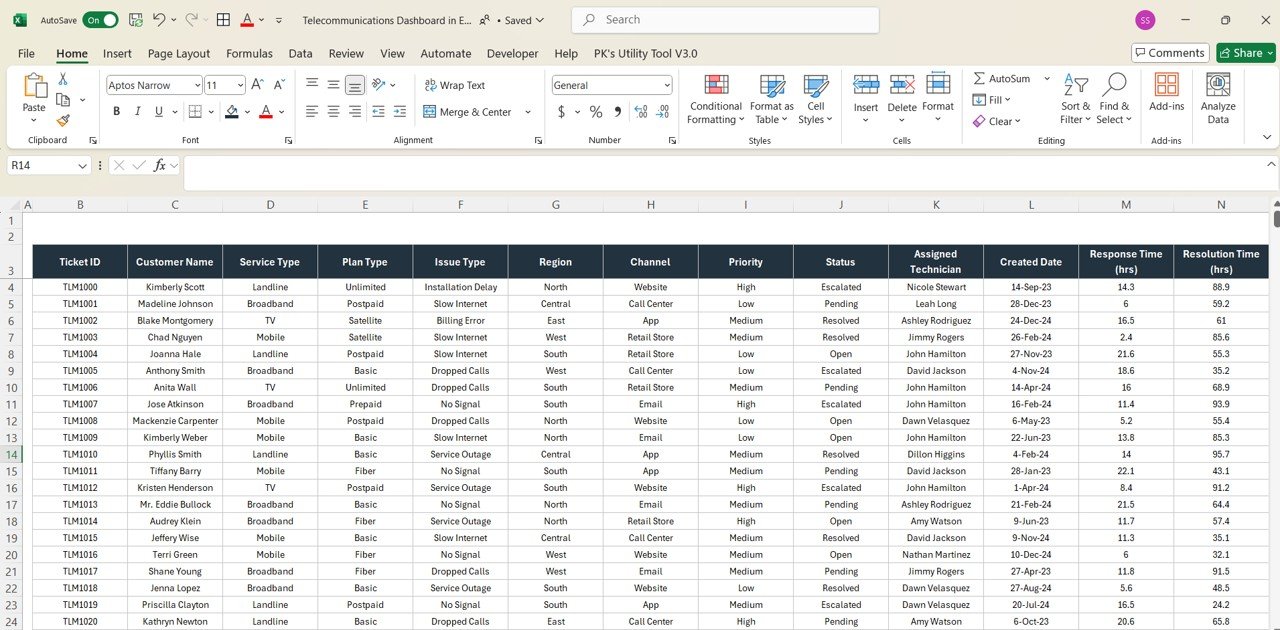
Data Sheet: This sheet serves as the backend, containing raw data such as:
-
Ticket ID, Customer Name, Service Type, Issue Type, Region, Channel: All essential details for tracking and managing each ticket.
-
Ticket Status, Technician Assigned, Response/Resolution Time: Detailed information to track and manage each ticket’s progress.
-
How to Use the Telecommunications Dashboard in Excel 🖥️📋
To make the most of the Telecommunications Dashboard, follow these easy steps:
-
Download and Open the Template: Open the Excel file and begin entering your ticket data into the Data Sheet.
-
Customize the Dashboard: Adjust the slicers to filter data by region, service type, or priority, and choose your preferred color themes.
-
Track Performance: Use the Overview Sheet to monitor key metrics and view visualized trends.
-
Analyze Technician Performance: Check the Technician & Channel Insights Sheet to ensure your team is performing optimally.
-
Monitor Customer Satisfaction: Use the Customer Satisfaction Sheet to identify areas where improvements are needed.
Who Can Benefit from This Telecommunications Dashboard? 📱📈
This Telecommunications Dashboard is perfect for telecom service providers, customer support managers, and operations teams who need to efficiently monitor service performance. Whether you’re managing a call center, monitoring a technician team, or analyzing service plans, this tool is designed to help you optimize every part of your telecom operation.
-
Telecommunications Managers: Get a comprehensive view of all KPIs and make informed decisions about service improvements.
-
Customer Support Teams: Track response and resolution times to identify bottlenecks and optimize team performance.
-
Technicians: Monitor personal performance metrics to understand where improvements can be made.
-
Operations and Service Leaders: Analyze customer satisfaction and service trends to guide strategic decision-making.
Advantages of Using the Telecommunications Dashboard in Excel 📈🔍
-
Comprehensive Data Insights: Visualize all relevant data in one place, making it easy to understand key trends and performance metrics.
-
Real-Time Performance Tracking: The dashboard automatically updates, giving you the most current data available.
-
Improved Operational Efficiency: Identify performance gaps and address them swiftly to improve ticket resolution times and customer satisfaction.
-
Customer-Centric: Track and improve customer satisfaction metrics by analyzing feedback and resolution times across multiple variables.
-
Customizable and Scalable: Adapt the dashboard to fit your unique operational needs and scale as your telecom service grows.
Click here to read the Detailed Blog Post 📖


Reviews
There are no reviews yet.