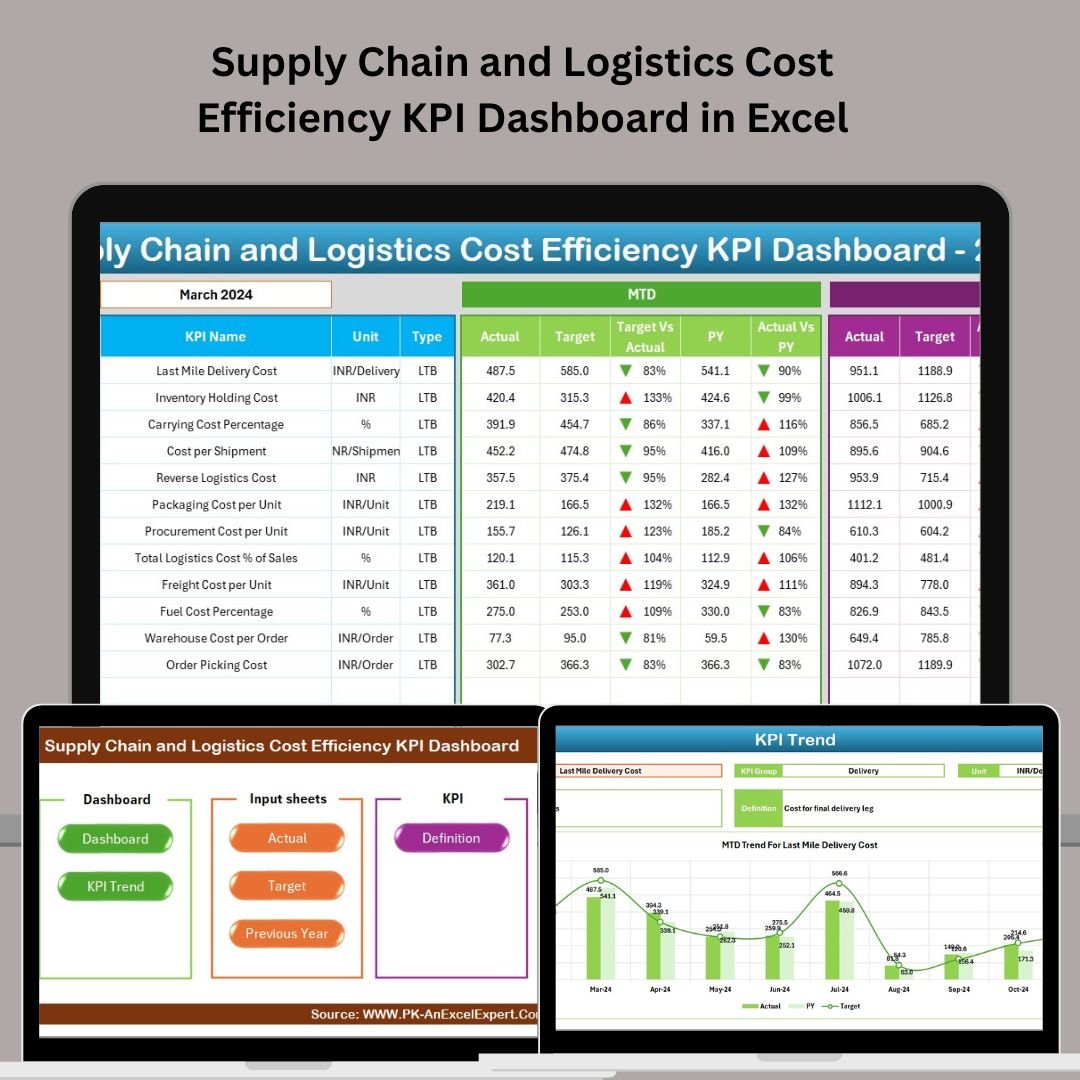

Controlling supply chain and logistics costs isn’t just about reducing expenses — it’s about improving operational efficiency, profitability, and strategic decision-making. The Supply Chain and Logistics Cost Efficiency KPI Dashboard in Excel empowers logistics professionals to track every dollar, benchmark performance, and take data-driven actions using one dynamic tool.
Whether you’re managing warehouses, transportation, procurement, or full-chain operations, this dashboard provides clear, visual, and actionable insights — without the need for complicated software.
✨ Key Features of the Cost Efficiency KPI Dashboard
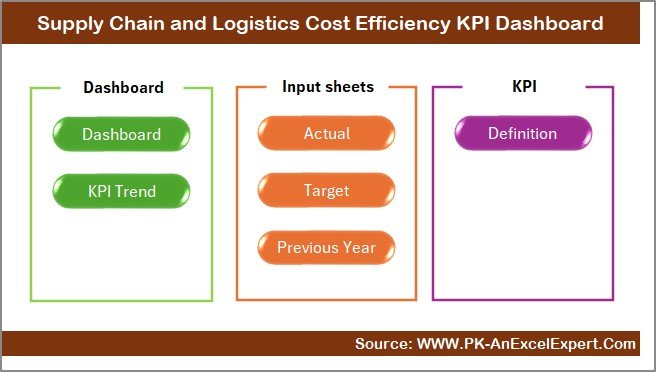
🖥️ 7 Well-Organized Worksheet Tabs
-
Home Sheet – Easy navigation via clickable buttons
-
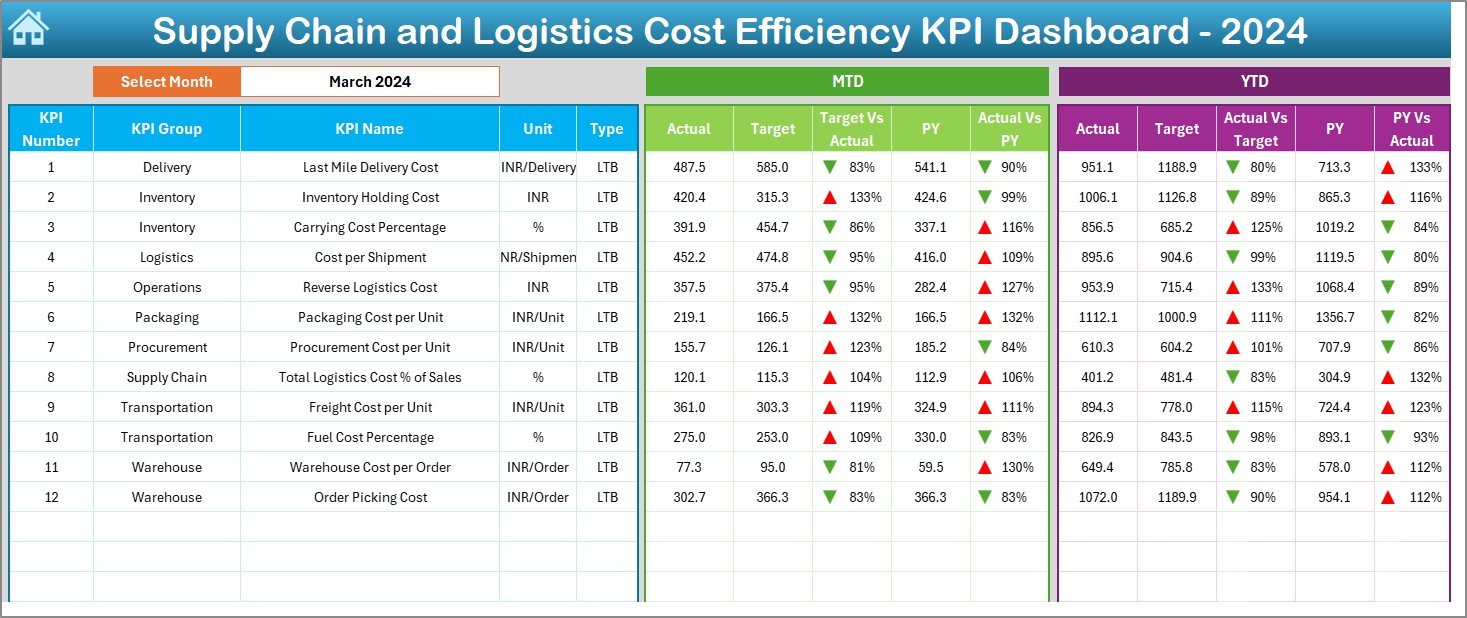
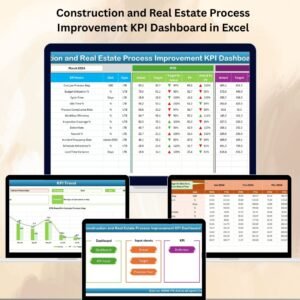
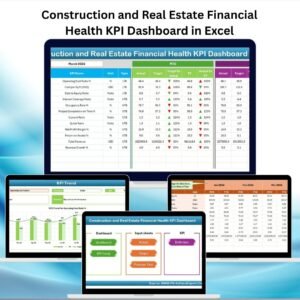
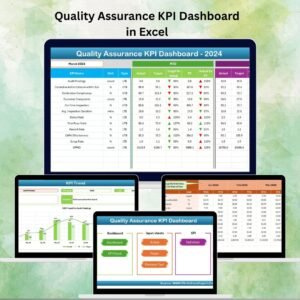
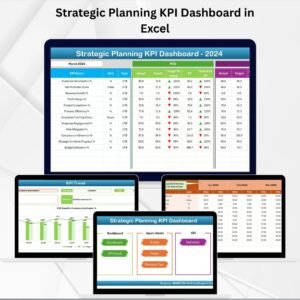
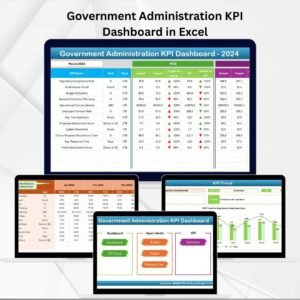
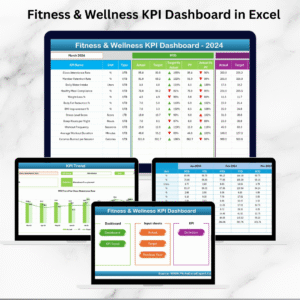
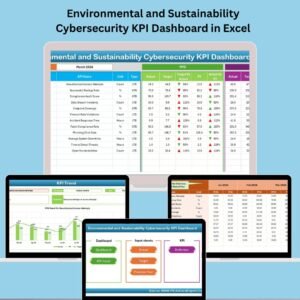
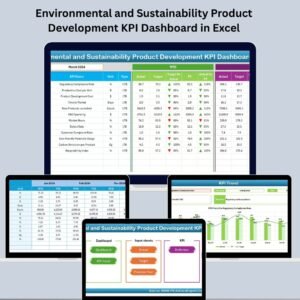
Dashboard Sheet – Visual summary of MTD and YTD KPIs
-
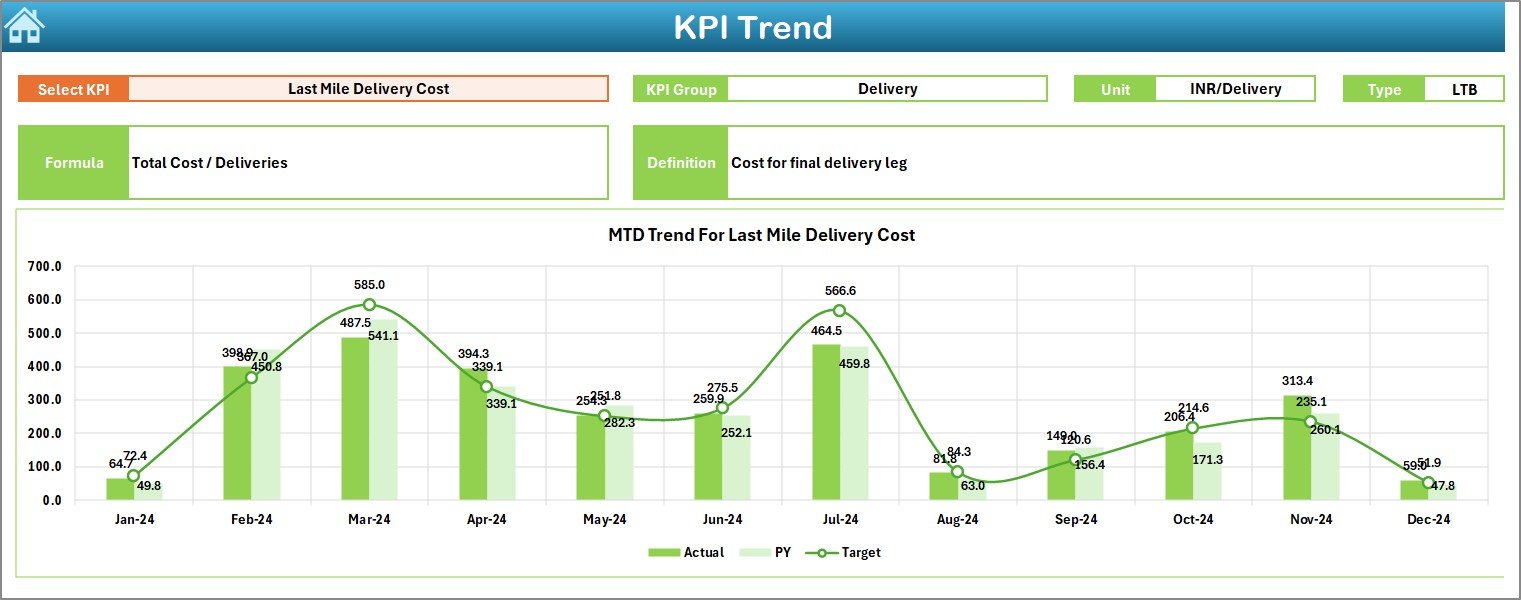
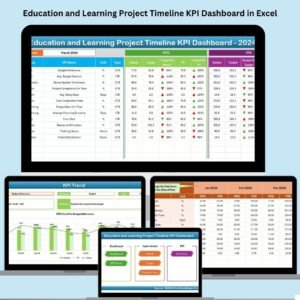
KPI Trend Sheet – Drill down into specific KPI trends
-
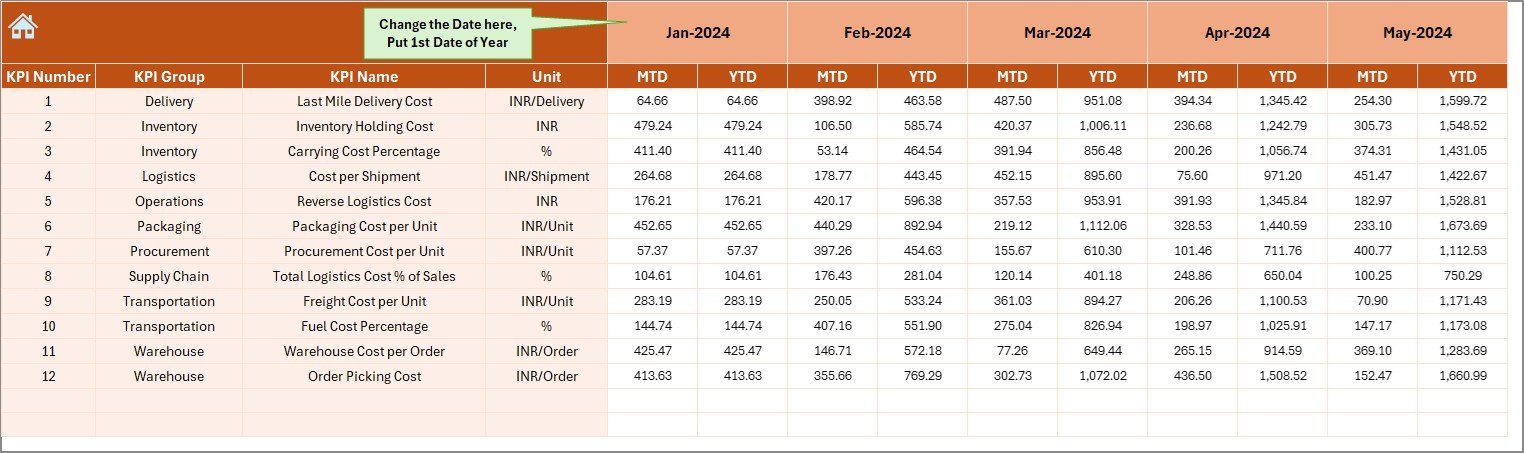
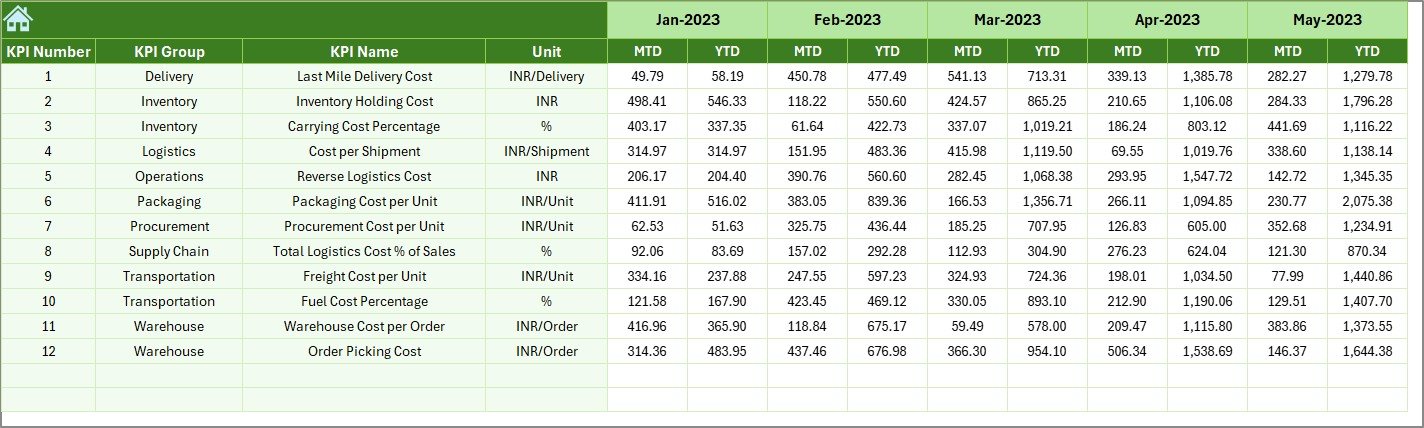
Actual Numbers Input Sheet – Monthly actuals in a clean format
-
Target Sheet – Enter MTD and YTD performance targets
-
Previous Year Sheet – Store last year’s actuals for YoY comparison
-
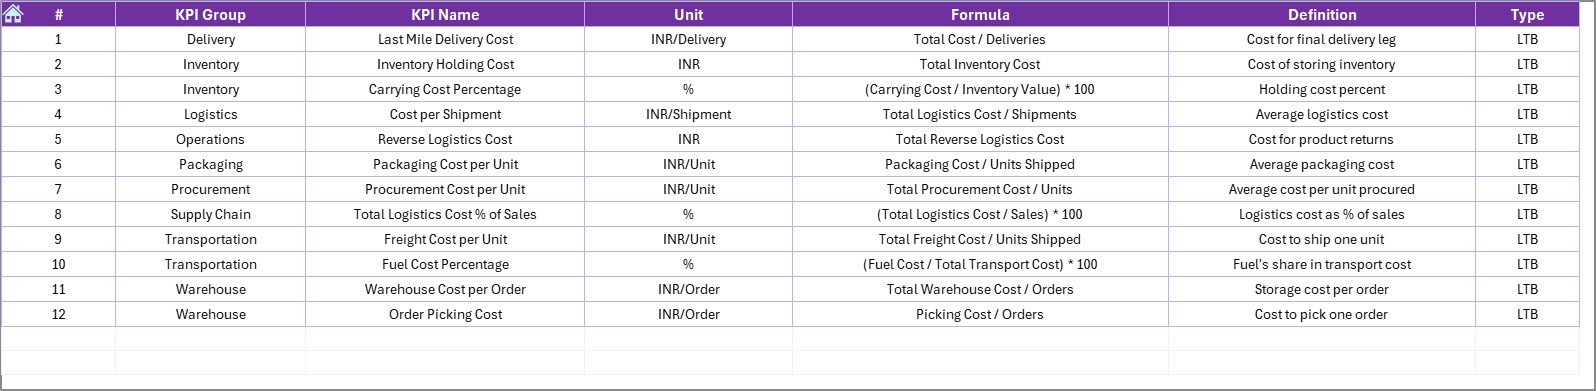
KPI Definition Sheet – Maintain formulas, units, and definitions
📊 Interactive Dashboard with Monthly Selection
-
Choose any month from a dropdown in cell D3
-
View comparisons of:
-
MTD Actual vs Target vs Previous Year
-
YTD Actual vs Target vs Previous Year
-
-
Trend arrows (↑↓) and color formatting highlight performance
📈 KPI Trend Analysis Sheet
-
Select any KPI from a dropdown
-
See MTD/YTD trends with side-by-side actual, target, and PY charts
-
View detailed KPI info like:
-
Group, Unit, Formula, Type (UTB/LTB), and Definition
-
📝 Data Entry Made Easy
-
Update actuals and targets monthly
-
Change your fiscal start month instantly in cell E1
-
All sheets and charts auto-refresh — no formulas needed
📦 What’s Inside the Excel Template?
🔹 One-Click Navigation from Home Tab
🔹 MTD & YTD Trend Comparison Views
🔹 Fully Editable KPI Definition Sheet
🔹 Pre-Built Visuals for Quick Insight
🔹 Scalable Design for Any Business Size
🔹 Built-in Automation (No Macros Needed)
🛠 How to Use the Dashboard
-
✅ Open the Excel file and go to the Actual Numbers Input Sheet
-
📥 Enter KPI data monthly — figures auto-sync with charts
-
🎯 Set your targets in the Target Sheet
-
🗃️ Enter previous year’s data for historical comparison
-
📊 Navigate to Dashboard & Trend Sheets to visualize insights
-
🧠 Use the KPI Definition Sheet to ensure metric consistency
Everything updates automatically — no need to touch the formulas.
👥 Who Should Use This Dashboard?
Perfect for:
📦 Logistics Managers – Track freight, warehouse, and distribution costs
🚚 Supply Chain Analysts – Monitor transportation, handling, and turnover KPIs
🏭 Procurement & Operations Teams – Measure efficiency and cost performance
🏢 SMEs and Enterprises – Scalable for all business sizes and industries
🚀 Advantages of This KPI Dashboard
📉 Reduce Operational Waste – Spot overspending and delays
📊 Make Smart Decisions Faster – Visual cues speed up reporting
📅 Track MTD & YTD – All metrics auto-update with every data entry
🔧 Customizable & Flexible – Add or edit KPIs, formulas, and targets
🧾 Performance Benchmarking – Compare actuals with targets and past performance
📤 Excel-Based – No subscriptions, plugins, or learning curve
🧠 Beginner-Friendly – Prebuilt sheets with dropdowns and visuals
💡 Best Practices for Using the Dashboard
🔁 Update Data Monthly – Keep your actuals and targets current
📊 Review Trends Weekly or Monthly – Use the trend sheet to monitor KPI health
🎨 Use Conditional Formatting – Pay attention to arrows and colors for red flags
👥 Collaborate Across Teams – Align procurement, logistics, and finance goals
💾 Backup Regularly – Maintain historical versions for long-term analysis
🔁 Click here to read the Detailed blog post
📺 Visit our YouTube channel to learn step-by-step video tutorials


Reviews
There are no reviews yet.